. 2018 Jan 30;16(1):e2004411.
doi: 10.1371/journal.pbio.2004411. eCollection 2018 Jan.

Role of the AP-5 adaptor protein complex in late endosome-to-Golgi retrieval

Affiliations

Role of the AP-5 adaptor protein complex in late endosome-to-Golgi retrieval

Jennifer Hirst et al. PLoS Biol. .

Abstract

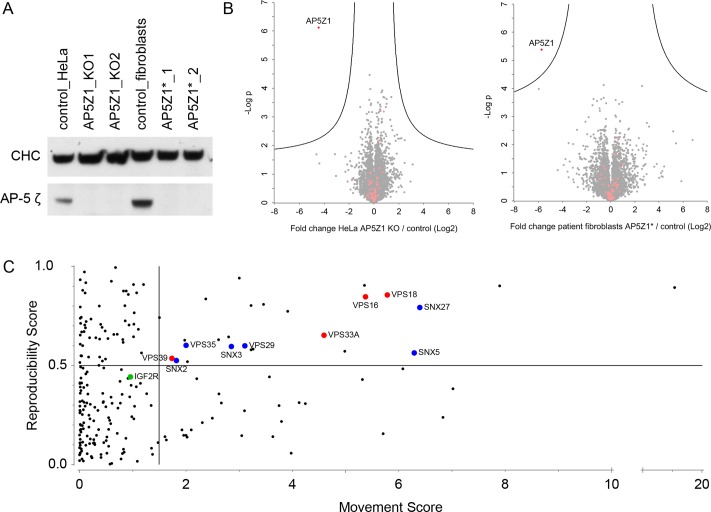
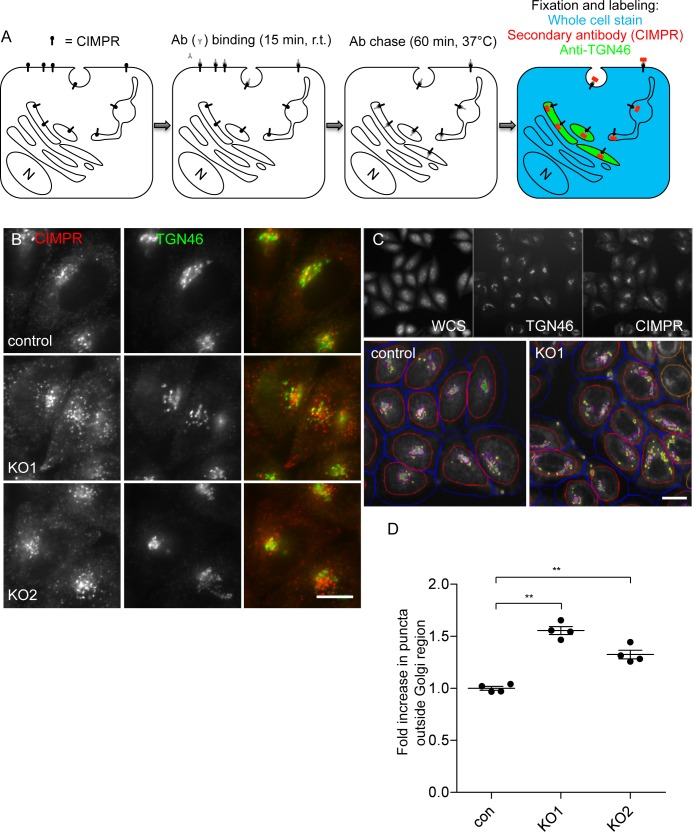
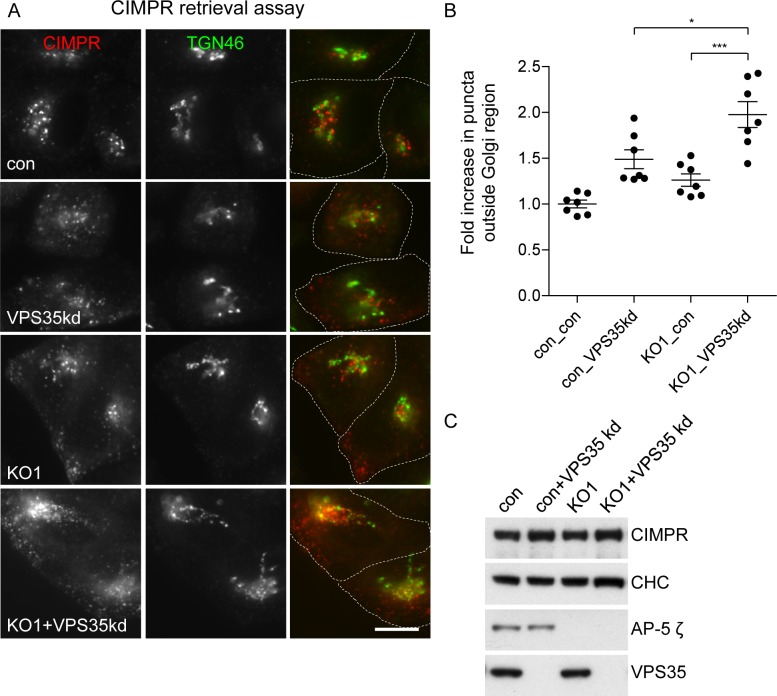
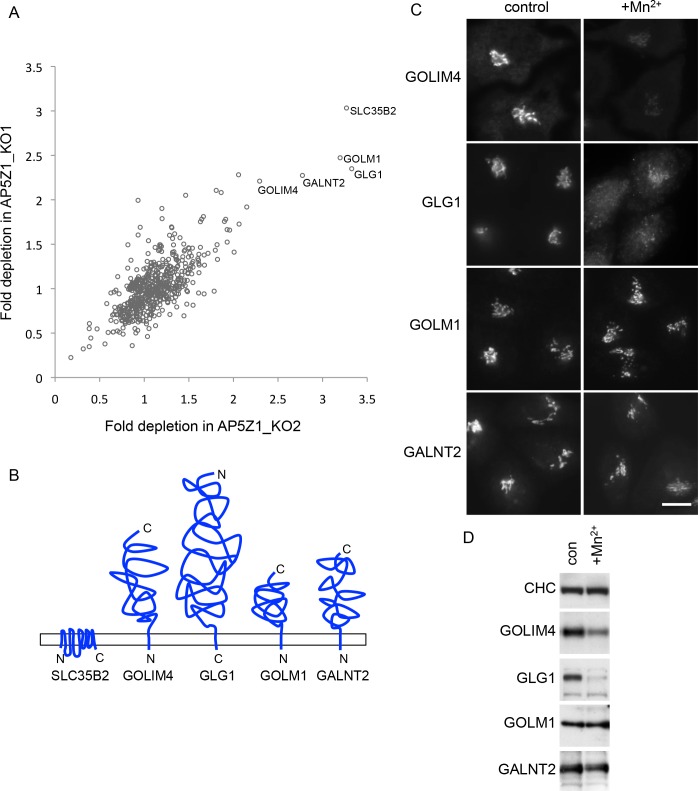
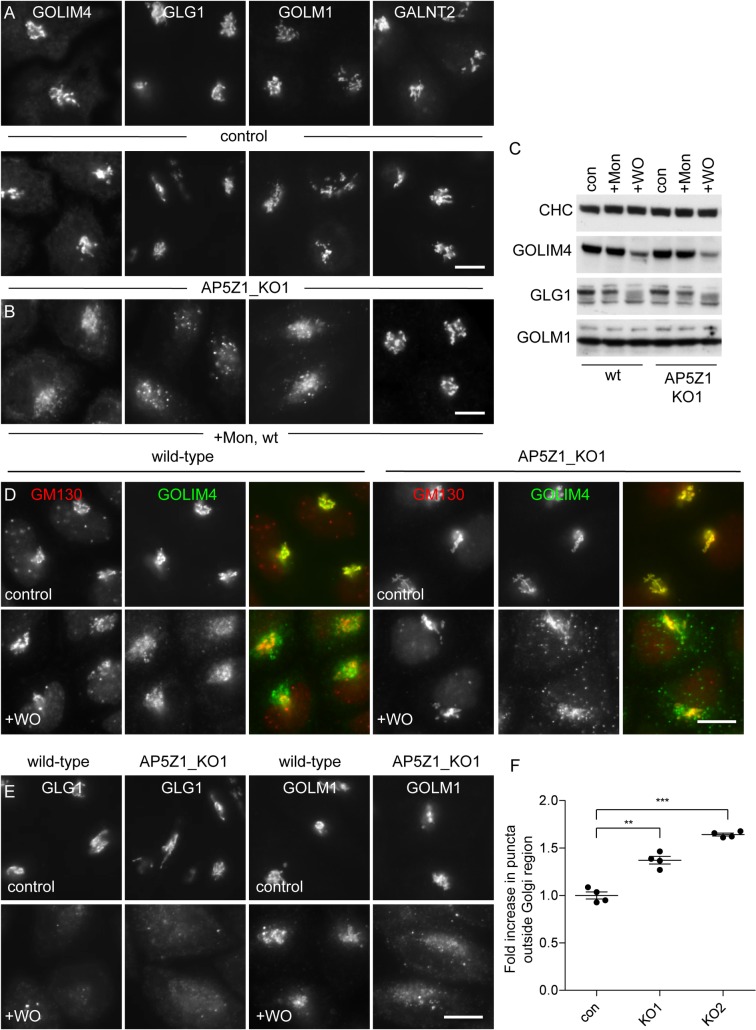
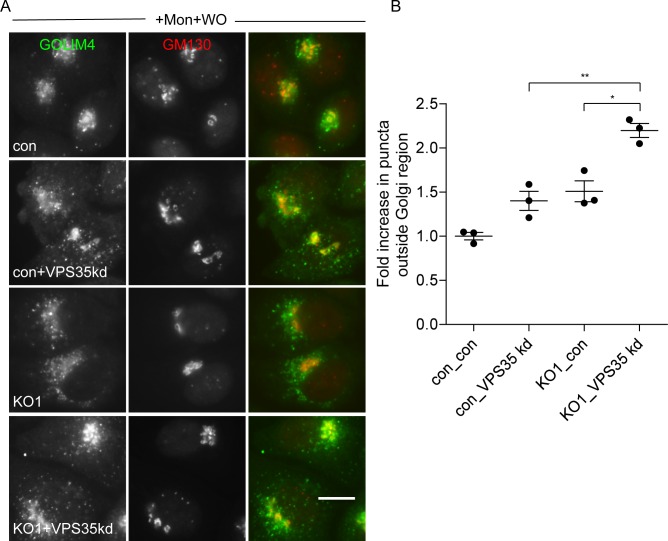
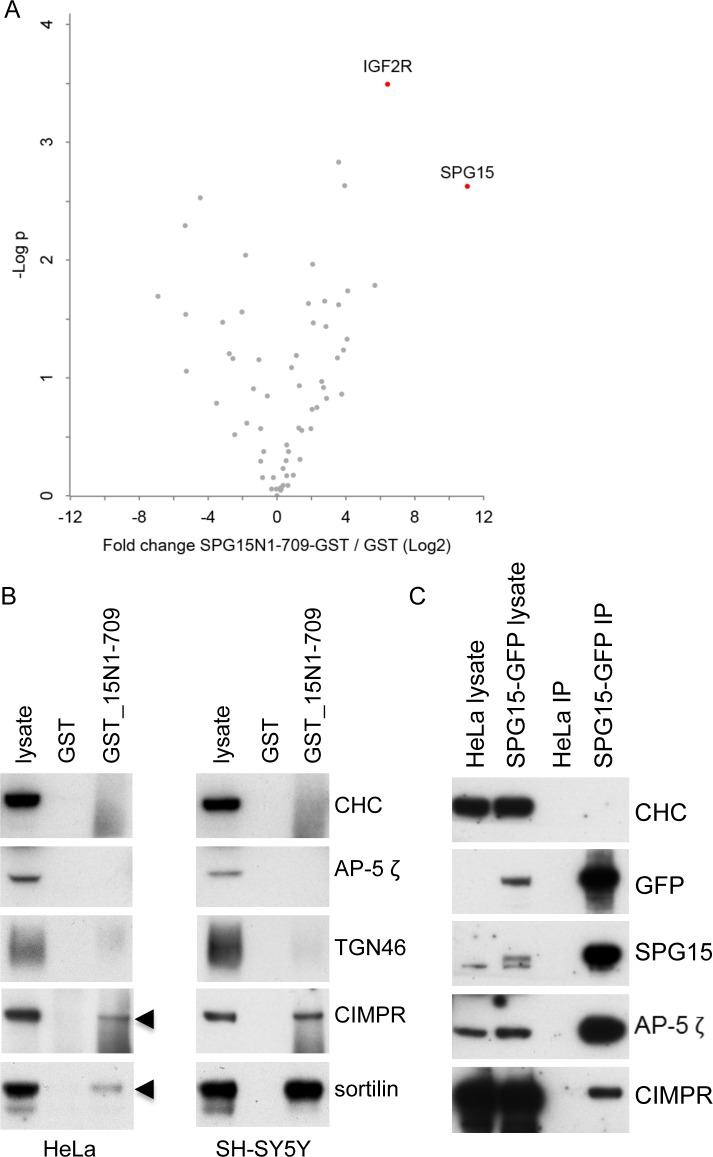
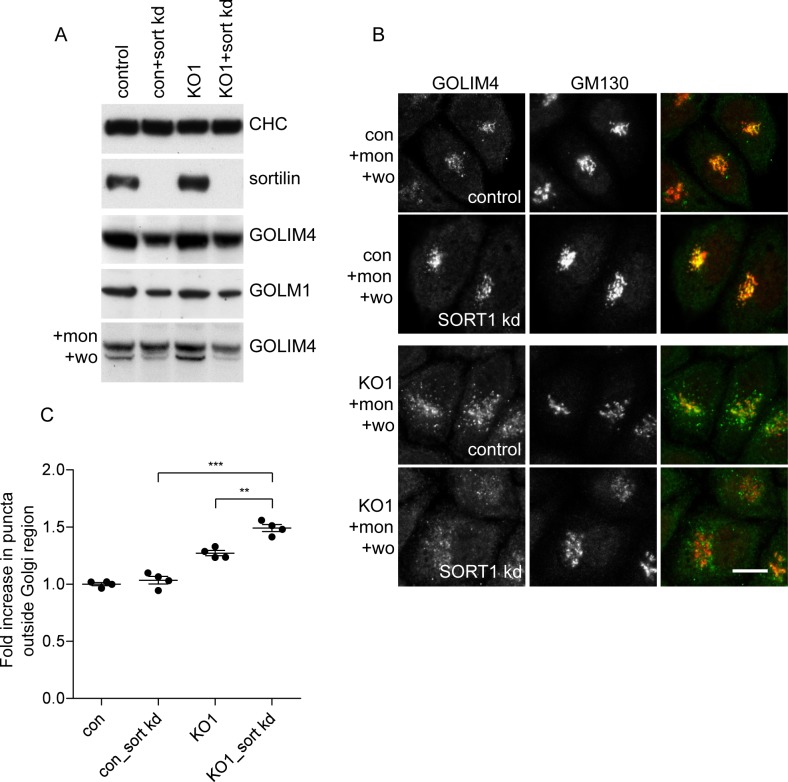
The AP-5 adaptor protein complex is presumed to function in membrane traffic, but so far nothing is known about its pathway or its cargo. We have used CRISPR-Cas9 to knock out the AP-5 ζ subunit gene, AP5Z1, in HeLa cells, and then analysed the phenotype by subcellular fractionation profiling and quantitative mass spectrometry. The retromer complex had an altered steady-state distribution in the knockout cells, and several Golgi proteins, including GOLIM4 and GOLM1, were depleted from vesicle-enriched fractions. Immunolocalisation showed that loss of AP-5 led to impaired retrieval of the cation-independent mannose 6-phosphate receptor (CIMPR), GOLIM4, and GOLM1 from endosomes back to the Golgi region. Knocking down the retromer complex exacerbated this phenotype. Both the CIMPR and sortilin interacted with the AP-5-associated protein SPG15 in pull-down assays, and we propose that sortilin may act as a link between Golgi proteins and the AP-5/SPG11/SPG15 complex. Together, our findings suggest that AP-5 functions in a novel sorting step out of late endosomes, acting as a backup pathway for retromer. This provides a mechanistic explanation for why mutations in AP-5/SPG11/SPG15 cause cells to accumulate aberrant endolysosomes, and highlights the role of endosome/lysosome dysfunction in the pathology of hereditary spastic paraplegia and other neurodegenerative disorders.


Conflict of interest statement

The authors have declared that no competing interests exist.

Figures

Fig 1
Fig 1. Comparison of control and AP5Z1-deficient cells.
(A) Whole cell lysates from control HeLa cells and HeLa AP5Z1 knockout lines (KO1 and KO2) (first three lanes), and control and AP5Z1 patient-derived fibroblast lines AP5Z1*_1 p.(Q587*) and AP5Z1* p.(R138*);(p.W441*) [9,15] (second three lanes). In the knockout and patient lines, there is complete loss of AP-5 ζ. CHC was included as a loading control. (B) Global proteome analysis. Left panel, HeLa cells: AP5Z1 knockout versus controls. Right panel, human fibroblasts: AP5Z1* versus matched controls. Whole cell lysates were analysed by label-free quantification mass spectrometry. In both cell types, over 7,500 proteins were quantified. The x-axis shows the log2-fold change between AP-5–deficient and control cells; the y-axis shows the −log10 p-value of significance (2-sided t test). The ‘volcano’ lines indicate the significance threshold (FDR 0.12). For HeLa cells, 3 replicates from control cells and 3 replicates each from 2 independent AP5Z1-knockout cell lines (6 total) were compared (n = 3/6). For fibroblasts, 2 cell lines from patients with null mutations in AP5Z1 were compared to 2 matched control cell lines, each in duplicate (i.e., n = 4). Lysosomal proteins are indicated (salmon-coloured dots); their abundance does not change significantly in AP-5–deficient cells. Data can be found in S2 Data (HeLa intensity data and Fibroblast intensity data); the plots were generated using Perseus software. (C) Analysis of protein movement on dynamic organellar maps. Control HeLa cells and the 2 independent AP5Z1 knockout lines were subjected to proteomics-based organellar mapping, each in triplicate (see also S1 Fig). Maps from control and AP5Z1 knockout cells were then compared to detect proteins undergoing shifts in subcellular localization, in which the reproducibility score is a measure of the correlation between replicates of the same clone and between the 2 different AP5Z1 knockout clones. For each protein, the M and R of movement were calculated. Significantly shifting proteins have high M and R scores and are located in the top right quadrant of the MR plot; they are highly enriched in endosomal proteins. The estimated FDR was <0.23 at the cutoffs indicated by the vertical (M score threshold) and horizontal (R score threshold) lines. Subunits of the HOPS (red) and retromer (blue) complexes are highlighted. The cation-independent mannose 6-phosphate receptor (IGFR2R) is a marginal hit (significant at FDR 0.25). The figure focuses on the area of the MR plot in which significant changes are located (R score > 0); see S1 Data (MR plot data) for a complete list of all 2,046 profiled proteins. AP, adaptor protein; CHC, clathrin heavy chain; KO, knockout; M, magnitude; R, reproducibility.
Fig 2
Fig 2. Effect of retromer knockdown on SPG15-GFP localisation.
(A) Indirect immunofluorescence microscopy of SPG15-GFP–expressing cells depleted of either VPS35 or VPS26 by siRNA, and double labelled with antibodies against VPS35 and GFP. The GFP puncta are larger and brighter when VPS35 or VPS26 is depleted. Scale bar: 20 μm. (B) Whole cell homogenates of control, VPS35 knockdown, and VPS26 knockdown cells. VPS35 was knocked down with >95% efficiency and VPS26 with >80% efficiency. The knockdown of VPS26 reduces the protein levels of VPS35 and vice versa. SPG15-GFP is unchanged. (C) Indirect immunofluorescence microscopy of SPG15-GFP–expressing control, VPS35 knockdown, and VPS26 knockdown cells double labelled with antibodies against LAMP1 and GFP. There is substantial colocalisation of the 2 proteins. Scale bar: 20 μm. (D) Quantification of the increase in SPG15-GFP fluorescence using an automated microscope and a SpotDetector Bioapplication. The VPS35 knockdown causes increases in spot count per object (1.78 ± 0.09), spot average area per object (2.08 ± 0.08), and spot average intensity per object (2.09 ± 0.04). More than 1,500 cells were scored per knockdown condition (3 independent repeats); error bars indicate SEM. Because the number of spots per object goes up, the increases in fluorescence brightness are unlikely to be due to spot clustering. The raw data can be found in S4 Data. (E) Membrane-containing pellet and soluble cytosol fractions from SPG15-GFP–expressing cells, either control or after VPS35 knockdown. Equal amounts of protein were loaded into the PNS, MEM, and CYT lanes. Thus, in terms of starting volume, the MEM fraction was overloaded by about 5-fold. Knocking down retromer resulted in a 1.79 ± 0.23-fold increase in membrane-associated SPG15-GFP (3 biological repeats). CHC, clathrin heavy chain; con, control; CYT, cytosol; MEM, membrane; PNS, postnuclear supernatant; siRNA, small interfering RNA; SPG, spastic paraplegia gene.
Fig 3
Fig 3. CIMPR trafficking in control and AP5Z1 knockout cells.
(A) Schematic representation of the CIMPR retrieval assay, which follows the trafficking of endogenous CIMPR. (B) Indirect immunofluorescence microscopy of control and AP5Z1 knockout cells, which were pulse chased with an antibody against CIMPR, as shown in Fig 3A. In both knockout lines, there was reduced retrieval of anti-CIMPR back to the juxtanuclear region, as defined by TGN46 labelling. These results are consistent with the identification of AP-5 ζ (KIAA0415) as a potential hit in a genome-wide screen for proteins involved in endosomal retrieval [17]. Scale bar: 20 μm. (C) Quantification of the retrieval defect using an Arrayscan automated microscope. The whole cell stain allowed a mask to be drawn around the cells (red), an offset line was added to ensure that the whole cell was captured (blue), and the anti-TGN46 allowed a mask to be drawn around the TGN (pink). The CIMPR that failed to be retrieved back to the TGN is shown in yellow. Scale bar: 20 μm. (D) Analysis of the data from the Arrayscan microscope, using a Colocalisation Bioapplication. The fold increase in CIMPR (Object Total Area) that failed to be retrieved back to the juxtanuclear was 1.55 ± 0.04 for AP5Z1_KO1 and 1.32 ± 0.04 for AP5Z1_KO2. More than 1,500 cells were scored per knockdown condition (4 independent repeats; error bars indicate SEM). The raw data can be found in S4 Data. Ab, antibody; AP, adaptor protein; CIMPR, cation-independent mannose 6-phosphate receptor; con, control; KO, knockout; TGN, trans-Golgi network; WCS, whole cell stain.
Fig 4
Fig 4. Effect of combined loss of retromer and AP-5 on CIMPR retrieval.
(A) Immunofluorescence microscopy of control or AP5Z1 knockout cells depleted of VPS35 and pulse chased with anti-CIMPR, as shown in Fig 3A. Individually, the knockout of AP5Z1 or the knockdown of retromer caused a reduction in the retrieval of CIMPR back to the TGN region; this was further exacerbated when the knockout and knockdown were combined. The dotted lines indicate the boundaries of each cell. Scale bar: 20 μm. (B) Quantification of the retrieval defect of CIMPR, using the CX7 automated microscope and a Colocalisation Bioapplication. The increase in CIMPR (Total Object Count) that failed to be retrieved back to the TGN region was 1.48 ± 0.10 for VPS35 kd, 1.26 ± 0.07 for KO1, and 1.97 ± 0.14 for the combined KO1 plus VPS35 kd. More than 1,500 cells were scored per knockdown condition (7 independent repeats; error bars indicate SEM). The raw data can be found in S4 Data. (C) Whole cell lysates from control and AP5Z1 knockout lines. The steady-state levels of CIMPR are not significantly affected by loss of AP-5 or depletion of VPS35. In addition, the surface expression of CIMPR did not change substantially in the knockdown and knockout cells when compared to control, as determined by flow cytometry (VPS35kd 1.22 ± 0.36, KO1 1.12 ± 0.18, KO1+VPS35kd 1.25 ± 0.44). AP, adaptor protein; CHC, clathrin heavy chain; CIMPR, cation-independent mannose 6-phosphate receptor; con, control; KO, knockout; TGN, trans-Golgi network.
Fig 5
Fig 5. AP-5 knockout affects Golgi-localised proteins.
(A) Scatterplot comparing proteins that were depleted in vesicle-enriched fractions from SILAC-labelled AP5Z1_KO1 and AP5Z1_KO2 cells. Although AP-5 was not detected in the vesicle-enriched fraction, we looked for proteins whose trafficking through vesicular carriers might be altered by the loss of AP-5. Results are based on 2 biological repeats and show 5 Golgi-associated transmembrane proteins that were consistently depleted in both independent AP5Z1 knockouts. Data can be found in S2 Data. (B) Schematic diagram showing the topologies of the Golgi-associated proteins that were identified as possible hits in Fig 5A. (C) Indirect immunofluorescence microscopy of GOLIM4, GLG1, GALNT2, and GOLM1. The addition of manganese (Mn2+) for 4 h results in the redistribution of both GOLIM4 and GLG1 away from the Golgi region of the cell. Scale bar: 20 μm. (D) Whole cell lysates from control and Mn2+-treated cells. The addition of Mn2+ reduces the GOLIM4 signal by 52% and the GLG1 signal by 89%, presumably due to lysosomal degradation and consistent with the diminished immunofluorescence signal. AP, adaptor protein; CHC, clathrin heavy chain; con, control; KO, knockout; Mn2+, manganese; SILAC, stable isotope labelling of amino acids in cell culture.
Fig 6
Fig 6. Effect of AP-5 knockout and monensin washout on the Golgi-localised proteins.
(A) Indirect immunofluorescence microscopy of GOLIM4, GLG1, GOLM1, and GALNT2 in AP5Z1_KO cells. The localisation of the 4 proteins is unaffected by the knockout of AP5Z1 (compare with Fig 5C). Scale bar: 20 μm. (B) Indirect immunofluorescence microscopy of GOLIM4, GLG1, GOLM1, and GALNT2 following treatment with monensin for 90 min. GOLIM4, GLG1, and GOLM1 have redistributed away from the Golgi region. Scale bar: 20 μm. (C) Whole cell lysates of control and AP5Z1 knockout cells following treatment with monensin for 90 min and then a monensin washout for 2.25 h. GOLIM4 shows evidence of degradation after the washout in both control (54.5 ± 4.7%) and AP5Z1 knockout cells (44.0 ± 5.9%). Similar results were obtained for GLG1, but they were not quantifiable because of background bands. (D) Immunofluorescence microscopy of control and AP5Z1 knockout HeLa cells treated with monensin for 90 min followed by washout for 2.25 h. In the knockout, there is reduced retrieval of GOLIM4 back to the juxtanuclear region, where GM130 is located. The nuclear puncta labelled by the GM130 antibody are nonspecific. Scale bar: 20 μm. (E) Immunofluorescence microscopy of control and AP5Z1 knockout HeLa cells treated with monensin for 90 min followed by a washout for 2.25 h. Like GOLIM4, GOLM1 is impaired in its ability to be retrieved back towards the Golgi. GLG1 is not retrieved in either condition, and the diminished brightness correlates with its loss in western blots (Fig 6C). Scale bar: 20 μm. (F) Quantification of the retrieval defect was performed using an Arrayscan automated microscope and a Colocalisation Bioapplication using an adapted protocol that was designed for quantifying CIMPR retrieval (Fig 3C). The amount of GOLIM4 (Total Object Area) that was not retrieved towards the Golgi was 1.37 ± 0.04 for AP5Z1_KO1 and 1.64 ± 0.02 for AP5Z1_KO2, relative to control. More than 1,500 cells were scored per knockdown condition (3 independent repeats); error bars indicate SEM. The raw data can be found in S4 Data. AP, adaptor protein; CIMPR, cation-independent mannose 6-phosphate receptor; con, control; KO, knockout; Mon, monensin; WO, washout; wt, wild-type.
Fig 7
Fig 7. Effect of combined loss of retromer and AP-5 on GOLIM4 retrieval.
(A) Immunofluorescence microscopy of cells treated with monensin for 90 min followed by a 2.25-h washout. Individually, the knockdown of retromer or the knockout of AP5Z1 caused a reduction in the retrieval of GOLIM4 back to the Golgi; this was exacerbated when the knockout and knockdown were combined. Scale bar: 20 μm. (B) Quantification of the retrieval defect of GOLIM4 was performed using a CX7 automated microscope and a Colocalisation Bioapplication with an adapted protocol that was originally designed for quantifying CIMPR retrieval (see Fig 3C). The increase in GOLIM4 (Total Object Area) that failed to be retrieved back to the Golgi region was 1.40 ± 0.11 for VPS35 kd, 1.51 ± 0.12 for AP5Z1_KO1 knockout, and 2.20 ± 0.08 for VPS35 kd + AP5Z1 KO. More than 1,500 cells were scored per knockdown condition (3 independent repeats; error bars indicate SEM). The raw data can be found in S4 Data. AP, adaptor protein; CIMPR, cation-independent mannose 6-phosphate receptor; con, control; KO, knockout; Mon, monensin; WO, washout.
Fig 8
Fig 8. Interactions with CIMPR and sortilin.
(A) SPG15/GST pull downs, performed in triplicate. Proteins were analysed by label-free quantification mass spectrometry. The x-axis shows the log2-fold change between GST_SPG15N1–709 and GST-only pulldowns; the y-axis shows the −log10 p-value of significance (2-sided t test, n = 3 [GST_SPG15N1–709], 4 [GST control]). SPG15 (the bait) and CIMPR/IGF2R are the top hits. Data can be found in S3 Data. (B) Western blots of proteins pulled down either by GST alone or by GST followed by the N-terminal 709 residues of SPG15 (GST_15N1–709), using lysate from either HeLa or SH-SY5Y cells. Using IMAGEJ to quantify bands, we estimate that from the input, GST_15N1–709 pulled down 0.15% of the CIMPR and 0.1% of the sortilin from the HeLa cell lysate, and 0.4% of the CIMPR and 0.6% of the sortilin from the SH-SY5Y lysate. As controls, blots of the lysate and pulldowns were probed with antibodies against CHC, AP-5 ζ, and TGN46. (C) Immunoprecipitations using anti-GFP were carried out on either control HeLa cells or HeLa cells stably expressing SPG15-GFP, and the blots were probed using antibodies, as shown. Both AP-5 ζ and CIMPR are specifically brought down with SPG15-GFP. Using IMAGEJ to quantify bands, we estimate that 65.9% AP-5 ζ and 0.1% CIMPR of input was pulled down by SPG15-GFP, based on 3 repeats. Blots were also probed with an antibody against CHC as a control. AP, adaptor protein; CHC, clathrin heavy chain; CIMPR, cation-independent mannose 6-phosphate receptor; TGN, trans-Golgi network.
Fig 9
Fig 9. Effect of sortilin knockdown on Golgi protein retrieval.
(A) Western blots of wild-type and AP5Z1 knockout cells, either with or without sortilin knockdown, treated with or without monensin for 90 min, followed by a washout for 2.25 h. The knockdown of sortilin caused a reduction of both GOLIM4 and GOLM1 in wild-type and knockout cells (70.7 ± 1.5% GOLIM4 wild type; 78.1 ± 1.6% GOLM1 knockout; 60.3 ± 1.2% GOLM1 wild type; 55.5 ± 6.6% GOLM1 knockout; 3 biological repeats, SEM). (B) Indirect immunofluorescence microscopy of control and AP5Z1 knockout cells, either with or without sortilin knockdown, treated with monensin for 90 min, followed by a 2.25-h washout. The sortilin knockdown alone does not appear to affect the retrieval of GOLIM4 back to the juxtanuclear region. However, knocking down sortilin in AP5Z1 knockout cells exacerbates the retrieval defect. Scale bar: 20 μm. (C) Quantification of the retrieval defect in sortilin knockdown cells, performed using an Arrayscan automated microscope and a Colocalisation Bioapplication with a protocol adapted from the one that was designed for quantifying CIMPR retrieval (Fig 3C). The increase in GOLIM4 (Total Object Area) that failed to be retrieved back to the Golgi region was 1.00 ± 0.02 for control, 1.03 ± 0.04 for control + sortilin knockdown, 1.27 ± 0.03 for AP5Z1 knockout, and 1.49 ± 0.04 for AP5Z1 knockout + sortilin knockdown. More than 1,500 cells were scored per knockdown condition (4 independent repeats; error bars indicate SEM). The raw data can be found in S4 Data. mon, monensin; wo, washout; CHC, clathrin heavy chain; CIMPR, cation-independent mannose 6-phosphate receptor; con, control; KO, knockout; SORT1, sortilin.

Similar articles

Cited by

References

    1. Robinson MS (2015) Forty years of clathrin-coated vesicles. Traffic 16: 1210–1238. doi: 10.1111/tra.12335 - DOI - PubMed
    1. Hirst J, Barlow LD, Francisco GC, Sahlender DA, Seaman MNJ, et al. (2011) The fifth adaptor protein complex. PLoS Biol 9: e1001170 doi: 10.1371/journal.pbio.1001170 - DOI - PMC - PubMed
    1. Hirst J, Borner GHH, Edgar J, Hein MY, Mann M, et al. (2013) Interaction between AP-5 and the hereditary spastic paraplegia proteins SPG11 and SPG15. Mol Biol Cell 24: 2558–2569. doi: 10.1091/mbc.E13-03-0170 - DOI - PMC - PubMed
    1. Hein MY, Hubner NC, Poser I, Cox J, Nagaraj N, et al. (2015) A human interactome in three quantitative dimensions organized by stoichiometries and abundances. Cell 163: 712–723. doi: 10.1016/j.cell.2015.09.053 - DOI - PubMed
    1. Itzhak DN, Tyanova S, Cox J, Borner GHH (2016) Global, quantitative and dynamic mapping of protein subcellular localization. eLife 5: e16950 doi: 10.7554/eLife.16950 - DOI - PMC - PubMed

Publication types

MeSH terms