. 2017 Oct 31;21(5):1331-1346.
doi: 10.1016/j.celrep.2017.10.029.

The mTORC1 Signaling Network Senses Changes in Cellular Purine Nucleotide Levels

Affiliations

The mTORC1 Signaling Network Senses Changes in Cellular Purine Nucleotide Levels

Gerta Hoxhaj et al. Cell Rep. .

Abstract

Mechanistic (or mammalian) target of rapamycin complex 1 (mTORC1) integrates signals from growth factors and nutrients to control biosynthetic processes, including protein, lipid, and nucleic acid synthesis. We find that the mTORC1 pathway is responsive to changes in purine nucleotides in a manner analogous to its sensing of amino acids. Depletion of cellular purines, but not pyrimidines, inhibits mTORC1, and restoration of intracellular adenine nucleotides via addition of exogenous purine nucleobases or nucleosides acutely reactivates mTORC1. Adenylate sensing by mTORC1 is dependent on the tuberous sclerosis complex (TSC) protein complex and its regulation of Rheb upstream of mTORC1, but independent of energy stress and AMP-activated protein kinase (AMPK). Even though mTORC1 signaling is not acutely sensitive to changes in intracellular guanylates, long-term depletion of guanylates decreases Rheb protein levels. Our findings suggest that nucleotide sensing, like amino acid sensing, enables mTORC1 to tightly coordinate nutrient availability with the synthesis of macromolecules, such as protein and nucleic acids, produced from those nutrients.

Keywords: AMPK; ATP; GTP; Rag GTPases; Rheb; mTOR; nucleotides; nutrient sensing; purine; tuberous sclerosis complex.


Figures

Figure 1
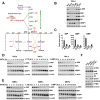
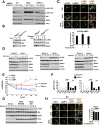
Figure 1. Blocking purine synthesis leads to depletion of purine nucleotides and inhibition of mTORC1 signaling
(A) Schematic of the de novo and salvage pathways of purine synthesis. Inhibitors of specific enzymes within these pathways are shown in red: methotrexate (MTX), lometrexol (LTX), MRT00252040 (MRT), mizoribine (Miz), and 6-mercaptopurine (6-MP). (B) HeLa cells were treated for 16 hrs with MTX (2 µM), LTX (2 µM), 6-MP (100 µM), leflunomide (LEF, 10 µM), and 5-fluorouracil (5-FU, 1 µM). (C) The abundance of purine nucleotides from HeLa cells treated with vehicle (Veh), MTX (2 µM), or LTX (2 µM) for 12 hrs are shown as peak areas measured by targeted LC-MS/MS and presented as mean ± SD of biological triplicates. (D,E) HeLa cells (D) and MEFs (E) were treated for the indicated times with MTX (2 µM), LTX (2 µM) and 6-MP (100 µM). (F) HeLa cells were transfected with control siRNAs (siCtl) or those targeting GART, DHODH, and TYMS for 48 hrs.
Figure 2
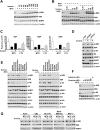
Figure 2. mTORC1 signaling is acutely restimulated by exogenous purines following purine depletion
(A) HeLa cells were treated with MTX (2 µM) for 12 hrs, followed by inosine (5 µM) for the indicated times. (B) HeLa cells were treated with MTX (2 µM) or LTX (2 µM) for 16 hrs, followed by inosine at the indicated concentrations for the final 1 hr. (C) The abundance of purine nucleotides from HeLa cells treated with vehicle, MTX (2 µM), or LTX (2 µM) for 12 hrs, followed by the addition of inosine (5 µM) for the final 1 hr are shown as peak areas measured by targeted LC-MS/MS and presented as mean ± SD of biological triplicates. (D) HeLa cells were transfected with control siRNAs (siCtl) or those targeting GART and PPAT for 48 hrs, followed by addition of inosine (5 µM) for 1 hr. (E) HeLa cells were treated with MTX (2 µM) or LTX (2 µM) for 16 hrs, followed by addition of the indicated nucleosides and nucleobases (5 µM) for the final 1 hr. (F) HeLa cells were treated with MTX (2 µM) for 16 hrs, followed by guanine and adenine addition at the indicated concentrations for the final 1 hr. (G) Cancer cell lines of different origins, A375 (melanoma), ES2 (ovarian), HCT116 (colorectal), MDA-MD-453 (breast) and MCF-7 (breast), were treated with MTX (2 µM) or LTX (2 µM) for 16 hrs, followed by addition of inosine (5 µM) for the final 1 hr.
Figure 3
Figure 3. The conversion of exogenous purines to adenylate, but not guanylate nucleotides is required to restimulate mTORC1 signaling following purine depletion
(A) A9 mouse fibroblasts deficient for APRT and HPRT, or their wild-type counterparts were treated with MTX (2 µM) for 16 hrs, followed by the indicated molecules (5 µM) in the final 1 hr. (B) HeLa cells were treated with 6-MP (100 µM) for 16 hrs, followed by the indicated molecules (5 µM) for the final 1 hr. (C) HeLa cells were transfected with control siRNAs (siCtl) or those targeting GART, ADSS, and IMPDH1/2 for 48 hrs prior to 16 hrs treatment with MTX (2 µM) with addition of inosine (5 µM) or adenine (5 µM) for the final 1 hr. (D) HeLa cells were treated with vehicle, MTX (2 µM) or Miz (25 µM) for 12 hrs. Graphs are the abundance of purine nucleotides from vehicle or Miz-treated cells shown as peak areas measured by targeted LC-MS/MS and presented as mean ± SD of biological triplicates. (E) HeLa cells were treated with vehicle (Veh), MTX (2 µM), LTX (2 µM) or 6-MP (100 µM) for 12 hrs, followed by addition of adenine (5 µM) for indicated times.
Figure 4
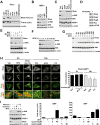
Figure 4. The inhibitory effects of purine depletion on mTORC1 signaling are distinct from energy stress and independent of AMPK
(A) Schematic of the integrated regulation of mTORC1 at the lysosome. (B) ATP levels per cell in HeLa and MEFs treated with MTX (2 µM), LTX (2 µM), or 6-MP (100 µM) for the indicated times are shown as the percent of vehicle-treated cells and presented as mean ± SD of biological triplicates. (C) MEFs were treated with vehicle (Veh), MTX (3 µM), LTX (3 µM), 6-MP (100 µM) or phenformin (Phen, 2mM) for 12h. (D) HeLa cells were treated with vehicle (Veh), MTX (2 µM), LTX (2 µM), or 6-MP (100 µM) for 8h, with inosine (Ino, 5 µM) for the final 1 hr. (E–F) Concentration (µM per 106 cells) (E) and calculated energy charge (F) of AMP, ADP, and ATP measured by enzymatic assays on extracts from cells treated as in (D). Data are shown as mean ± SD of biological triplicates and are representative of at least two independent experiments. (G–H) Concentration (G) and calculated energy charge (H) of AMP, ADP, and ATP were measured and presented as in (E,F) for cells treated with phenformin (Phen, 2mM) for 4h. Data are shown as mean ± SD of biological triplicates and are representative of at least two independent experiments. *p < 0.05 by two-tailed Student’s t test. (I) Wild-type and AMPKα1,α2 double knockout (DKO) MEFs were treated for the indicated times with MTX (2 µM) or LTX (2 µM). (J) ATP levels per cell in wild-type and AMPKα1/α2 DKO MEFs treated with vehicle (Veh), MTX (2 µM), or LTX (2 µM) for 8 hrs are shown relative to Veh and presented as mean ± SD of biological triplicates.
Figure 5
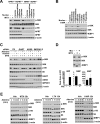
Figure 5. TSC2 is required for the inhibition of mTORC1 upon nucleotide depletion
(A) HeLa cells were transfected with control siRNAs (siCtl) or those targeting TSC2 or DEPDC5 for 48 hrs and treated with MTX (2 µM) for the indicated times. Short (SE) or long (LE) exposures of immunoblots are indicated. (B) RagA+/+ and RagAGTP/GTP MEFs were deprived of amino acids (90 min) followed by readdition (AA, 20 min) (left panel) or treated with LTX (2 µM) for 16 h followed by addition inosine (5 µM) for the final 1 hr (right panel). (C) Representative images of mTOR-Lamp2 colocalization in HeLa cells treated for 16 hrs with vehicle (Veh), MTX (2 µM), or MTX with inosine (5 µM) added for the final 1 hr. Percent colocalization are graphed as a mean ±SD. (D) Tsc2+/+ and Tsc2−/− MEFs were treated with MTX (4 µM), LTX (4 µM), or 6-MP (100 µM) for the indicated times. (E) Relative pS6K to S6K ratios were quantified from three independent experiments described in 5D and S5F. The values were normalized for each cell line and time course to their respective untreated samples (time zero) and are presented as mean ± SEM. *P < 0.05 for comparison of Tsc2−/− to Tsc2+/+ cells following the indicated 12 h treatments. (F) Concentration (µM per 106 cells) of ATP from Tsc2+/+ and Tsc2−/− MEFs treated with vehicle (Veh), MTX (4 µM), LTX (4 µM) and 6-MP (100 µM) for the indicated times. Data are shown as mean ± SD of biological triplicates and are representative of at least two independent experiments. (G) Tsc2−/− MEFs expressing empty vector or reconstituted with wild-type TSC2 or a GAP-dead TSC2 variant (N1643K) were treated with MTX (3 µM) for the indicated times. (H) Representative images of TSC2-Lamp2 colocalization in HeLa cells treated with MTX (2 µM, 8 hrs), followed by addition of inosine (5 µM) for the final 1 hr. Percent colocalization are graphed as a mean ±SD.
Figure 6
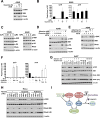
Figure 6. Rheb protein levels are diminished with prolonged depletion of purine nucleotides
(A) HeLa cells were treated with vehicle (Veh), MTX (2 µM), LTX (2 µM), 6-MP (100 µM), MRT00252040 (2 µM) or FTI-277 (10 µM) for 16 hrs, or transfected with control siRNAs (Ctl) or those targeting Rheb1 and Rheb2 for 48 hrs (first two lanes). Rheb immunoblots with two independent antibodies are shown for validation. For the CST antibody, *indicates a prominent non-specific band, with an arrow indicating the Rheb-specific band depleted with Rheb siRNAs. The Abnova antibody was used in all other blots. (B) MEFs were treated with vehicle (Veh), MTX (4 µM), LTX (4 µM), 6-MP (100 µM), or MRT00252040 (4 µM) for 16 hrs. (C) HeLa cells were treated for 16 hrs with MTX (2 µM), LTX (2 µM), 6-MP (100 µM), Torin1 (250 nM), rapamycin (Rap, 20 nM), or phenformin (1 mM). (D) HeLa cells were treated with vehicle or MTX (2 µM) for 16 hrs. (E) HeLa cells were treated for 16 hrs with MTX (2 µM) in the presence or absence of MG132 (1 µM) or Bafilomycin (BAF, 1 µM). (F) HeLa cells were treated with MTX (2 µM) for the indicated times. (G) HeLa cells were treated with MTX (2 µM) for 12 hrs, followed by addition of inosine (5 µM) for the indicated times. (H) Representative images of Rheb-Lamp1 colocalization in HeLa cells treated for 8 hrs with vehicle (Veh), MTX (2 µM), or MTX with addition of inosine (5 µM) for the final 1 hr, or treated for 16 hrs with vehicle (Veh), MTX (2 µM) or FTI-277 (10 µM). Percent colocalization is graphed as a mean ± SD. (I) HeLa cells were treated with MTX (2 µM) for 16 hrs followed by addition of guanine or adenine at the indicated concentrations for the final 1 hr. The abundance of GMP and AMP from the same conditions as the Immunoblots are shown as peak areas measured by targeted LC-MS/MS and presented as mean ± SD of biological triplicates.
Figure 7
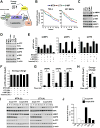
Figure 7. Guanylate availability influences Rheb protein levels
(A) A549 cells were treated with AVN-944 (0.5 µM) for 16h, in the presence of absence of excess guanine (40 µM) for the duration of treatment or for the final hour. (B) The abundance of purine nucleotides from A549 cells treated as in (A) are shown as peak areas measured by targeted LC-MS/MS and presented as mean ± SD of biological triplicates. (C) A549 cells were treated overnight with the indicated concentrations of AVN-944 and MPA. (D) A549 cells were treated with MTX (2 µM) for 16 hrs, followed by guanine and adenine addition at the indicated concentrations for the final 1 hr. (E) A549 cells were treated with MTX (2 µM) for 16h, in the presence of absence of excess guanine (40 µM) or adenine (40 µM) for the duration of treatment or for the final hour. (F) The abundance of purine nucleotides from A549 cells treated as in (E) are shown as peak areas measured by targeted LC-MS/MS and presented as mean ± SD of biological triplicates. (G) A427 cells were treated with AVN-944 (0.5 µM) or MTX (2 µM) for 16h, in the presence of absence of guanine (40 µM) or adenine (40 µM) for the duration of treatment or for the final hour. (H) HeLa cells were treated with AVN-944 (0.5 µM), MPA (1 µM), Miz (25 µM), MTX (2 µM) or 6MP (100 µM) for 14h, in the presence of absence of guanine (40 µM) or adenine (40 µM) for the duration of treatment. (I) Working model suggesting that purine nucleotide levels are monitored by mTORC1 through the TSC-Rheb axis, with acute effects from adenylates through the TSC complex, and more long-term effects on Rheb protein level by guanylates, acting in parallel to the GATOR1-Rag amino acid sensing pathway.

Similar articles

Cited by

References

    1. Bar-Peled L, Chantranupong L, Cherniack AD, Chen WW, Ottina KA, Grabiner BC, Spear ED, Carter SL, Meyerson M, Sabatini DM. A Tumor suppressor complex with GAP activity for the Rag GTPases that signal amino acid sufficiency to mTORC1. Science. 2013;340:1100–1106. - PMC - PubMed
    1. Ben-Sahra I, Howell JJ, Asara JM, Manning BD. Stimulation of de novo pyrimidine synthesis by growth signaling through mTOR and S6K1. Science. 2013;339:1323–1328. - PMC - PubMed
    1. Ben-Sahra I, Hoxhaj G, Ricoult SJ, Asara JM, Manning BD. mTORC1 induces purine synthesis through control of the mitochondrial tetrahydrofolate cycle. Science. 2016;351:728–733. - PMC - PubMed
    1. Ben-Sahra I, Manning BD. mTORC1 signaling and the metabolic control of cell growth. Curr Opin Cell Biol. 2017;45:72–82. - PMC - PubMed
    1. Chabner BA, Roberts TG., Jr Timeline: Chemotherapy and the war on cancer. Nat Rev Cancer. 2005;5:65–72. - PubMed

MeSH terms

Substances

LinkOut - more resources