. 2017 Nov 7;114(45):E9645-E9654.
doi: 10.1073/pnas.1707151114. Epub 2017 Oct 17.

Neuron-specific methylome analysis reveals epigenetic regulation and tau-related dysfunction of BRCA1 in Alzheimer's disease

Affiliations

Neuron-specific methylome analysis reveals epigenetic regulation and tau-related dysfunction of BRCA1 in Alzheimer's disease

Tatsuo Mano et al. Proc Natl Acad Sci U S A. .

Abstract

Alzheimer's disease (AD) is a chronic neurodegenerative disease characterized by pathology of accumulated amyloid β (Aβ) and phosphorylated tau proteins in the brain. Postmortem degradation and cellular complexity within the brain have limited approaches to molecularly define the causal relationship between pathological features and neuronal dysfunction in AD. To overcome these limitations, we analyzed the neuron-specific DNA methylome of postmortem brain samples from AD patients, which allowed differentially hypomethylated region of the BRCA1 promoter to be identified. Expression of BRCA1 was significantly up-regulated in AD brains, consistent with its hypomethylation. BRCA1 protein levels were also elevated in response to DNA damage induced by Aβ. BRCA1 became mislocalized to the cytoplasm and highly insoluble in a tau-dependent manner, resulting in DNA fragmentation in both in vitro cellular and in vivo mouse models. BRCA1 dysfunction under Aβ burden is consistent with concomitant deterioration of genomic integrity and synaptic plasticity. The Brca1 promoter region of AD model mice brain was similarly hypomethylated, indicating an epigenetic mechanism underlying BRCA1 regulation in AD. Our results suggest deterioration of DNA integrity as a central contributing factor in AD pathogenesis. Moreover, these data demonstrate the technical feasibility of using neuron-specific DNA methylome analysis to facilitate discovery of etiological candidates in sporadic neurodegenerative diseases.

Keywords: Alzheimer’s disease; BRCA1; DNA repair; methylome.


Conflict of interest statement

The authors declare no conflict of interest.

Figures
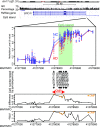
Fig. 1.
Fig. 1.
Details of DMR associated with BRCA1. The uppermost panel shows genomic structures from the University of California, Santa Cruz, genome browser including chromosomal ideogram, GC content (vertical bars), RefSeq gene map (blue lines and bars), and CpG islands (green bars). The second panel depicts β values of each sample at each CpG site. Dots are β values from each sample, and solid lines are mean β values of each group. Light green areas correspond to CpG islands. CG identifiers listed are the sites where methylation levels were validated using an additional pyrosequencing assay. The last two panels show β-value differences (Upper, βNC − βAD) and significance levels on a −log(P) scale at each CpG site. Orange dots represent differentially methylated probes (DMPs) discovered by Infinium screening.
Fig. 2.
Fig. 2.
BRCA1 is mislocalized at the cytoplasm of AD brains, and it occurs at the insoluble fraction. (A) Immunohistochemical images of various regions from advanced-stage AD or NC by anti-BRCA1 antibody. Representative immunohistochemical images are shown from a total of n = 6 (hippocampus, entorhinal cortex, anterior cingulate gyrus, and parietal lobe) or n = 4 (occipital lobe and cerebellum) each. (B) Statistical analysis of A. Error bars represent means ± SEM. Significance was determined using one-way ANOVA followed by post hoc Holm–Sidak method. Mean ± SEM: NC: 3.72 ± 1.37/mm2 in the hippocampus, 1.35 ± 0.52/mm2 in the entorhinal cortex, 0/mm2 in the anterior cingulate gyrus, the parietal lobe, the occipital lobe, and the cerebellum. AD: 67.32 ± 21.27/mm2 in the hippocampus, 39.69 ± 8.05/mm2 in the entorhinal cortex, 15.33 ± 1.70/mm2 in the anterior cingulate gyrus, 8.46 ± 2.31/mm2 in the parietal lobe, 0.68 ± 0.48/mm2 in the occipital lobe, and 0/mm2 in the cerebellum. (C) Immunofluorescence images of advanced stage AD brains colabeled with DAPI, anti-BRCA1, and anti-pTau antibodies. Representative images from n = 4. (D) Immunohistochemical images of inferior temporal gyrus samples from NC or advanced-stage AD brains by anti–γ-H2ax antibody. Representative images are shown from a total of n = 3 samples of AD and NC. (E) Serial solubilization of postmortem brain samples using various detergents. The samples were treated with indicated detergents in a serial manner, each time saving the centrifuged supernatants as soluble fractions for each detergent. Three AD and NC samples were tested. (F) Immuno-EM of purified PHF by anti-BRCA1 antibody. *P < 0.05.
Fig. 3.
Fig. 3.
Aβ confers BRCA1 overexpression. (A) Western blot of N2a and swe.10 cells using anti-mouse BRCA1 and anti-APP antibodies. Actin was detected as a loading control. (B) Quantitative measurement of the relative amount of APP and BRCA1 from experiments in A. n = 4. Relative quantity against actin expression level was normalized to N2a = 1.0. Mean ± SEM: APP: 1.00 ± 0.05 in N2a cells vs. 2.19 ± 0.10 in N2a swe.10 cells; BRCA1: 1.00 ± 0.06 in N2a cells vs. 1.44 ± 0.15 in N2a swe.10 cells. (C) Serial fractionation of N2a and swe.10 cells using various detergents. (D) Concentrations of Aβ40 and Aβ42 in the culture media supernatant of N2a swe.10 cells treated with dimethyl sulfoxide (DMSO) or 25 nM compound E were measured by ELISA. n = 6. Mean ± SEM: Aβ40: 23.00 ± 1.28 pM in DMSO vs. 5.08 ± 1.00 pM in compound E; Aβ42: 4.16 ± 0.29 pM in DMSO vs. 1.45 ± 0.04 pM in compound E. (E) Western blot of N2a swe.10 cells treated with DMSO or compound E by anti-mouse BRCA1 and anti-APP antibodies. (F) Quantitative measurement of the relative amount of BRCA1 and APP from E. n = 6. Relative expression level was normalized to DMSO = 1.0. Mean ± SEM: BRCA1: 1.00 ± 0.08 in DMSO vs. 0.41 ± 0.02 in compound E; APP: 1.00 ± 0.03 in DMSO vs. 0.94 ± 0.02 in compound E. (G) Effect of recombinant Aβ40 and Aβ42 on BRCA1 expression. Western blot of N2a cells by anti-mouse BRCA1 and anti-actin antibodies. Quantitative measurement of the relative amount of BRCA1 is shown below (n = 6 independent wells). Each relative expression level of BRCA1 was normalized to DMSO = 1. One-way ANOVA [Aβ40: F(2,15) = 11.63, P = 0.0009; Aβ42: F(3,20) = 7.981, P = 0.0011] with post hoc Turkey method. Mean ± SEM: Aβ40: 1.00 ± 0.09 in DMSO, 1.10 ± 0.11 in 100 nM, 1.80 ± 0.17 in 1 μM; Aβ42: 1.00 ± 0.10 in DMSO, 0.97 ± 0.12 in 100 pM, 1.50 ± 0.08 in 1 nM, 1.62 ± 0.16 in 10 nM. (H) Immunofluorescence images of N2a and swe.10 cells stained with DAPI, and anti–γ-H2ax antibody. Insets show single nuclei at high magnification. (I) Quantitative analysis of the number of cells with nuclear γ-H2ax foci in H. n = 9 visual fields (3 visual fields from 3 experiments). Mean ± SEM: 0.34 ± 0.20% in N2a cells and 3.02 ± 0.25% in N2a swe.10 cells. (J) Diagram of coculture system. Recipient cells were used for biochemical and immunohistochemical analysis. (K) Western blot of recipient N2a cells by anti-mouse BRCA1 and anti-actin antibodies. Quantitative measurement of the relative amount of BRCA1 is shown below (n = 4 independent wells). Each relative expression level was normalized to N2a-donor culture. Mean ± SEM: 1.00 ± 0.11 in N2a cells and 1.44 ± 0.14 in N2a swe.10 cells. (L) Quantitative analysis of the number of cells with nuclear γ-H2ax foci in the recipient N2a cells. n = 9 visual fields (3 visual fields from 3 experiments). Mean ± SEM: 0.31 ± 0.20% in N2a cells and 2.81 ± 0.35% in N2a swe.10 cells. *P < 0.05 and ****P < 0.0001. ns, not significant.
Fig. 4.
Fig. 4.
Functional relevance of BRCA1 dysfunction in an in vitro and in vivo neuronal model with Aβ burden. (A) Comet assay images of N2a treated with DMSO or 50 μM etoposide for 6 h. (B) Quantification of tail DNA%. Closed circles represent N2a cells treated with DMSO, and open circles, etoposide. n = 39 cells (DMSO) and 31 cells (etoposide). Mean ± SEM: 5.07 ± 0.21% in DMSO and 6.60 ± 0.73% in etoposide. (C) Comet assay images of N2a and N2a swe.10 cells. Representative images are shown. Insets are a high magnification of single nuclei. (D) Quantification of tail DNA%. Closed circles represent N2a cells, and open circles, swe.10. n = 150 cells. Gray bars represent means. Mean ± SEM: 5.72 ± 0.34% in N2a cells and 6.68 ± 0.42% in N2a swe.10 cells. Biological replicates are shown in SI Appendix, Fig. S10A. (E) Representative comet assay images are shown from a total of n = 80 N2a and swe.10 cells after lentiviral transduction of BRCA1 shRNA. (F) Statistical significance of BRCA1 knockdown on DNA fragmentation was determined using the Tukey method. Bars represent means. Mean ± SEM: N2a: 3.45 ± 0.24% in shRNA control, 3.59 ± 0.27% in shRNA #1, 4.40 ± 0.34% in shRNA #2; N2a swe.10: 3.67 ± 0.35% in shRNA control, 5.59 ± 1.37% in shRNA #1, 18.06 ± 3.10% in shRNA #2. Biological replicates are shown in SI Appendix, Fig. S10B. (G) Representative images of the differentiated N2a and swe.10 cells treated with shRNAs are shown (n = 8 visual fields). (H) Quantification of cells with neurite-like process. Statistical significance was calculated by the Tukey method. Mean ± SEM: N2a: 64.86 ± 3.65% in shRNA control, 59.64 ± 4.33% in shRNA #1, 61.62 ± 4.36% in shRNA #2; N2a swe.10: 68.98 ± 6.62% in shRNA control, 45.46 ± 5.81% in shRNA #1, 24.61 ± 4.98% in shRNA #2. (I) Representative images of primary neuronal cultures of cortical tissues from 3×Tg mice. Total length of neurites (J), maximal length of neurites (K), and neurite length distribution (L) were analyzed. Control (n = 12 neurons), shRNA #1 (n = 11 neurons), and shRNA #2 (n = 10 neurons). Statistical significance was determined by the Tukey method. Boxes extend from the 25th to 75th percentiles, and the lines in the boxes represent the median. The whiskers show the minimum and maximum values. (M) Knockdown of BRCA1 in vivo. Lentivirus expressing shRNA against BRCA1 was stereotactically injected into the dentate gyrus (DG) of APP/PS1 mice at 3 mo of age, and mice were killed 3 wk after the surgery. (N) Immunofluorescence images of the neuronal cell in DG stained with DAPI, and anti–γ-H2ax antibody. (O) Spine density of the neuronal cells in DG. n = 8 (control) and 7 (shRNA #1) dendrites. Representative images are shown. (P) Statistical analysis of O. Mean ± SEM: 0.76 ± 0.02/μm in shRNA control and 0.61 ± 0.03/μm in shRNA #1. (Q) Nucleus from inferior temporal gyrus of four NC and four AD brains were subjected to comet assay. Representative images are shown. (R) Statistical analysis of Q. Boxes extend from the 25th to 75th percentiles, and the lines in the boxes represent the median. The whiskers show the minimum and maximum values. n = 70–100 nuclei from each sample. Statistical significance was determined using two-way ANOVA [NC vs. AD: F(1,707) = 100.6, P < 0.0001; sample: F(3,707) = 52.30, P < 0.0001]. Mean ± SEM: NC: 3.54 ± 0.24%, 3.36 ± 0.23%, 3.13 ± 0.21%, and 2.58 ± 0.15%; AD: 7.45 ± 0.34%, 5.46 ± 0.19%, 3.64 ± 0.22%, and 2.80 ± 0.24%. **P < 0.01 and ****P < 0.0001.
Fig. 5.
Fig. 5.
Cytoplasmic tau is important for mislocalization and insolubilization of BRCA1. (A) SH-SY5Y cells transfected with wild type (WT) or P301L mutant 4-repeat tau were treated with in vitro-aggregated tau seeds [either full length (FL) or C-terminal fragment (251)]. After fractionation, supernatant (sup) or pellet (ppt) was subjected to Western blot. (B) Quantification of BRCA1 in the pellet fraction. Mean ± SEM: 1.00 ± 0.09 in WT, 1.08 ± 0.08 in P301L, 0.87 ± 0.11 in WT + FL, 0.95 ± 0.09 in WT + 251, and 1.74 ± 0.15 in P301L + FL. (C) Immunocytochemical images of seed-dependent tau aggregation colabeled with DAPI, pTau, and BRCA1 antibodies. (D) Representative images of Aβ staining of 3×Tg-AD mice hippocampal region. (EG) Representative immunohistochemical images of 3×Tg-AD mice hippocampus by anti-pTau (E), anti-γ-H2ax (F), and BRCA1 (G) staining. Samples are from 3×Tg-AD mice at 3, 6, 9, and 12 mo of age. n = 10–15 visual fields from six to seven mice for 3×Tg-AD mice. Quantitation of positive cells for each protein are shown at the Right side of the images. Statistical significance was determined by the Tukey method. Mean ± SEM: pTau: 33.26 ± 2.57/mm in 3 mo, 37.30 ± 1.99/mm in 6 mo, 44.56 ± 3.19/mm in 9 mo, and 55.12 ± 2.69/mm in 12 mo; γ-H2ax: 1.28 ± 0.22/mm in 3 mo, 3.23 ± 0.90/mm in 6 mo, 4.14 ± 0.66/mm in 9 mo, and 7.97 ± 0.90/mm in 12 mo; BRCA1: 0.56 ± 0.21/mm in 3 mo, 1.07 ± 0.24/mm in 6 mo, 3.41 ± 0.33/mm in 9 mo, and 6.94 ± 0.77/mm in 12 mo. (H and I) Expression of BRCA1 in detergent fractionated the cortical (H) and hippocampal (I) regions of 3×Tg-AD mice at 12 mo of age. n = 2 mice at 12 mo of age. Representative blot was shown. (J) Microscopic images of comet assays. Representative images are shown from a total of n = 136 cells from WT and 3×Tg-AD animals. Insets are magnified nuclei. (K) Quantification of tail DNA% in E. Solid circles are WT, and open circles, 3×Tg-AD mice. Gray bars represent means. Statistical significance was determined using the Holm–Sidak method. Mean ± SEM: WT: 36.71 ± 1.03% in 3 mo, 32.11 ± 0.92% in 6 mo, 36.55 ± 0.92% in 9 mo, and 36.32 ± 0.98% in 12 mo; 3×Tg-AD: 34.10 ± 0.88% in 3 mo, 33.67 ± 0.92% in 6 mo, 41.24 ± 0.90% in 9 mo, and 40.87 ± 1.65% in 12 mo. *P < 0.05.
Fig. 6.
Fig. 6.
Schematic illustration summarizing our current hypothesis regarding Aβ-induced DNA damage, tau, and epigenetic regulation of BRCA1 in AD. In normal brain without Aβ or tau accumulation, there is no need for BRCA1 up-regulation (Left). At an early stage of AD with no accumulated tau, BRCA1 efficiently repairs DNA DSBs induced by toxic Aβ (Middle). However, at an advanced stage of AD, cytoplasmic aggregated tau sequestrates BRCA1 to an insoluble fraction, resulting in its dysfunction (Right). While neurons try to cope with this situation by up-regulating expression of the BRCA1 gene through epigenetic mechanisms, they are eventually overwhelmed by the accumulation of DNA damage.

Similar articles

Cited by

References

    1. Selkoe DJ. Resolving controversies on the path to Alzheimer’s therapeutics. Nat Med. 2011;17:1060–1065. - PubMed
    1. Strittmatter WJ, et al. Apolipoprotein E: High-avidity binding to beta-amyloid and increased frequency of type 4 allele in late-onset familial Alzheimer disease. Proc Natl Acad Sci USA. 1993;90:1977–1981. - PMC - PubMed
    1. Lambert JC, et al. European Alzheimer’s Disease Initiative (EADI) Genetic and Environmental Risk in Alzheimer’s Disease Alzheimer’s Disease Genetic Consortium Cohorts for Heart and Aging Research in Genomic Epidemiology Meta-analysis of 74,046 individuals identifies 11 new susceptibility loci for Alzheimer’s disease. Nat Genet. 2013;45:1452–1458. - PMC - PubMed
    1. Guerreiro R, Hardy J. Genetics of Alzheimer’s disease. Neurotherapeutics. 2014;11:732–737. - PMC - PubMed
    1. Jun G, et al. IGAP Consortium A novel Alzheimer disease locus located near the gene encoding tau protein. Mol Psychiatry. 2016;21:108–117. - PMC - PubMed

Publication types

LinkOut - more resources