. 2017 Nov 1;127(11):4042-4058.
doi: 10.1172/JCI90387. Epub 2017 Oct 3.

CD56bright NK cells exhibit potent antitumor responses following IL-15 priming

Affiliations

CD56bright NK cells exhibit potent antitumor responses following IL-15 priming

Julia A Wagner et al. J Clin Invest. .

Abstract

NK cells, lymphocytes of the innate immune system, are important for defense against infectious pathogens and cancer. Classically, the CD56dim NK cell subset is thought to mediate antitumor responses, whereas the CD56bright subset is involved in immunomodulation. Here, we challenge this paradigm by demonstrating that brief priming with IL-15 markedly enhanced the antitumor response of CD56bright NK cells. Priming improved multiple CD56bright cell functions: degranulation, cytotoxicity, and cytokine production. Primed CD56bright cells from leukemia patients demonstrated enhanced responses to autologous blasts in vitro, and primed CD56bright cells controlled leukemia cells in vivo in a murine xenograft model. Primed CD56bright cells from multiple myeloma (MM) patients displayed superior responses to autologous myeloma targets, and furthermore, CD56bright NK cells from MM patients primed with the IL-15 receptor agonist ALT-803 in vivo displayed enhanced ex vivo functional responses to MM targets. Effector mechanisms contributing to IL-15-based priming included improved cytotoxic protein expression, target cell conjugation, and LFA-1-, CD2-, and NKG2D-dependent activation of NK cells. Finally, IL-15 robustly stimulated the PI3K/Akt/mTOR and MEK/ERK pathways in CD56bright compared with CD56dim NK cells, and blockade of these pathways attenuated antitumor responses. These findings identify CD56bright NK cells as potent antitumor effectors that warrant further investigation as a cancer immunotherapy.


Conflict of interest statement

Conflict of interest: H.C. Wong is employed by and has equity interest in Altor BioScience. K.J. Malmberg serves on the Scientific Advisory Board of Fate Therapeutics. All relationships have been reviewed and managed by Oslo University Hospital and Karolinska Institute in accordance with its conflict of interest polices.

Figures

Figure 1
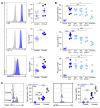
Figure 1. IL-15–primed human CD56bright NK cells have enhanced responses to tumor target cells.
(A) Purified NK cells from normal donors underwent short-term (12–16 hours) culture in media alone (control) or media with 5 ng/ml IL-15 (primed). Cells were then washed and triggered with tumor targets. (B) Control or primed purified NK cells were incubated with K562 AML target cells for 6 hours at a 5:1 E:T ratio. Bivariate flow cytometry plots from a representative normal donor show surface CD107a as well as intracellular IFN-γ and TNF following tumor target triggering. Summary data show mean ± SEM percentage of CD107a+, IFN-γ+, and TNF+ NK cells. n = 14 normal donors, 7 independent experiments. (C) Flow-sorted, control or primed CD56bright and CD56dim NK cells were triggered with K562 tumor targets for 6 hours at a 5:1 E:T ratio. Summary data show mean ± SEM percentage of CD107a+, IFN-γ+, and TNF+ NK cells. n = 9 normal donors, 6 independent experiments. Data were compared using a 1-way repeated-measures ANOVA, with Bonferroni’s multiple-comparisons testing of indicated groups. *P < 0.05, **P < 0.01, ***P < 0.001.
Figure
2
Figure 2. Responses of IL-15–primed CD56dim NK cells are influenced by maturity status.
Control and primed NK cells were assessed for the expression of 33 markers using mass cytometry following stimulation with K562 tumor targets in a functional assay. (A) Density plots from a representative donor of control and primed NK cells in the tSNE1/2 fields demonstrating the proportion of NK cells that are CD56bright (B), immature CD56dim (Imm), or mature CD56dim (Mat). Percentages of NK cells belonging to the different groups are indicated in parentheses. Cell maturity state was determined according to expression of CD56, NKG2A, KIR, and CD57. Immature CD56dim NK cells were primarily NKG2A+KIRCD57, whereas mature CD56dim NK cells were primarily NKG2A+KIR+CD57+ or NKG2AKIR+CD57+. (B) Median expression of the indicated markers (CD56, NKG2A, KIR2DL2/3, CD57) is shown for the same representative donor, demonstrating that maturity marker expression is unchanged by priming. (C) Summary data show mean ± SEM percentage of CD107a+, IFN-γ+, and TNF+ control or primed CD56bright, CD56dim (immature + mature), immature CD56dim, and mature CD56dim NK cells from n = 8 normal donors, 3 independent experiments. (D) Summary data show mean ± SEM fold change of primed relative to control percentage CD107a+, IFN-γ+, and TNF+ CD56bright, CD56dim (immature + mature), immature CD56dim, and mature CD56dim NK cells from n = 8 normal donors, 3 independent experiments. Data were compared using a 1-way repeated-measures ANOVA with (C) Bonferroni’s multiple-comparisons testing of indicated groups or (D) Tukey’s multiple-comparisons testing. *P < 0.05, ***P < 0.001.
Figure
3
Figure 3. IL-15–primed CD56bright NK cells have enhanced cytotoxicity.
(A) Control or primed purified NK cells were assessed for expression of intracellular granzyme B and perforin and cell surface TRAIL using flow cytometry. Representative histograms gated on CD56bright NK cells show per-cell protein expression, with gray histograms depicting unstained cells. Summary data show mean ± SEM granzyme B and perforin median fluorescent intensity (MFI), or TRAIL percentage positive CD56bright NK cells. n = 4–6 normal donors, 2–3 independent experiments. (B and C) Control or primed flow-sorted CD56bright and CD56dim NK cells were assessed for cytotoxicity against K562 leukemia cells in a 4-hour flow-based killing assay. (B) Summary data show mean ± SEM percentage specific killing by control or primed NK cell subsets at the indicated E:T ratios. (C) Summary data show mean ± SEM specific killing at the 2.5:1 E:T ratio. n = 4 normal donors, 2 independent experiments. (D) Representative confocal Z-stack images show CD107a (LAMP1) and granzyme B (Gzm B) in flow-sorted, control or IL-15–primed CD56bright NK cells. Representative images were contrast-enhanced for better visualization. (E) Summary data show mean ± SEM LAMP1 and granzyme B single-cell mean pixel intensity × area, quantified from focal planes in the middle of cells (control n = 20–32, primed n = 25–37) from 5 normal donors. Data were compared using (A and E) a paired Student’s t test or (B and C) a 1-way repeated-measures ANOVA, with Bonferroni’s multiple-comparisons testing of indicated groups. *P < 0.05, **P < 0.01, ***P < 0.001.
Figure 4
Figure 4. IL-15–primed CD56bright NK cells more effectively form conjugates with K562 leukemia targets.
Control or primed purified NK cells were assessed for conjugate formation via coincubation with CFSE-labeled K562 cells for 5, 15, or 30 minutes at a 1:1 E:T ratio. The NK/K562 conjugate percentage was assessed by the frequency of CD56bright NK cell events that were also CFSE positive. (A) Representative bivariate flow plots show conjugate formation by control or primed NK cells at the 15-minute time point by gating on (i) all live NK and K562 cells, (ii) NK cells (CD56+CD3), (iii) CD56bright NK cells, and (iv) CFSE-positive cells. (B) Summary data show mean ± SEM percentage of control or primed CD56bright NK cells that formed NK/K562 conjugates after 5, 15, and 30 minutes of coincubation. n = 4 normal donors, 2 independent experiments. Data were compared using a paired Student’s t test. *P < 0.05, **P < 0.01.
Figure 5
Figure 5. IL-15–primed CD56bright NK cells display increased expression of coactivating and adhesion molecules as well as enhanced integrin signaling upon tumor target engagement.
(A) Representative histograms gated on control or primed CD56bright NK cells show per-cell surface expression of CD2, CD11a, and NKG2D, with gray histograms depicting unstained cells. Summary data show mean ± SEM CD2, CD11a, and NKG2D MFI on control or primed CD56bright NK cells. n = 4–9 normal donors, 2–4 independent experiments. (B) IL-15–primed purified NK cells were preincubated with isotype control or blocking anti-human mAbs against CD11a, CD2, or NKG2D (or all 3 combined) for 30 minutes prior to coincubation with K562 target cells for 6 hours at 5:1 E:T ratio. Control NK cell responses were also assessed without blocking mAbs. Summary data show mean ± SEM percentage of CD107a+, IFN-γ+, and TNF+ CD56bright NK cells. n = 4–6 normal donors, 2–3 independent experiments. (C) Control or primed purified NK cells were assessed for the expression of open-conformation CD11a (mAb 24) or intracellular phosphorylated ERK (pT202/pY204) following 15 or 3 minutes (respectively) of coincubation with K562 tumor targets (K562, gray), or in the absence of targets (Baseline, blue). Representative histogram plots show per-cell open CD11a on CD56bright NK cells. Summary data show mean ± SEM percentage of control or primed CD56bright NK cells expressing open CD11a (positivity cutoff set on baseline control cells). Representative histogram plots show per-cell pERK expression in CD56bright NK cells. Summary data show mean ± SEM percentage pERKhi control or primed CD56bright NK cells (pERKhi cutoff set on baseline control cells). Data were compared using (A) a paired Student’s t test, (B) a 1-way ANOVA with Bonferroni’s multiple-comparisons testing of indicated groups, or (C) a 1-way repeated-measures ANOVA with Tukey’s multiple-comparisons testing. *P < 0.05, **P < 0.01, ***P < 0.001.
Figure 6
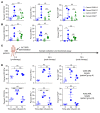
Figure 6. IL-15 priming enhances CD56bright NK cell antitumor responses against primary AML blasts in vitro and K562 leukemia in vivo in NSG mice.
(A) Flow-sorted, control or IL-15–primed CD56bright and CD56dim NK cells were coincubated with primary AML blasts from newly diagnosed patients. Summary data show mean ± SEM percentage specific killing at a 15:1 E:T ratio. n = 7 normal donors, 4 independent experiments. (B) PBMCs and bone marrow blasts were obtained from newly diagnosed AML patients. Control or IL-15–primed PBMCs were incubated with autologous blasts at a 5:1 E:T ratio for 6 hours and functional responses assessed. Summary data show mean ± SEM percentages of CD107a+, IFN-γ+, and TNF+ NK cells. n = 7 normal donors, 3 independent experiments. (C) Experimental design. Day –1: Flow-sorted CD56bright NK cells primed with 17.5 ng/ml ALT-803. Day 0: Primed CD56bright NK cell injection into NSG mice. Eight mice received K562-luc (0.5 × 10⁶ to 0.66 × 10⁶, K562 + ALT-803) and 8 mice received an equal number of both K562-luc and primed CD56bright NK cells (K562 + primed CD56bright NK). ALT-803 (5 μg) was administered i.v. on day 0 and every 2–3 days thereafter for 30 days. Bioluminescence imaging (BLI) was performed on days 2, 5, 13, 20, and 27, ± 1 day. (D) Representative BLI images from one K562 + ALT-803 and one K562 + primed CD56bright NK mouse at different imaging time points. (E) Summary data of whole-body bioluminescence (photons per second) in the different treatment groups. Data show the mean ± SEM photons per second at each time point. n = 8 mice per group, 2 independent experiments. Data were compared using (A and B) a 1-way repeated-measures ANOVA with Bonferroni’s multiple-comparisons testing of indicated groups or (E) a 2-way ANOVA with Sidak’s multiple-comparisons testing. *P < 0.05, **P < 0.01, ***P < 0.001.
Figure 7
Figure 7. MM patient CD56bright NK cells are primed in vitro by IL-15 and in vivo by ALT-803 for enhanced functional responses against autologous myeloma cells and MM cell lines.
(A) Control or IL-15–primed normal-donor purified NK cells were incubated with U266 MM target cells for 6 hours at a 5:1 E:T ratio. Summary data show mean ± SEM percentage CD107a+, IFN-γ+, or TNF+ NK cells. (B) PBMCs and enriched CD138+ cells were obtained from newly diagnosed MM patients. Control or IL-15–primed PBMCs were cultured with autologous CD138+ cells at a 5:1 E:T ratio for 6 hours and functional responses assessed. Summary data show mean ± SEM percentage of CD107a+, IFN-γ+, and TNF+ CD56bright or CD56dim NK cells in response to autologous MM cell triggering. (C) Schematic of ALT-803 treatment regimen. Patients with rel/ref MM received 10 μg/kg ALT-803 s.c. (group A) or 3–6 μg/kg i.v. (group B) at the 0-hour time point. Peripheral blood samples were obtained for functional analysis just before ALT-803 administration as well as 24 and 72 hours thereafter. (D) PBMCs were isolated from MM patient peripheral blood samples by Ficoll density centrifugation and immediately incubated with U266 myeloma targets (group A) or K562 leukemia targets (group B) for 6 hours. Summary data show mean ± SEM percentage of CD107a+, IFN-γ+, and TNF+ CD56bright NK cells. n = 2 patients, 3 independent experiments (group A); n = 3 patients, 3 independent experiments (group B). Data were compared using 1-way repeated-measures ANOVA with (A and B) Bonferroni’s multiple-comparisons testing of indicated groups or (D) Tukey’s multiple-comparisons testing. *P < 0.05, **P < 0.01, ***P < 0.001.
Figure
8
Figure 8. IL-15 more robustly activates the PI3K/Akt/mTOR and Ras/Raf/MEK/ERK pathways in CD56bright NK cells.
(A) Flow cytometry plot shows gating strategy for CD56bright versus CD56dim NK cells based on relative CD56 and CD16 expression. (B) IL-15Rβ expression was assessed via flow cytometry on purified NK cells. Representative data show percentage IL-15Rβ–positive cells and IL-15Rβ MFI on freshly purified CD56bright and CD56dim NK cells. n = 8 normal donors, 3 independent experiments. (C) Summary data show pAkt and pERK MFI in unstimulated CD56bright and CD56dim NK cells. n = 7 normal donors, 3 independent experiments. (DF) Purified NK cells were incubated with 5 ng/ml IL-15 for 30 minutes (pSTAT5) or 2 hours (pAkt and pERK) then assessed for signaling molecule phosphorylation. Representative histograms show per-cell expression of pSTAT5 (D), pAkt (E), and pERK (F) in IL-15–stimulated (shaded gray) versus unstimulated (gray line) CD56bright or CD56dim NK cells. Summary data show mean ± SEM fold increase of phosphorylated molecule MFI in IL-15–stimulated CD56bright or CD56dim NK cells relative to unstimulated cells. n = 7 normal donors, 3 independent experiments. Data were compared using a paired Student’s t test. *P < 0.05, ***P < 0.001.
Figure
9
Figure 9. The Ras/Raf/MEK/ERK pathway is required for IL-15 priming of CD56bright and CD56dim NK cell antitumor responses, whereas the PI3K/Akt/mTOR pathway is selectively required for CD56bright NK cell priming.
(A and B) Purified NK cells were cultured for 12–16 hours in media alone (control, Con) or media plus 5 ng/ml IL-15 (primed). In addition, 1 hour before addition of IL-15, primed NK cells were treated with small-molecule inhibitors of PI3K (Ly294002) or MEK (PD98059) at various concentrations. Summary data show mean ± SEM CD107a, IFN-γ, or TNF percentage positive control, primed, or primed in the presence of PI3K (A) or MEK (B) inhibitors CD56bright and CD56dim NK cells. n = 8 normal donors, 3 independent experiments. (CE) Flow-sorted CD56bright NK cells were cultured with or without (no inhibitor, NI) small-molecule inhibitors of PI3K (Ly294002, Pi) and MEK (PD98059, Mi) for 1 hour prior to 12–16 hours of IL-15 priming. Cells were then washed and incubated with K562 tumor targets for 6 hours at a 5:1 E:T ratio. (C) Summary data show mean ± SEM CD107a, IFN-γ, or TNF percentage positive cells. n = 9 normal donors, 6 independent experiments. (D) CD56bright NK cells were assessed for granzyme B and perforin expression via intracellular flow cytometry. Representative histogram plots show per-cell cytotoxic protein expression. Summary data show mean ± SEM granzyme B or perforin MFI. n = 11 normal donors, 6 independent experiments. (E) CD56bright NK cells were incubated with K562 tumor targets (E:T = 2.5:1) in a 4-hour flow-based killing assay. Summary data show mean ± SEM percentage specific killing. n = 12 normal donors, 8 independent experiments. Data were compared using (A and B) a paired Student’s t test or (CE) a 1-way repeated-measures ANOVA with Tukey’s multiple-comparisons testing. *P < 0.05, **P < 0.01, ***P < 0.001.

Similar articles

Cited by

References

    1. Caligiuri MA. Human natural killer cells. Blood. 2008;112(3):461–469. doi: 10.1182/blood-2007-09-077438. - DOI - PMC - PubMed
    1. Lanier LL. NK cell recognition. Annu Rev Immunol. 2005;23:225–274. doi: 10.1146/annurev.immunol.23.021704.115526. - DOI - PubMed
    1. Long EO, Kim HS, Liu D, Peterson ME, Rajagopalan S. Controlling natural killer cell responses: integration of signals for activation and inhibition. Annu Rev Immunol. 2013;31:227–258. doi: 10.1146/annurev-immunol-020711-075005. - DOI - PMC - PubMed
    1. Min-Oo G, Kamimura Y, Hendricks DW, Nabekura T, Lanier LL. Natural killer cells: walking three paths down memory lane. Trends Immunol. 2013;34(6):251–258. doi: 10.1016/j.it.2013.02.005. - DOI - PMC - PubMed
    1. Vidal SM, Khakoo SI, Biron CA. Natural killer cell responses during viral infections: flexibility and conditioning of innate immunity by experience. Curr Opin Virol. 2011;1(6):497–512. doi: 10.1016/j.coviro.2011.10.017. - DOI - PMC - PubMed

MeSH terms