. 2017 Sep 27;96(1):115-129.e5.
doi: 10.1016/j.neuron.2017.09.003.

Apolipoprotein E4 Impairs Neuronal Insulin Signaling by Trapping Insulin Receptor in the Endosomes

Affiliations

Apolipoprotein E4 Impairs Neuronal Insulin Signaling by Trapping Insulin Receptor in the Endosomes

Na Zhao et al. Neuron. .

Abstract

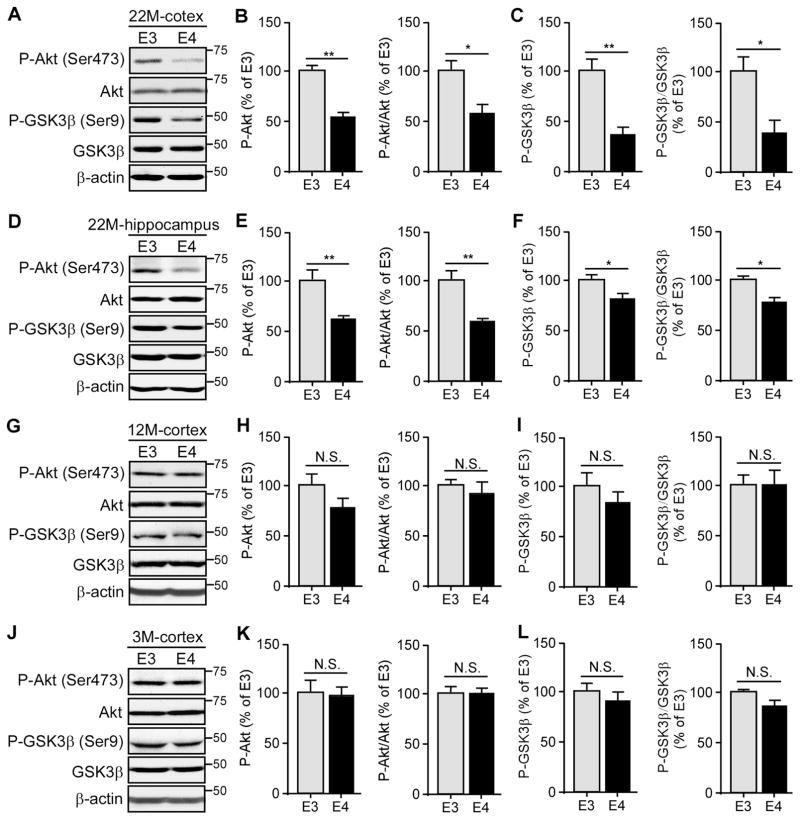
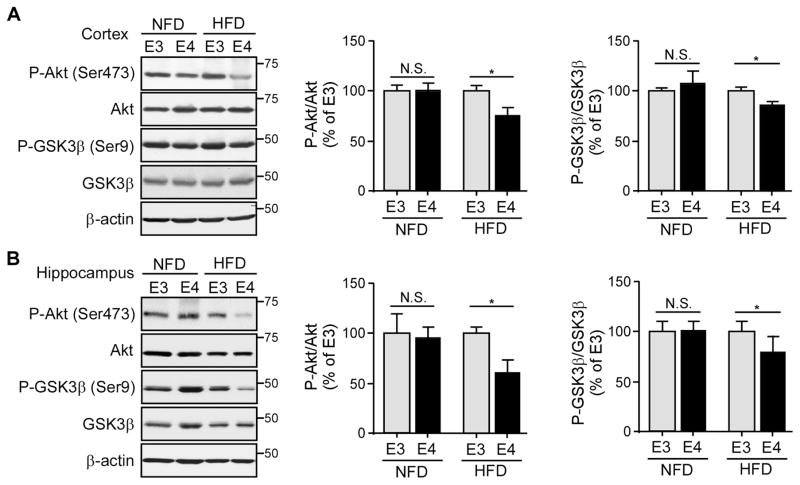
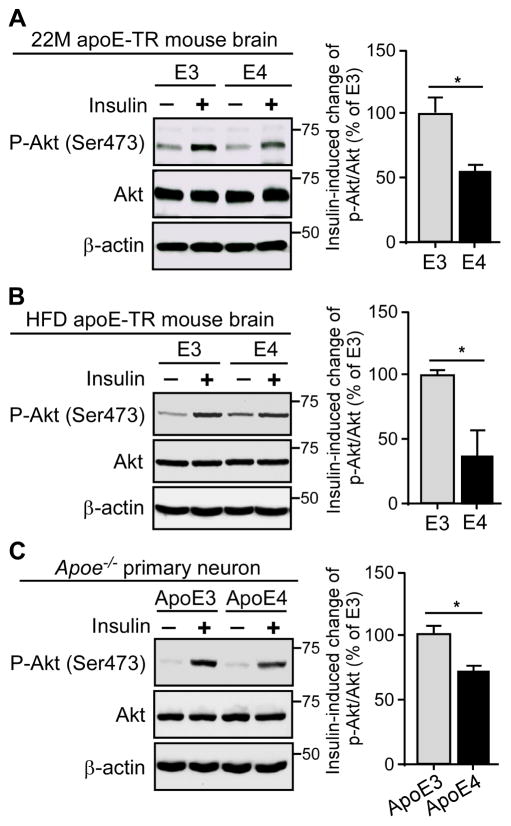
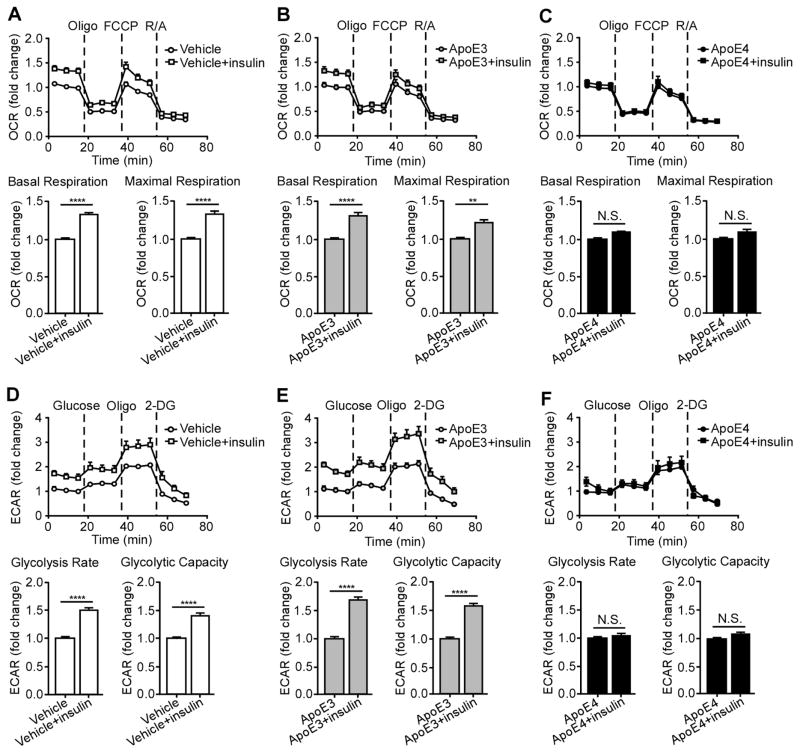
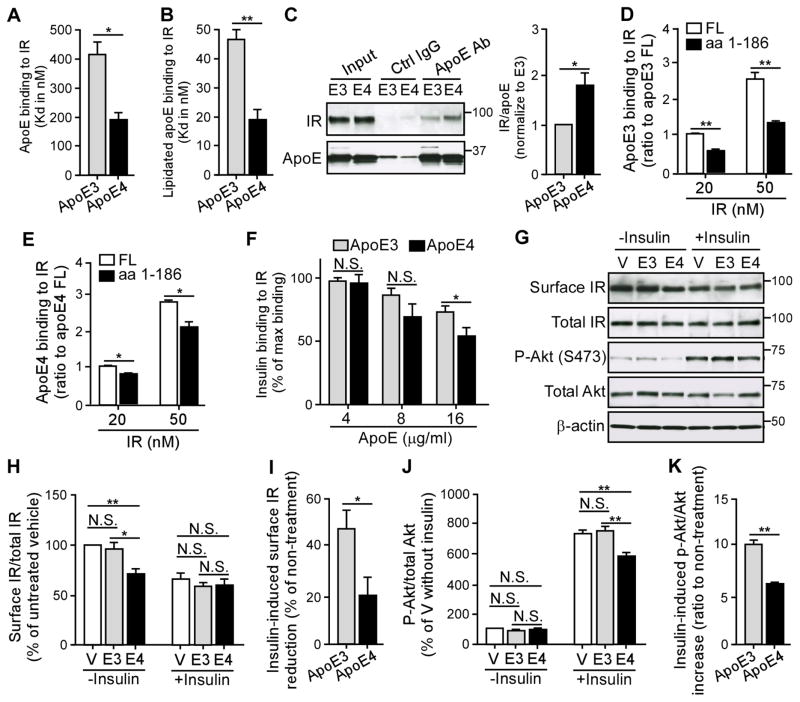
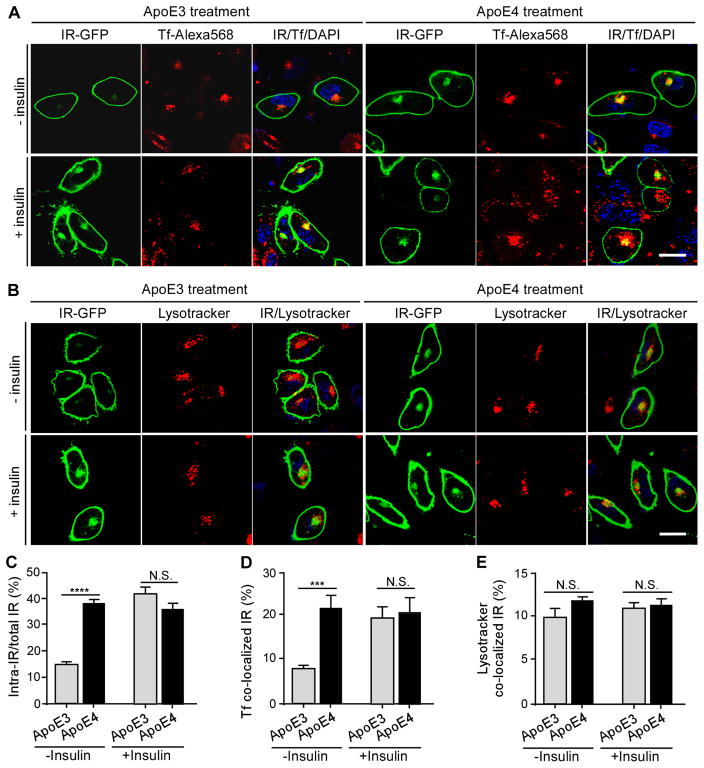
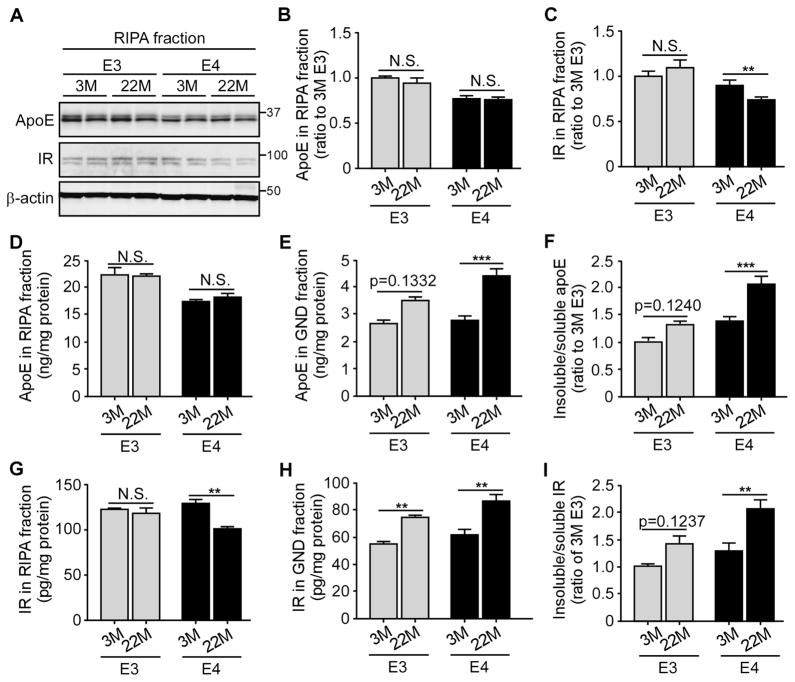
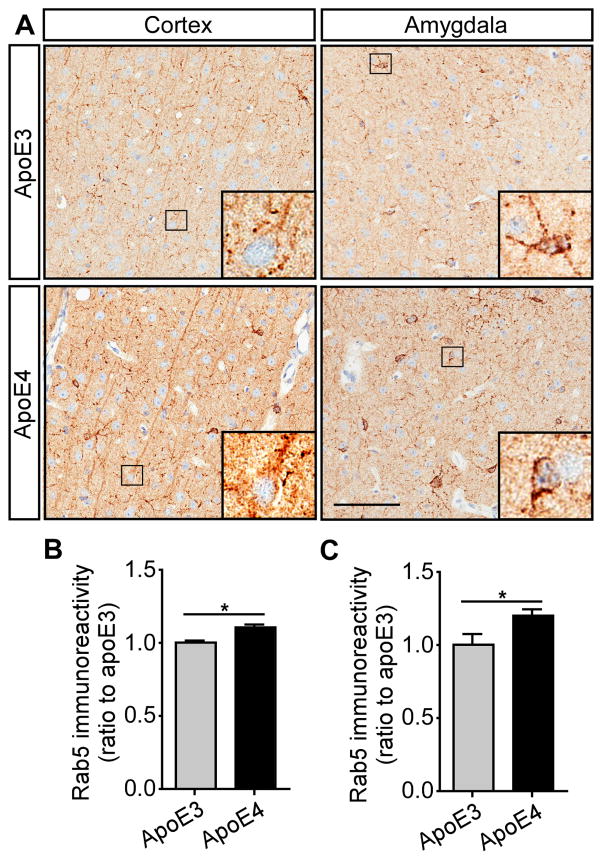
Diabetes and impaired brain insulin signaling are linked to the pathogenesis of Alzheimer's disease (AD). The association between diabetes and AD-associated amyloid pathology is stronger among carriers of the apolipoprotein E (APOE) ε4 gene allele, the strongest genetic risk factor for late-onset AD. Here we report that apoE4 impairs neuronal insulin signaling in human apoE-targeted replacement (TR) mice in an age-dependent manner. High-fat diet (HFD) accelerates these effects in apoE4-TR mice at middle age. In primary neurons, apoE4 interacts with insulin receptor and impairs its trafficking by trapping it in the endosomes, leading to impaired insulin signaling and insulin-stimulated mitochondrial respiration and glycolysis. In aging brains, the increased apoE4 aggregation and compromised endosomal function further exacerbate the inhibitory effects of apoE4 on insulin signaling and related functions. Together, our study provides novel mechanistic insights into the pathogenic mechanisms of apoE4 and insulin resistance in AD.

Keywords: APOE; Aggregation; Aging; Alzheimer’s disease; Endosomal dysfunction; Insulin signaling; Trafficking.


Figures

Figure 1
Figure 1. ApoE4 Impairs Cerebral Basal Insulin Signaling in an Age-dependent Manner. See also Figure S1 and S2
Brain lysates from apoE3-TR and apoE4-TR mice (n=4–6 mice/genotype, mixed gender) at 22 months (A–F), 12 months (G–I) and 3 months (J–L) of age were prepared and the amount of p-Akt (Ser473), total Akt, p-GSK3β (Ser9) and total GSK3β in the cortex (A–C, G–L) and hippocampus (D–F) was examined by Western blotting. Results were normalized to β-actin levels. The ratios of p-Akt/total Akt and p-GSK3β/total GSK3β were quantified and calculated. Data are expressed as mean ± SEM relative to apoE3-TR mice. Two-tailed student’s t test was used for statistical analysis. *p < 0.05; **p < 0.01, N.S., not significant. Molecular mass markers in kilodaltons are shown.
Figure 2
Figure 2. HFD Treatment Accelerates the Age-dependent Impairment of Cerebral Basal Insulin Signaling in ApoE4-TR Mice
ApoE3-TR and apoE4-TR mice (n=8–9 mice/genotype/treatment group, mixed gender) at middle age (8 months) were fed with either NFD or HFD for 4 months. The amount of p-Akt (Ser473), total Akt, p-GSK3β (Ser9) and total GSK3β in the cortex (A) or hippocampus (B) was examined by Western blotting. The ratios of p-Akt/total Akt and p-GSK3β/total GSK3β were calculated. Data were normalized to apoE3-TR mice for comparison. Two-tailed student’s t test was used for statistical analysis within the group. *p < 0.05; N.S., not significant. Molecular mass markers in kilodaltons are shown.
Figure 3
Figure 3. ApoE4 Reduces Insulin-induced Sensitivity to Insulin Signaling. See also Figure S3
(A and B) The amount of hippocampal p-Akt (Ser473), total Akt and β-actin in old (22 months) apoE-TR mice (A) or HFD-treated middle-age (12 months) apoE-TR mice (B) was examined by Western blotting after insulin treatment via reverse microdialysis (n=4 mice/genotype, male). Results were normalized to β-actin levels. Both contralateral (without insulin) and ipsilateral (with insulin) hippocampal homogenates from the same animal were analyzed on the same blot and the change in p-Akt/total Akt ratio in response to insulin treatment was calculated. Data were normalized to apoE3-TR mice for comparison. (C) Apoe−/− primary neurons were treated overnight with 50 nM recombinant apoE3 or apoE4 followed by insulin treatment (100 nM) for 30 minutes. The amount of p-Akt (Ser473), total Akt and β-actin was detected by Western blotting (three independent experiments). The change in p-Akt/total Akt ratio after insulin treatment was calculated. Data were normalized to apoE3 treatment for comparison. Values are expressed as mean ± SEM. Two-tailed student’s t test was used for statistical analysis. *p < 0.05. Molecular mass markers in kilodaltons are shown.
Figure 4
Figure 4. ApoE4 Inhibits Insulin-induced Mitochondrial Respiration and Glycolysis. See also Figure S4
Mitochondrial respiration and glycolysis were measured by Seahorse XFe96 analyzer in Apoe−/− neurons treated overnight with vehicle or 50 nM recombinant apoE3 or apoE4 followed by insulin (100 nM) treatment for 30 minutes. (A–C) Oxygen consumption rate (OCR) was assessed over time after sequential injections of 2 μM oligomycin, 1 μM FCCP, and 5 μM rotenone/antimycin A. The basal respiration and the maximal respiration were calculated to compare the effect of insulin treatment. (D–F) The extracellular acidification rate (ECAR) was assessed over time after sequential injections of glucose (10 mM), oligomycin (2 μM) and 2-DG (50 mM). The glycolysis rate and glycolytic capacity were calculated to compare the effect of insulin treatment. Each value was derived from 10 to 12 repeats in two independent experiments and normalized to the third data point measurement of baseline from non-insulin treatment group for comparisons. Data are expressed as mean ± SEM. Two-tailed student’s t test was used for statistical analysis. ****p < 0.0001; N.S., not significant. Oligo, Oligomycin; FCCP, Carbonyl cyanide-p-trifluoromethoxyphenylhydrazone; RA, rotenone/antimycin A.
Figure 5
Figure 5. ApoE4 Suppresses the Amount of Cell Surface IR. See also Figure S5–S9
(A and B) The interaction between IR and recombinant apoE (A) or astrocyte-secreted lipidated apoE particles (B) were evaluated by solid-phase binding assay (three independent experiments). The Kd values of the binding curves were calculated using the one-site specific binding equation. (C) The interaction between IR and recombinant apoE was evaluated by solution binding assay, followed by immunoprecipitation (IP) of apoE and immunoblotting (IB) of IR. The ratio of IR to apoE was calculated. The values were normalized to apoE3 for comparison. (D–E) The domain interaction between apoE and IR was determined by solid-phase binding assay (three independent experiments) using C-terminal truncated apoE3 or apoE4 containing the aminol acid (aa) 1-186 compared with the full-length (FL) of apoE. The values were normalized to the binding of apoE FL for comparison. (F) A competitive inhibition assay of insulin (8 nM), IR (80 nM) and apoE (4, 8, or 16 μg/ml) was analyzed using solid-phase binding assay (three independent experiments). Results were normalized to the maximal binding of insulin and IR in the absence of apoE. (G–K) Primary Apoe−/− neurons were treated overnight with recombinant apoE3 or apoE4 (100 nM) in the presence or absence of insulin (100 nM) stimulation for 30 minutes, followed by cell surface biotinylation assay and Western blot analysis (three independent experiments). The cell surface IR and total IR were shown and the ratio of cell surface IR/total IR was calculated (G, H). The values were normalized to the vehicle-treated group (V) for comparison. The change in cell surface IR/total IR after insulin treatment was evaluated (I). The amount of p-Akt (Ser473), total Akt and β-actin was detected by Western blotting (G, J, K). Ratio of p-Akt to total Akt (J) and insulin-induced p-Akt/Akt change (K) were calculated. The values were normalized to vehicle without insulin treatment group for comparison. All data represent mean ± SEM. Two-tailed student’s t test (A–C, F, I, K) and one-way ANOVA with Tukey’s multiple comparisons test (D, E, H, J) were used in for statistical analysis. *p < 0.05; **p < 0.01; N.S., not significant. Molecular mass markers in kilodaltons are shown.
Figure 6
Figure 6. ApoE4 Impairs IR Trafficking by Trapping IR in the Endosome. See also Figure S8 and S9
SH-SY5Y neuronal cells transfected with human IR-GFP were treated overnight with recombinant apoE3 or apoE4 (100 nM) in the presence or absence insulin (100 nM) stimulation for 30 minutes. Alexa Flour 568-labeled human transferrin (Tf, 20 μg/ml) or Lysotracker (10 μM) was added to the medium one hour before fixing the cells and images were obtained by confocal microscopy. (A) The co-localization of IR-GFP (Green) and Tf (Red) in apoE3- and apoE4-treated cells in the presence and absence of insulin is shown. DAPI (blue) was included to position the nucleus. (B) The co-localization of IR-GFP (Green) and Lysotracker (Red) in apoE3- and apoE4-treated cells in the presence and absence of insulin is shown. DAPI (blue) was included to position the nucleus. (C) Percentage of intracellular IR (intra-IR/total IR) was calculated. (D) Percentage of IR that was co-localized with Tf (Tf co-localized IR) was calculated. (E) Percentage of IR that was co-localized with Lysotracker (Lysotracker co-localized IR) was calculated. Data from three independent experiments are expressed as mean ± SEM. Two-tailed student’s t test was used for statistical analysis. ***p < 0.001; ****p < 0.0001; N.S., not significant. Scale bar, 20 μm.
Figure 7
Figure 7. ApoE4 Aggregation in Aging Brain Accelerates the Insolubility of IR
RIPA and guanidine (GND)-extracted brain cortical lysates of apoE3-TR and apoE4-TR mice (n=4–6 mice/genotype, mixed gender) at 3 and 22 months of age were prepared and the amount of apoE and IR was examined by Western blotting (A–C) and ELISA (D–I). Results were normalized to β-actin levels in Western blot analysis. The ratios of insoluble (GND fraction) to soluble (RIPA fraction) apoE (F) and IR (I) were calculated. Data are expressed as mean ± SEM. Two-way ANOVA with Tukey’s multiple comparisons test was used for statistical analysis. **p < 0.01; ***p < 0.001, N.S., not significant. Molecular mass markers in kilodaltons are shown.
Figure 8
Figure 8. Aged ApoE4-TR Mice Exhibit Elevated Early Endosomal Marker. See also Figure S10
Brain slices from apoE3-TR and apoE4-TR mice at 22 months of age were prepared, and the early endosomes were examined by immunohistochemical staining for Rab5. The Rab5 expression pattern in the cortex and amygdala is shown (A). Scale bar, 100 μm. (B and C) The immunoreactivity of Rab5 staining in the cortex and amygdala from apoE3-TR and apoE4-TR mice was quantified using Aperio ImageScope (n=6 mice/genotype, mixed gender). Data are expressed as mean ± SEM relative to apoE3-TR mice. Two-tailed student’s t test was used for statistical analysis. *p<0.05.

Similar articles

Cited by

References

    1. Aleshkov S, Abraham CR, Zannis VI. Interaction of nascent ApoE2, ApoE3, and ApoE4 isoforms expressed in mammalian cells with amyloid peptide beta (1–40). Relevance to Alzheimer’s disease. Biochemistry. 1997;36:10571–10580. - PubMed
    1. Anthopoulos PG, Hamodrakas SJ, Bagos PG. Apolipoprotein E polymorphisms and type 2 diabetes: a meta-analysis of 30 studies including 5423 cases and 8197 controls. Mol Genet Metab. 2010;100:283–291. - PubMed
    1. Baldwin D, Jr, Prince M, Marshall S, Davies P, Olefsky JM. Regulation of insulin receptors: evidence for involvement of an endocytotic internalization pathway. Proc Natl Acad Sci U S A. 1980;77:5975–5978. - PMC - PubMed
    1. Beitner R, Kalant N. Stimulation of glycolysis by insulin. J Biol Chem. 1971;246:500–503. - PubMed
    1. Biessels GJ, Staekenborg S, Brunner E, Brayne C, Scheltens P. Risk of dementia in diabetes mellitus: a systematic review. Lancet Neurol. 2006;5:64–74. - PubMed

MeSH terms