. 2017 Aug 8:11:235.
doi: 10.3389/fncel.2017.00235. eCollection 2017.

Microglia Morphological Categorization in a Rat Model of Neuroinflammation by Hierarchical Cluster and Principal Components Analysis

Affiliations

Microglia Morphological Categorization in a Rat Model of Neuroinflammation by Hierarchical Cluster and Principal Components Analysis

María Del Mar Fernández-Arjona et al. Front Cell Neurosci. .

Abstract

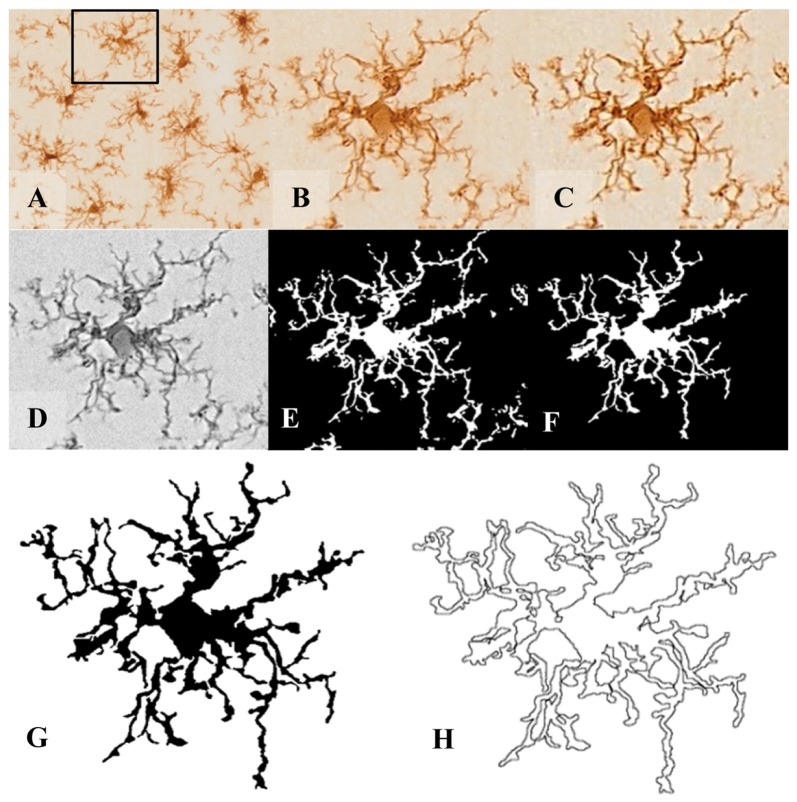
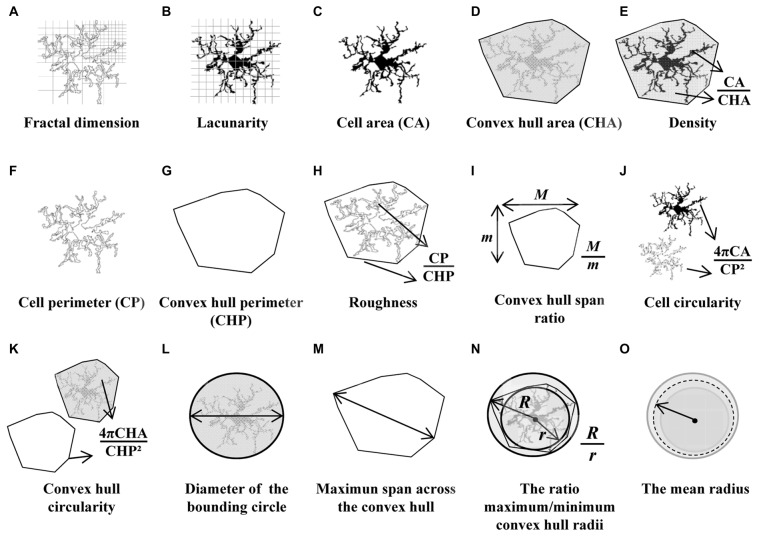
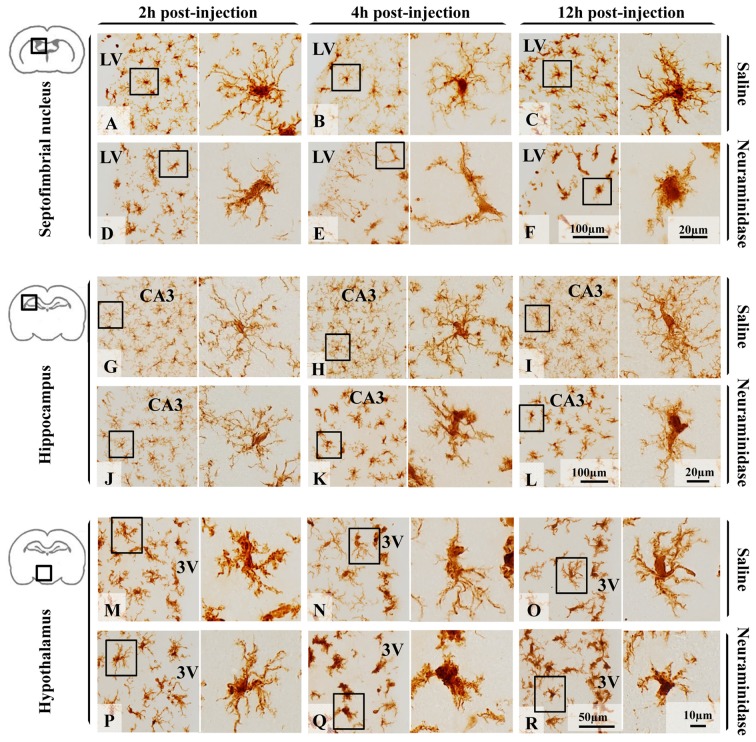
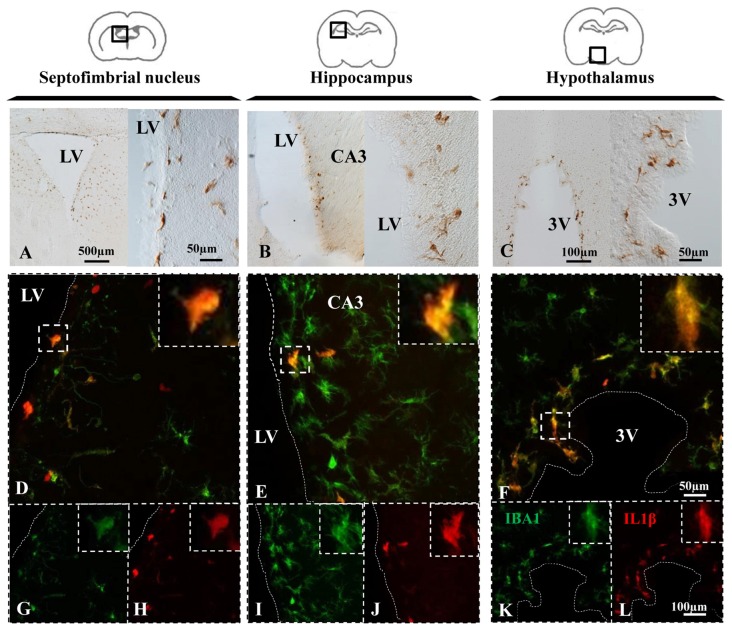
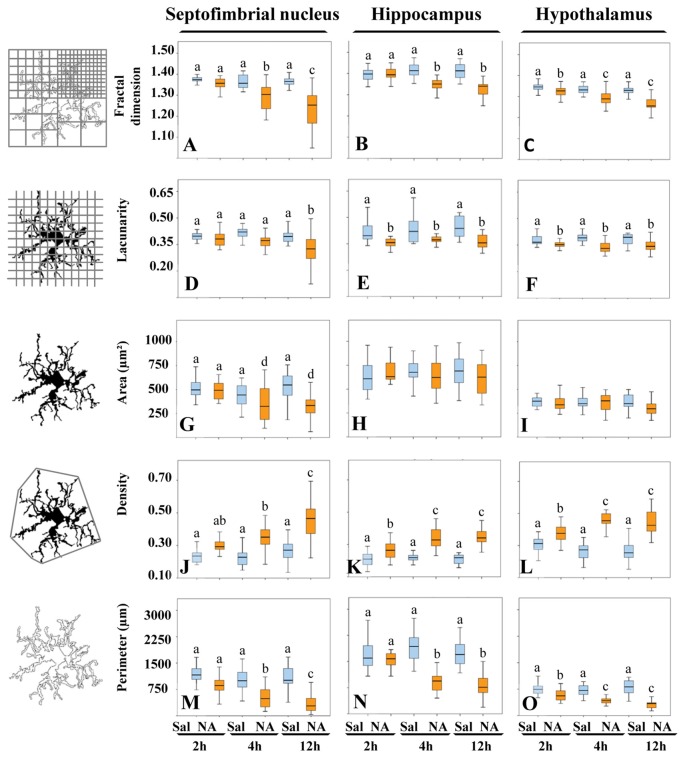
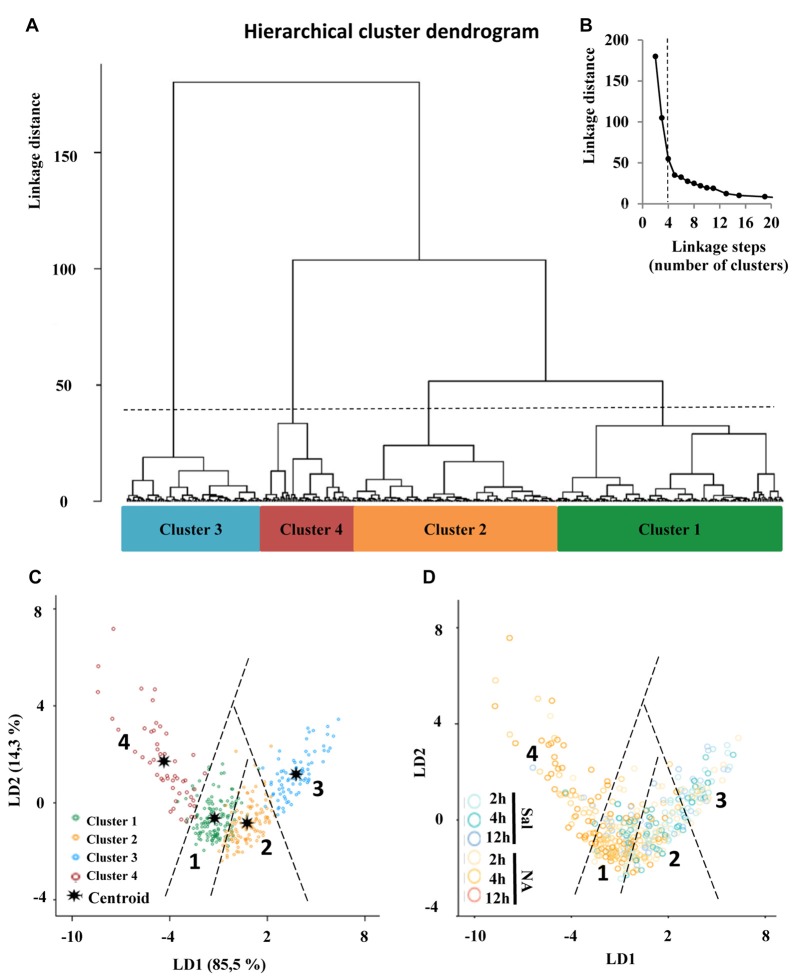
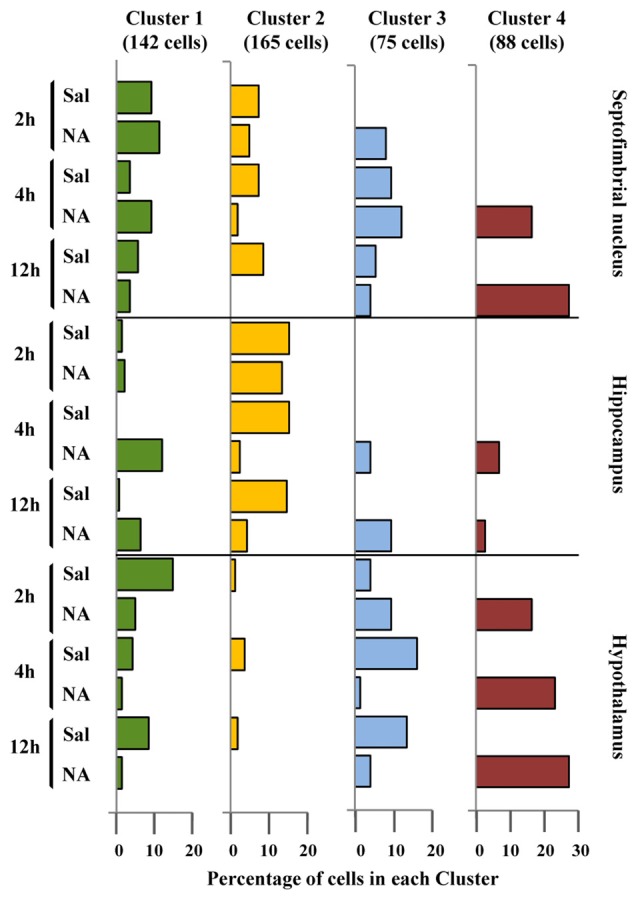
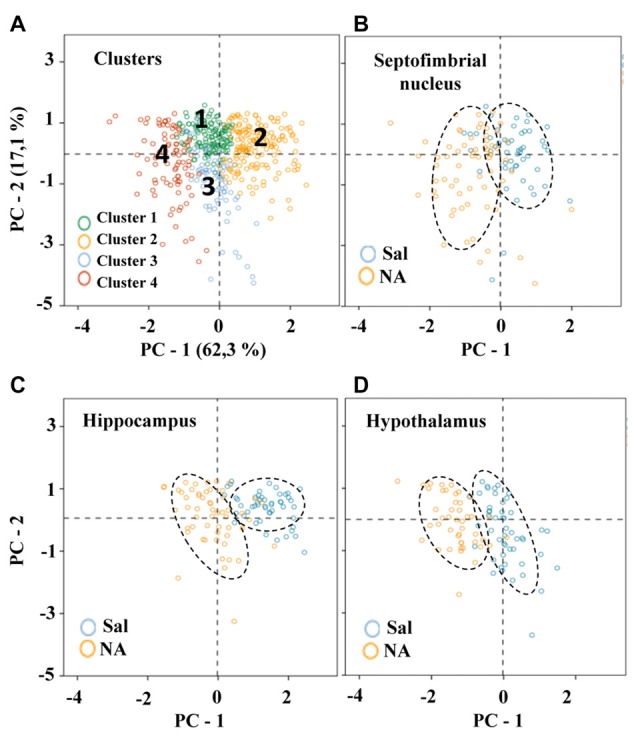
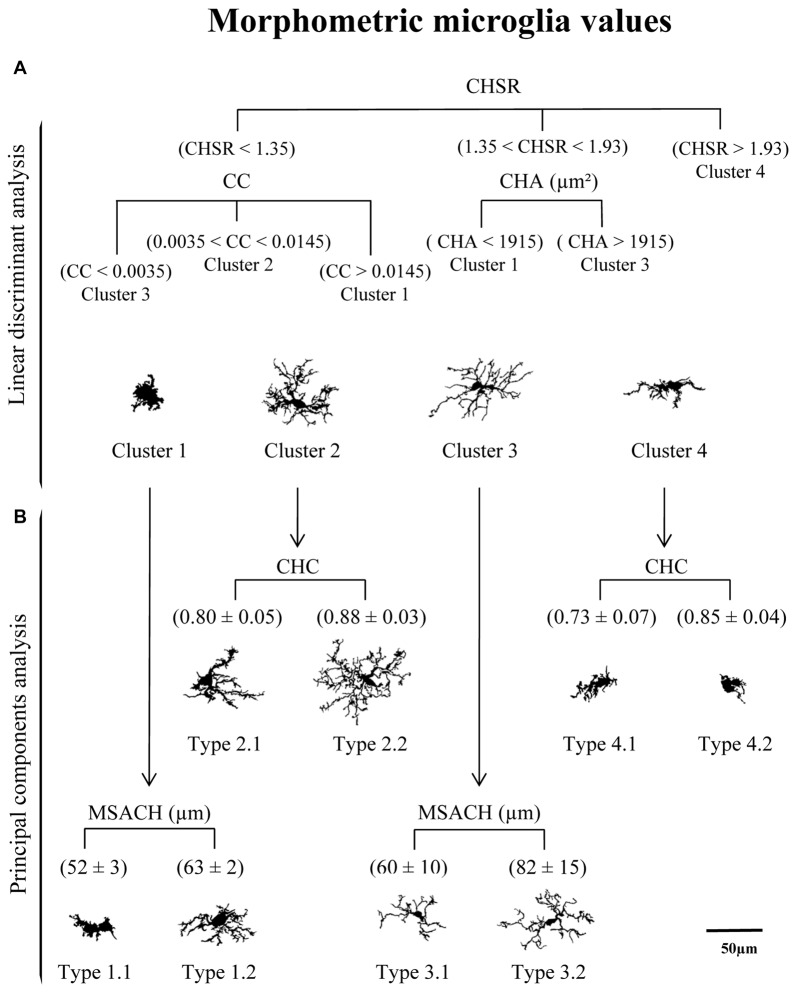
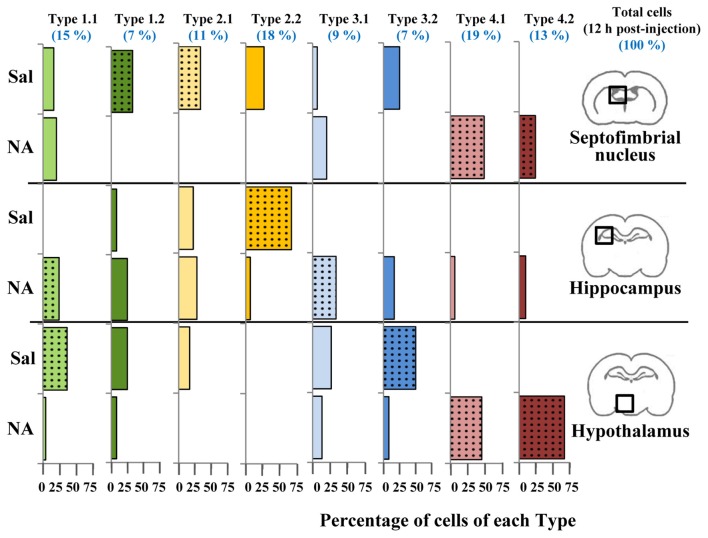
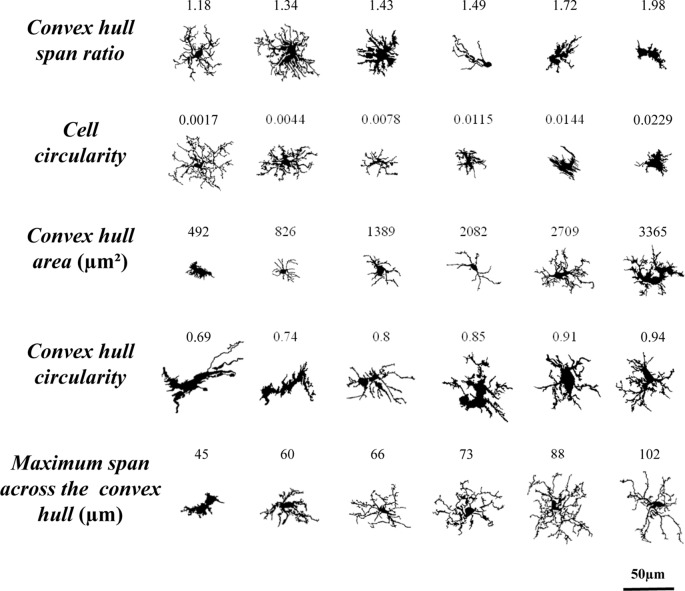
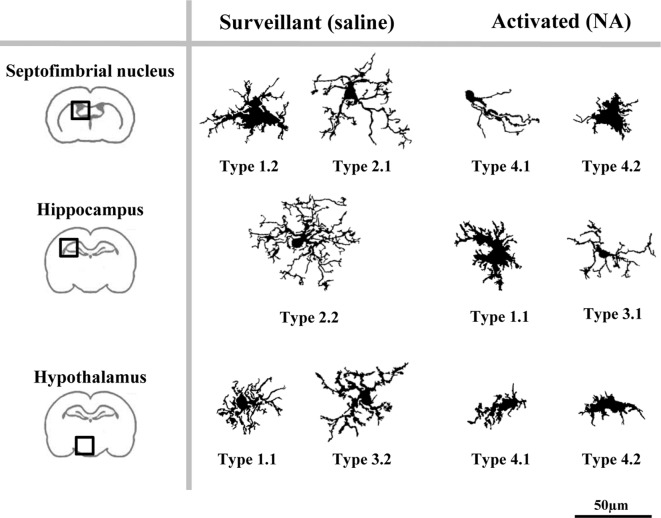
It is known that microglia morphology and function are closely related, but only few studies have objectively described different morphological subtypes. To address this issue, morphological parameters of microglial cells were analyzed in a rat model of aseptic neuroinflammation. After the injection of a single dose of the enzyme neuraminidase (NA) within the lateral ventricle (LV) an acute inflammatory process occurs. Sections from NA-injected animals and sham controls were immunolabeled with the microglial marker IBA1, which highlights ramifications and features of the cell shape. Using images obtained by section scanning, individual microglial cells were sampled from various regions (septofimbrial nucleus, hippocampus and hypothalamus) at different times post-injection (2, 4 and 12 h). Each cell yielded a set of 15 morphological parameters by means of image analysis software. Five initial parameters (including fractal measures) were statistically different in cells from NA-injected rats (most of them IL-1β positive, i.e., M1-state) compared to those from control animals (none of them IL-1β positive, i.e., surveillant state). However, additional multimodal parameters were revealed more suitable for hierarchical cluster analysis (HCA). This method pointed out the classification of microglia population in four clusters. Furthermore, a linear discriminant analysis (LDA) suggested three specific parameters to objectively classify any microglia by a decision tree. In addition, a principal components analysis (PCA) revealed two extra valuable variables that allowed to further classifying microglia in a total of eight sub-clusters or types. The spatio-temporal distribution of these different morphotypes in our rat inflammation model allowed to relate specific morphotypes with microglial activation status and brain location. An objective method for microglia classification based on morphological parameters is proposed. Main points Microglia undergo a quantifiable morphological change upon neuraminidase induced inflammation.Hierarchical cluster and principal components analysis allow morphological classification of microglia.Brain location of microglia is a relevant factor.

Keywords: fractal; microglia; morphofunctional; morphometric; neuraminidase.


Figures

Figure 1
Figure 1
Pre-processing of cell digital image. After random selection of cells from the tissue picture (A,B), the noise was removed by filtering the overall background to get a shape extraction (C). Next, the image was changed to grayscale (D), and then transformed into a binary image (E) using the same threshold for all pictures. (F) The binary image was edited to clear the background and to join all branches, so that the cell image would be formed by a continuous set of pixels. Finally, a filled shape (G) and its pairwise outline shape (H) were used for morphological parameters measures.
Figure 2
Figure 2
Schematic drawings of the parameters used to analyze the morphology of the microglial cells. Fractal dimension (A) and lacunarity (B) were measured by the box counting method. Cell area (C) and cell perimeter (F) were assessed by counting cell shape pixels, and both were used to calculate the cell circularity (CC) (J). Shape measures such as convex hull area (CHA) (D) and convex hull perimeter (G) were necessary to quantify convex hull circularity (CHC) (K), convex hull span ratio (CHSR) (I) and maximum span across the convex hull (MSACH) (M). The bounding circle was required to obtain the diameter of the bounding circle (L). Finally, some parameters were appraised by combining previous estimations such as density (E), roughness (H), the ratio maximum/minimum convex hull radii (N) and the mean radius (O).
Figure 3
Figure 3
Polymorphism of microglial cells from different brain areas in basal conditions and after an inflammatory stimulus. Microglia morphology, evidenced by the size and form of the soma, and the presence and the length of secondary/tertiary branches, remained unchanged 12 h after saline administration within the LV in the three areas studied: the septofimbrial nucleus (A–C), the hippocampus (G–I) and the hypothalamus (M–O). Neuraminidase injection resulted in morphological changes of microglial cells in the septofimbrial nucleus (D–F),the hippocampus (J–L) and the hypothalamus (P–R). Only 2 h after neuraminidase (NA) injection, cells in the septofimbrial nucleus showed a larger soma (D), and thicker primary branches after 12 h (F) compared to the pairwise sham samples (A–C). In basal conditions microglia located in the hippocampus (G–I) exhibited a higher degree of ramification compared to cells in other areas (A–C,M–O). These profuse ramifications appeared slightly decreased 2 h after NA injection (J), and clearly reduced 4 h (K) and 12 h (L) later. Microglia in the hypothalamus presented a different shape to that located in the hippocampus or septofimbria, with low homogeneity, a large soma and thick branches that could be observed in samples from saline treated rats (M–O). A significant drop in branch length was observed 4 h (Q) and 12 h (R) after NA injection. LV, lateral ventricle; CA3, field CA3 of the hippocampus; 3V, third ventricle.
Figure 4
Figure 4
NA induces IL-1β expression in microglial cells. (A–C) Brain sections of rats sacrificed 12 h after NA injection were immunostained for IL-1β. Positive cells appeared near the ventricle in all the areas studied, indicating an inflammatory reaction. (D–L) Parallel sections from the septofimbrial nucleus (D,G,H), hippocampus (E,I,J) and hypothalamus (F,K,L) were double-labeled by immunofluorescence with IBA1 (green) and IL-1β (red) antibodies. Some cells show label with both makers, while many others do not express IL-1β. Samples from saline injected animals did not display IL-1β staining (data not shown). Dashed lines indicate the ventricular surface. LV, lateral ventricle; CA3, field CA3 of the hippocampus; 3V, third ventricle.
Figure 5
Figure 5
The morphological parameters fractal dimension, lacunarity, cell area, density and cell perimeter reveal microglial activation after NA treatment. A morphological analysis of microglia from different brain areas was carried out in samples from NA treated and sham rats. Twelve hours after NA injection, all parameters changed significantly compared to saline injected animals, in the three selected areas: the septofimbrial nucleus, the hippocampus and the hypothalamus. However, the parameter area did not change in microglia from hippocampus (H) and the hypothalamus (I), even though the rest of parameters revealed microglial activation in those regions. Activation of microglia was evidenced by lower fractal dimension (A–C) and lacunarity (D–F), indicating decreased branch complexity and heterogeneity respectively, a higher density (J–L), what implies a more compact shape, and a lower cell perimeter (M–O). Pair comparisons results are shown with letters on top of each bar of the histograms. Within each graph, the same letter means no significant difference between the groups, while different letters indicate a statistically significant difference. If no letter appears on top of a bar, no differences exist between any group (H,I). In (A–F) and (J–O) a, b, c = P < 0.001. In (G) a, d = P < 0.05.
Figure 6
Figure 6
Classification of microglia according to morphological parameters. (A) Hierarchical cluster analysis (HCA) of microglial cells sampled from septofimbrial nucleus, hippocampus and hypothalamus of rats after the injection of NA or saline, based on four suitable parameters selected according to their multimodality index (MMI) value. Dendrogram for 480 cells, where the abscissa represents individual microglia and the ordinate corresponds to the linkage distance measured by Euclidean distance. The dashed line denotes the cut off for four clusters, numbered one through four, which were color coded green, orange, blue and dark red, respectively. (B) A plot of linkage distance vs. linkage steps (or number of clusters) was performed following Thorndike’s procedure. The vertical dashed line points out a marked decline in the slope, which indicates that four is an appropriate number of clusters. (C,D) Territorial mapping of microglial cells on the plane explained by the first two linear discriminant functions (LD1 and LD2); the proportion of trace for each LD is shown in parenthesis. In the graph on the left (C) cells are color coded according to cluster allocation; the centroids represent the mean value of each cluster. In the graph on the right (D) the same cells are color coded based on saline/NA treatment.
Figure 7
Figure 7
Distribution of microglial cell Clusters in different brain areas. The percentage of microglial cells belonging to the different clusters was plotted considering their brain location, saline/NA treatment and post-injection time. Cluster 1 cells (green bars) slightly decreased after NA injection in the hypothalamus; however in the hippocampus they appeared after NA injection. Cluster 2 cells (yellow bars) were mainly present in saline samples of all brain areas, so they probably represent a surveillant morphotype. Cluster 3 cells (blue bars) were scarce compared to other clusters, and distributed in saline and NA samples. As occurred with Cluster 1, a correlation of Cluster 3 cells with a particular functional state is not easy to establish. Finally, Cluster 4 cells (dark red bars) were exclusively present in NA injected animals; therefore corresponded to activated microglia.
Figure 8
Figure 8
Distribution of microglial cells on the principal components (PC) plane. (A) Distribution of microglial cells on the PC plane with projections of the main variables (PC1 and PC2) from coordinates origin, and the percentage of total variance explained by each component. Each cell was color coded according to its Cluster allocation. Cells belonging to the same cluster appear grouped on the component plane. (B–D) The same distribution was plotted for each of the studied areas, and using a color code to indicate saline (blue) or NA (yellow) treatment. Dashed elliptical lines were drawn to highlight the region of the plane occupied by each type of cells.
Figure 9
Figure 9
Categorization of microglial cells by means of a logical decision tree based on morphological parameters. (A) With the aim of assigning cells into one of the four proposed clusters a logical decision tree was designed based on the strongest predictor parameters revealed by the linear discriminant analysis (LDA). For each individual microglial cell, the first parameter to be analyzed would be the CHSR. Cells with a value greater than 1.93 could be assigned to Cluster 4, while those with lower values would be then evaluated by its CC or its CHA. These two parameters would allow to allocate cells to Clusters 1, 2 and 3, according to the parameter values indicated in (A). (B) Principal components analysis (PCA) suggested a further microglia classification with a descriptive categorization. In this case cells within the different clusters were classified based on values respect to the plot axis in the PC plane. The main parameter of PC-1, MSACH, allowed to split Clusters 1 and 3, resulting in Types 1.1 and 1.3, and Types 3.1 and 3.2, respectively. In both cases, the resulting Types were significantly different according to their MSACH values (P < 0.001). The main parameter of PC-2, CHC, was used to split Clusters 2 and 4 in Types 2.1 and 2.2 and Types 4.1 and 4.2, respectively. Differences in CHC between these Types were significant (P < 0.001). Cells are all in the same scale (scale bar = 50 μm).
Figure 10
Figure 10
Distribution of microglial cell Types in different brain areas. Microglial cells from 12 h post-injection animals were classified using the previously proposed decision tree. For each cell Type, the distribution (percentage) of cells in different brain areas (septofimbrial nucleus, hippocampus and hypothalamus) and treatments (saline/NA) was plotted as histogram. Color of bars indicate Cluster origin (same color code as Figure 7), using light color for Type x.1 and dark for Type x.2. At the top in blue, the distribution (percentage) in Types of the total cells analyzed (about 150 cells) is indicated. Dotted bars indicate the most representative microglial Type for each brain region and treatment.
Figure 11
Figure 11
Different microglia filled shapes and their corresponding parameters values. Values of the strongest predictor parameters of LDA and PCA, corresponding to a survey of microglial cells from different brain areas and saline/NA treatments. Parameters values are at the top of each cell. Cells are shown in the same scale (scale bar = 50 μm).
Figure 12
Figure 12
A proposed model of the distribution of microglial morphotypes in the rat brain subjected to induced aseptic inflammation. Surveillant microglia are represented by morphotypes of Cluster 1 (Types 1.1 and 1.2) and Cluster 2 (Types 2.1 and 2.2). An additional surveillant morphotype (Type 3.2) can be found in the hypothalamus. Type 2.2 is almost exclusive of the hippocampus, and is the main surveillant form found in this brain region. Upon activation by NA injection, the most representative morphotypes are Types 4.1 and 4.2 derived from Cluster 4, and Type 3.1. However, morphotypes derived from Cluster 1 can also be found in brains treated with NA (e.g., Type 1.1 in hippocampus). Therefore, some Types are clearly associated to surveillant (2.1, 2.2, 3.2) or activated (3.1, 4.1, 4.2) forms of microglia, while others (Type 1.1) can correspond to either state. For this reason, to define the activation status of a particular microglial cell its brain location must be taken into account. Cells are shown in the same scale (scale bar = 50 μm).

Similar articles

Cited by

References

    1. Amadio S., De Ninno A., Montilli C., Businaro L., Gerardino A., Volonté C. (2013). Plasticity of primary microglia on micropatterned geometries and spontaneous long-distance migration in microfluidic channels. BMC Neurosci. 14:121. 10.1186/1471-2202-14-121 - DOI - PMC - PubMed
    1. Ayoub A. E., Salm A. K. (2003). Increased morphological diversity of microglia in the activated hypothalamic supraoptic nucleus. J. Neurosci. 23, 7759–7766. - PMC - PubMed
    1. Baron R., Babcock A. A., Nemirovsky A., Finsen B., Monsonego A. (2014). Accelerated microglial pathology is associated with Aβ plaques in mouse models of Alzheimer’s disease. Aging Cell 13, 584–595. 10.1111/acel.12210 - DOI - PMC - PubMed
    1. Béchade C., Cantaut-Belarif Y., Bessis A. (2013). Microglial control of neuronal activity. Front. Cell. Neurosci. 7:32. 10.3389/fncel.2013.00032 - DOI - PMC - PubMed
    1. Bernhardi R., Nicholls J. (1999). Transformation of leech microglial cell morphology and properties following co-culture with injured central nervous system tissue. J. Exp. Biol. 202, 723–728. - PubMed