. 2017 Sep 5;114(36):9707-9712.
doi: 10.1073/pnas.1707039114. Epub 2017 Aug 21.

Hsp90 activator Aha1 drives production of pathological tau aggregates

Affiliations

Hsp90 activator Aha1 drives production of pathological tau aggregates

Lindsey B Shelton et al. Proc Natl Acad Sci U S A. .

Abstract

The microtubule-associated protein tau (MAPT, tau) forms neurotoxic aggregates that promote cognitive deficits in tauopathies, the most common of which is Alzheimer's disease (AD). The 90-kDa heat shock protein (Hsp90) chaperone system affects the accumulation of these toxic tau species, which can be modulated with Hsp90 inhibitors. However, many Hsp90 inhibitors are not blood-brain barrier-permeable, and several present associated toxicities. Here, we find that the cochaperone, activator of Hsp90 ATPase homolog 1 (Aha1), dramatically increased the production of aggregated tau. Treatment with an Aha1 inhibitor, KU-177, dramatically reduced the accumulation of insoluble tau. Aha1 colocalized with tau pathology in human brain tissue, and this association positively correlated with AD progression. Aha1 overexpression in the rTg4510 tau transgenic mouse model promoted insoluble and oligomeric tau accumulation leading to a physiological deficit in cognitive function. Overall, these data demonstrate that Aha1 contributes to tau fibril formation and neurotoxicity through Hsp90. This suggests that therapeutics targeting Aha1 may reduce toxic tau oligomers and slow or prevent neurodegenerative disease progression.

Keywords: Aha1; Alzheimer’s disease; Hsp90; chaperones; tau oligomers.


Conflict of interest statement

Conflict of interest statement: C.A.D., L.B.S., B.S.J.B., J.K., and L.J.B. are the coinventors for the following provisional patent application: “The Hsp90 Activator Aha1 Drives Production of Pathological Tau Aggregates.”

Figures
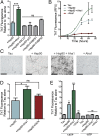
Fig. 1.
Fig. 1.
Hsp90 and Aha1 synergize to form tau aggregates. (A) Recombinant P301L tau fibril formation measured by thioflavin T (ThT) fluorescence, comparing the effect of five different recombinant cochaperone proteins with Hsp90 and ATP (results represent the mean ± SEM, n = 3; ***P < 0.001). ns, not significant. (B) Recombinant P301L tau fibril formation measured by ThT fluorescence over a period of 72 h with or without the addition of Hsp90 and Aha1 (results represent the mean ± SEM, n = 3). (C) Representative 20,000× TEM images of recombinant P301L tau fibrils formed in the presence of indicated chaperone proteins with ATP. (Scale bars: 2 μm.) (D) Recombinant P301L tau fibril formation was measured by ThT fluorescence in the presence ATP and chaperones as indicated (results represent the mean ± SEM, n = 3; *P < 0.05). (E) Recombinant P301L tau fibril formation measured by ThT fluorescence with varying mixtures of Hsp90, Aha1, and ATP as indicated (results represent the mean ± SEM, n = 3; ***P < 0.001, *P < 0.05).
Fig. S1.
Fig. S1.
E67K-Aha1 mutation reduces tau aggregation in vitro. Western blot of immunoprecipitated (IP) Hsp90 (FLAG) from iHEK cells transfected with either Aha1-WT or Aha1-E67K.
Fig. S2.
Fig. S2.
Tau fibril formation without heparin and DTT. (A) Recombinant P301L tau fibril formation measured by thioflavin T (ThT) fluorescence over a period of 72 h with or without the addition of Hsp90 and Aha1 (results represent the mean ± SEM, n = 3). RFU, relative fluorescence units. (B) Representative 20,000× TEM images. (Scale bars: 2 μm.)
Fig. 2.
Fig. 2.
KU-177 inhibits interaction between Hsp90 and Aha1. (A) Chemical structure of the novobiocin analogs KU-174, KU-177, and KU-308. The noviose sugar moiety (red) is required for Hsp90 binding of novobiocin analogs and is absent in KU-177 and KU-308. The biaryl amide moiety (green) has been shown to interact with Aha1 (18). (B) Immunoprecipitated Aha1 from PC3-MM2 cells treated with ±10 μM KU-308, KU-177, or KU-174 for 24 h was analyzed by Western blot. Without antibody (−Ab) indicates a mock immunoprecipitation. (C) Comparison of Hsp90-mediated luciferase refolding activity in PC3-MM2 cell treated with DMSO or 100, 25, 6.25, 1.56, 0.39, and 0.097 μM KU-308, KU-177, or KU-174 for 2 h. The IC50 value for KU-177 is shown (R2 = 0.98). Dose–response curves for KU-308 and KU-177 suggest the IC50 values would be higher than the range of concentrations examined here (KU-308, KU-174: n = 3; KU-177: n = 2). (D) Immunoprecipitated Aha1 from iHEK cells treated ±10 μM KU-177 for 24 h was analyzed by Western blot.
Fig. 3.
Fig. 3.
KU-177 inhibits Aha1 enhancement of Hsp90-mediated tau aggregation. (A) Recombinant P301L tau fibril formation measured by thioflavin T (ThT) fluorescence, comparing the effect of 10 μM KU-177 or DMSO on tau fibril formation (results represent the mean ± SEM, n = 3; **P < 0.01, *P < 0.05). (B) Representative 20,000× TEM images of recombinant P301L tau fibrils formed with KU-177 or DMSO control. (Scale bars: 2 μm.) (C) iHEK-P301L cells transfected with Aha1-WT, Aha1-E67K, or empty vector were treated with 10 μM KU-177 or DMSO and harvested, and soluble and sarkosyl-insoluble fractions were then prepared. Blots were probed by antibodies as indicated.
Fig. 4.
Fig. 4.
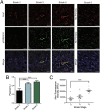
Human AD samples show colocalization between Aha1 and tau tangles. (A) Tissue samples from the medial temporal gyrus of patients at Braak stage 2, 5, or 6 were stained for Aha1 (red), pS396/404 tau tangles (green), and neuronal Nissl (Neurotrace, blue), and then imaged using confocal microscopy; images were taken at a magnification of 60×. (Scale bars: 20 μm.) Representative, control sections lacking primary antibody are shown on the Far Right. (B) Quantification of colocalization between Aha1 and phosphorylated tau tangles (pS396/404) (results represent the mean Pearson’s correlation coefficient ± SEM, n = 10 images; ***P < 0.001). (C) Scatter plot of the intensity of Aha1 fluorescence and Braak staging (results represent the mean fluorescence intensity ± SEM; Braak stage 2: n = 10 images, Braak stage 5: n = 14 images, Braak stage 6: n = 9 images; ***P < 0.001). RFU, relative fluorescence units.
Fig. 5.
Fig. 5.
Viral transduction leads to sustained overexpression of Aha1 in the hippocampus of rTg4510 mice. (A) Characteristic phenotype of rTg4510 tau transgenic mouse model along with experimental design time points. (B) Representative images of brain sections showing viral expression of Aha1 protein in AAV9-injected Aha1 and mCherry control littermates. (Scale bars: whole slice, 1,000 μm; Inset, 250 μm.)
Fig. 6.
Fig. 6.
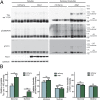
Aha1 overexpression in rTg4510 mice leads to increases in insoluble tau species. (A) Western blot analysis of soluble and sarkosyl-insoluble fractions from hippocampal tissue of rTg4510 mice expressing either AAV9-Aha1 or AAV9-mCherry. Six representative samples from AAV9-Aha1– and AAV9-mCherry–injected mice are shown. (B) Quantification of Western blots of sarkosyl-insoluble total (amino acids 1–150), pS396/404, and pT231 tau (results represent the mean ± SEM relative to the level of monomeric tau in AAV9-mCherry–injected mice (mCherry, n = 8; Aha1, n = 9; *P < 0.05, **P < 0.01). ns, not significant.
Fig. 7.
Fig. 7.
Aha1 overexpression in rTg4510 mice leads to increases in pathological tau species. (A) Dot blot of hippocampal tissue of individual mice shown in triplicate probed by T22. (B) Quantification of dot blot (results represent the mean ± SEM; mCherry, n = 8; Aha1, n = 8; **P < 0.01). (C) Dot blot of pooled hippocampal tissue shown in triplicate probed by T22. (D) Quantification of dot blot (results represent the mean ± SEM of triplicate samples taken from the pooled fractions; n = 3; **P < 0.05). (E) Representative images of brain tissue slices stained with T22 from AAV9-mCherry– and AAV9-Aha1–injected mice. (Scale bars: whole slice, 1,000 μm; Inset, 250 μm.) (F) Quantification of the T22-positive area in the hippocampal field of view (Inset from E) (results represent the mean ± SEM; mCherry, n = 8; Aha1, n = 9; *P < 0.05). (G) Samples from AAV9-Aha1 and AAV9-mCherry mice were run on a semidenaturing gel and probed by T22 (1:500, approximately 75 kDa) along with other antibodies as indicated. (H) Quantification of T22 Western blot (results represent the mean ± SEM; mCherry, n = 6; Aha1, n = 7; ***P < 0.001).
Fig. S3.
Fig. S3.
Tau solubility in WT mice. Western blot analysis of soluble and sarkosyl-insoluble fractions from hippocampal tissue of WT mice expressing either AAV9-Aha1 (n = 7) or AAV9-mCherry (n = 8). One rTg4510 mouse sample was included as a comparison.
Fig. 8.
Fig. 8.
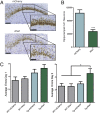
Aha1 overexpression in rTg4510 mice leads to cognitive impairments. (A) Representative images of NeuN-stained neurons in the CA1 region of the hippocampus (brown) counterstained with Cresyl violet (purple) from AAV9-mCherry– and AAV9-Aha1–injected mice (Insets). (Scale bars: 100 μm.) (B) Quantification of unbiased stereology (results represent the mean ± SEM; mCherry, n = 7; Aha1, n = 8; ***P = 0.0003). (C) RAWM was performed on AAV9-Aha1 and AAV9-mCherry rTg4510 (Tg) and WT littermates as indicated. Average errors from day 1 (training) and day 2 (memory) are shown (results represent the mean ± SEM; n ≥ 9; *P < 0.05).

Similar articles

Cited by

References

    1. Lee VM, Goedert M, Trojanowski JQ. Neurodegenerative tauopathies. Annu Rev Neurosci. 2001;24:1121–1159. - PubMed
    1. Ballatore C, Lee VM-Y, Trojanowski JQ. Tau-mediated neurodegeneration in Alzheimer’s disease and related disorders. Nat Rev Neurosci. 2007;8:663–672. - PubMed
    1. Caughey B, Lansbury PT. Protofibrils, pores, fibrils, and neurodegeneration: Separating the responsible protein aggregates from the innocent bystanders. Annu Rev Neurosci. 2003;26:267–298. - PubMed
    1. Sahara N, et al. Molecular chaperone-mediated tau protein metabolism counteracts the formation of granular tau oligomers in human brain. J Neurosci Res. 2007;85:3098–3108. - PubMed
    1. Blair LJ, Sabbagh JJ, Dickey CA. Targeting Hsp90 and its co-chaperones to treat Alzheimer’s disease. Expert Opin Ther Targets. 2014;18:1219–1232. - PMC - PubMed

Publication types

MeSH terms

LinkOut - more resources