. 2017 Jan 27;2(7):eaai8153.
doi: 10.1126/sciimmunol.aai8153.

Low CD21 expression defines a population of recent germinal center graduates primed for plasma cell differentiation

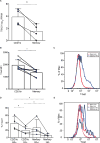
Affiliations

Low CD21 expression defines a population of recent germinal center graduates primed for plasma cell differentiation

Denise Lau et al. Sci Immunol. .

Abstract

In this study, we report that antigen-specific CD19+CD27+CD21lo (CD21lo) B cells are transiently induced 14 to 28 days after immunization, at the time germinal centers (GCs) peak. Although clonally related to memory B cells and plasmablasts, CD21lo cells form distinct clades within phylogenetic trees based on accumulated variable gene mutations, supporting exit from active GCs. CD21lo cells express a transcriptional program, suggesting that they are primed for plasma cell differentiation and are refractory to GC differentiation, although they do not spontaneously secrete antibody. In addition, CD21lo cells differentially express multiple cell surface markers and have elevated intracellular levels of Blimp-1 and T-bet protein compared with memory B cells. Together, these data support a model in which CD21lo cells are recent GC graduates that represent a distinct population from CD27+ classical memory cells, are refractory to GC reentry, and are predisposed to differentiate into long-lived plasma cells.


Conflict of interest statement

Competing interests: There are no competing interests.

Figures

Fig. 1
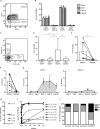
Fig. 1. CD21lo cells are enriched for influenza specific cells
The proportion of influenza specific cells in the CD21lo population compared to the memory B cell population was evaluated from cells isolated from peripheral blood. (A) Representative FACS gating of CD19+ B cells by CD27 and CD21. (B) Proportion of CD19+CD38lo cells in the CD27−CD21+, CD27+CD21+, CD27+CD21lo, and CD27−CD21lo compartments at 0, 7, 14, and 60 days after vaccination (n=3). Bar graphs show mean (+/− SD) (C) Representative gating of hemagglutinin (HA) staining 14 days post-immunization in the CD19+CD38−CD27+CD21lo compartment. (D) Percentage of H1N1 and H3N2 HA binding cells in the CD27−CD21+, CD27+CD21+, CD27+CD21lo, and CD27-CD21lo subsets as determined by FACS analysis 14 days after immunization (n=6). Significance was determined using the Wilcoxon matched-pairs test. A CD19+CD38lo gate was included in the FACS analysis to remove plasmablasts from the analysis. Bar graphs show mean (+/− SD) (E) Percentage of H1N1 and H3N2 HA binding cells in the CD21lo or memory compartment as determined by FACS analysis (n=6). Lines link data points from the same individual. Significance was determined using the Wilcoxon matched-pairs test. Bar graphs show mean (+/− SD) (F) Percentage of vaccine specific IgM, IgG and IgA+ CD21lo and classical memory B cells as measured by ELISPOT 14 days post-immunization (n=5). Significance was determined using a two-tailed paired t-test. Bar graphs show mean (+/− SD) (G) Percentage of vaccine specific IgM, IgG and IgA+ CD21lo or classical memory B cells as measured by ELISPOT from 0 (n=4), 7 (n=3), 14 (n=5), 28 (n=5), and 60 (n=3) days post-immunization. Cells were sorted and stimulated for 5 days with CpG, PWM and SAC before being plated on ELISPOT plates coated with the 2012–2013 or 2014–2015 vaccine. Line graphs show mean (+/− SE) (H) Percentage of vaccine binding monoclonal antibodies generated from each individual. Values beside each data point represent the number of antibodies assayed for that person. (I) Scatchard plots of binding of specific antibodies to the 2014–2015 seasonal influenza vaccine (244-014-73, 54-15-72, 221-14-16) or inactivated H1N1 A/California/07/09 virus (51-10-077). (J) Isotype of the CD21lo cells isolated for mAb generation was determined using blast on sequences generated during the PCR steps of cloning. Bar graphs show the proportion of CD21lo cells that were cloned into mAbs that express IgM, IgG and IgA antibodies for each individual.
Fig. 2
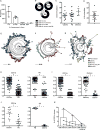
Fig. 2. CD21lo cells are clonally related to plasmablasts and memory B cells but form distinct clades
454 sequencing was performed on cDNA libraries generated from PCR amplified antibody genes from plasmablasts, memory B cells, and CD21lo cells isolated from 3 subjects that received the 2010–2011 seasonal influenza vaccine. (A) Number of clonal families of each size (n=3). Clone numbers were normalized for sequencing sample size by rarefaction. (B) Pie charts showing the proportion of Day 14 CD21lo containing clones that also contain PB or Day 14 memory sequences. (C) Mean number of mutations in the V region for Day 14 CD21lo and plasmablast sequences for each influenza specific clone (n=13). (D) Difference in V region nucleotide mutation number between the most and least mutated sequences within each influenza specific clone (n=13). (E–G) Representative maximum likelihood trees. Trees are rooted on the germline VH-JH sequence of the clone. Empirical probability of a Day 14 CD21lo sequence will have another Day 14 CD21lo sequence as its nearest neighbor in the phylogenetic tree or vice versa for plasmablast (n=219) (H) or Day 14 memory B cell (n=87) (I) or sequences in experimentally verified flu specific clones (n=12) (J). Significance was determined with a two-tailed paired t- test. Each dot represents the probability calculated for an individual clone. The line denotes the mean. (K) Percentage of clones that contain Day 14 CD21lo sequences that also contain sequences from Day 90 CD21lo, Day 90 memory, or both.
Fig. 3
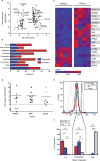
Fig. 3. CD21lo cells are transcriptionally distinct from memory B cells
RNASeq was performed on CD21lo and memory B cells isolated 14 days post-immunization. Sequence alignment and differential gene expression was analyzed using the Tuxedo suite on Galaxy. (A) Scatter plot showing the mean expression (log2 RPKM) plotted against log fold change of the 260 genes that are significantly differentially expressed between CD21lo and memory B cells (FDR < 0.05). Red dots represent genes highlighted in the text. (B) Functional pathway analysis of differentially expressed genes. (C) Heatmap representing the expression (RPKM) of selected differentially expressed genes. (D) Expression fold change of CD21lo over memory from QPCR validation of key plasma cell associated genes (n=11). The line represents the mean. To measure protein expression of Blimp-1, CD21lo and memory B cells were isolated 21 days post-immunization. (E) Representative histogram from FACS analysis of intracellular Blimp-1 expression in HA+ CD21lo, HA+ memory B cells, and plasmablasts. (F) Proportion of HA+ CD21lo, HA+ memory B cells, and plasmablasts that are Blimp-1lo, Blimp-1int, and Blimp-1hi (n=3). Statistical significance is calculated using paired student t-test (*, p < 0.05; **, p < 0.01; ***, p < 0.001).
Fig. 4
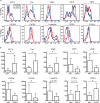
Fig. 4. Differential expression of surface markers by CD21lo cells compared to memory B cells
Flow cytometry analysis was performed on PBMCs isolated 14 days after immunization with the 2013–2014 or 2014–2015 seasonal influenza vaccine. PBMCs were frozen after isolation and thawed prior to antibody staining. (A) Representative histograms from FACS analysis of CD21lo and memory B cells for a panel of markers. (B) Surface expression as represented by the median fluorescence intensity (MFI) for a panel markers (n>= 6). Statistical significance is calculated using paired student t-test (*, p < 0.05). Bar graphs show mean (+/− SD).
Fig. 5
Fig. 5. CD21lo cells are functionally distinct from memory and plasma cells
CD21lo and memory B cells were isolated form the peripheral blood from healthy individuals during steady state. Cells were incubated on ELISPOT plates for 5 hours or overnight with no stimulation. (A) Representative ELISPOT image showing plasmablasts producing both IgG and IgA antibodies while memory and CD21lo cells produce neither. (B) Summary of the frequency of IgG (n=3) or IgA (n=3) antibody secreting cells in the plasmablast, CD21lo and memory populations. Additionally, CD21lo and memory B cells were isolated 0 (n=4), 7 (n=3), 14 (n=5), 28 (n=5), and 60 (n=3) days post-immunization and stimulated for 5 days with CpG, PWM and SAC before being plated ELISPOT plates coated with vaccine. Bar graphs represent mean (+/− SD). (C) Intracellular calcium levels were measured in a flow cytometry assay using Fluo-4 AM in memory and CD21lo cells 21 days after immunization. Cells loaded with Fluo-4 AM were run on the flow cytometer for 60 seconds and then stimulated with Anti-IgG Fab’2 (25 μg/ml) and Anti-IgK Fab’2 (25 μg/ml) or 20 uM ionomycin. Representative traces show the mean fluorescence intensity (MFI) levels of Fluo-4 before and after stimulus. (D) Maximum free calcium concentration for memory and CD21lo cell types is represented by the peak Fluo-4 MFI for each cell type (n=3). Quantification of intracellular calcium levels was adjusted by basal levels of calcium, which were established before stimulation. Statistical significance is calculated using paired student t-test (*, p < 0.05). Bar graphs represent mean (+/− SD).
Fig. 6
Fig. 6. CD21lo cells have elevated levels of T-bet compared to memory B cells
(A) T-bet RNA expression, as determined by RNASeq experiments described in Figure 3, in CD21lo and memory B cells. Statistical significance is calculated using paired student t-test (*, p < 0.05). T-bet protein expression was measured using flow cytometry. CD21lo and memory B cells were isolated form the peripheral blood from healthy individuals 14 days after immunization (n=4). (B) Protein expression is represented by the MFI (median fluorescence intensity). Statistical significance is calculated using paired student t-test (*, p < 0.05) (n=7). Bar graphs represent mean (+/− SD). (C) Representative histograms from FACS analysis of T-bet expression in CD21lo and memory B cells. (D) The CD21lo and memory populations were divided into HA+ and HA− subsets. The percent of T-bet+ cells in each population was determined by measuring the proportion of cells that had greater levels of staining than the isotype control. Statistical significance is calculated using paired student t-test (*, p < 0.05) (n=4). Bar graphs represent mean (+/− SD). (E) Representative histograms from FACS analysis of T-bet expression in CD21lo HA+, CD21lo HA−, memory HA+ and memory HA− cells.

Similar articles

Cited by

References

    1. Victora GD, Nussenzweig MC. Germinal Centers. Annu Rev Immunol. 2012;30:429–457. - PubMed
    1. Tas JMJ, et al. Visualizing antibody affinity maturation in germinal centers. Science. 2016;351:1048–1054. - PMC - PubMed
    1. Dogan I, et al. Multiple layers of B cell memory with different effector functions. Nat Immunol. 2009;10:1292–1299. - PubMed
    1. McHeyzer-Williams LJ, McHeyzer-Williams MG. Antigen-Specific Memory B Cell Development. Annu Rev Immunol. 2005;23:487–513. - PubMed
    1. Slifka MK, Antia R, Whitmire JK, Ahmed R. Humoral Immunity Due to Long-Lived Plasma Cells. Immunity. 1998;8:363–372. - PubMed