. 2017 Jun 15;31(12):1228-1242.
doi: 10.1101/gad.299958.117. Epub 2017 Jul 19.

Nuclear mTOR acts as a transcriptional integrator of the androgen signaling pathway in prostate cancer

Affiliations

Nuclear mTOR acts as a transcriptional integrator of the androgen signaling pathway in prostate cancer

Étienne Audet-Walsh et al. Genes Dev. .

Abstract

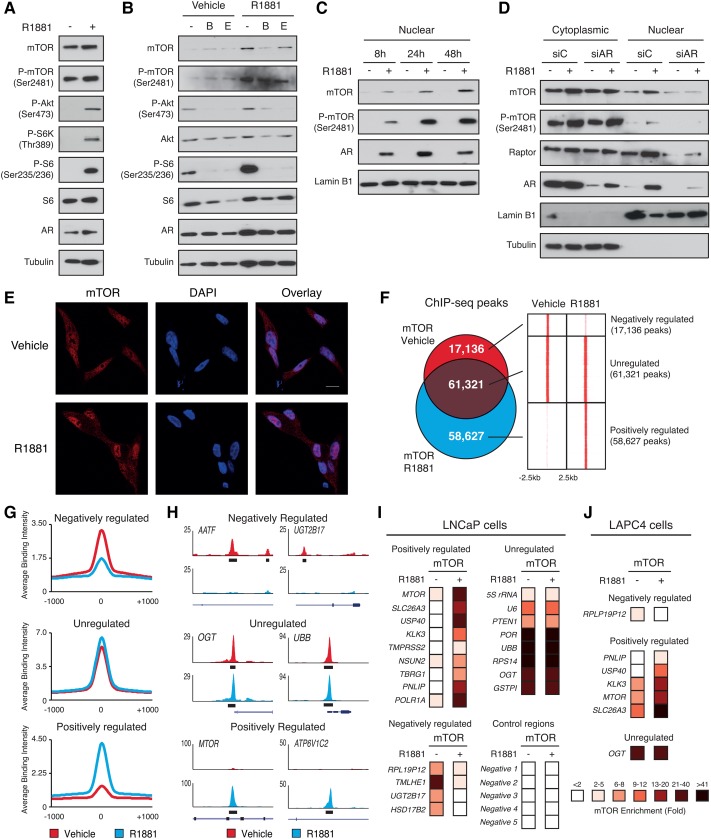
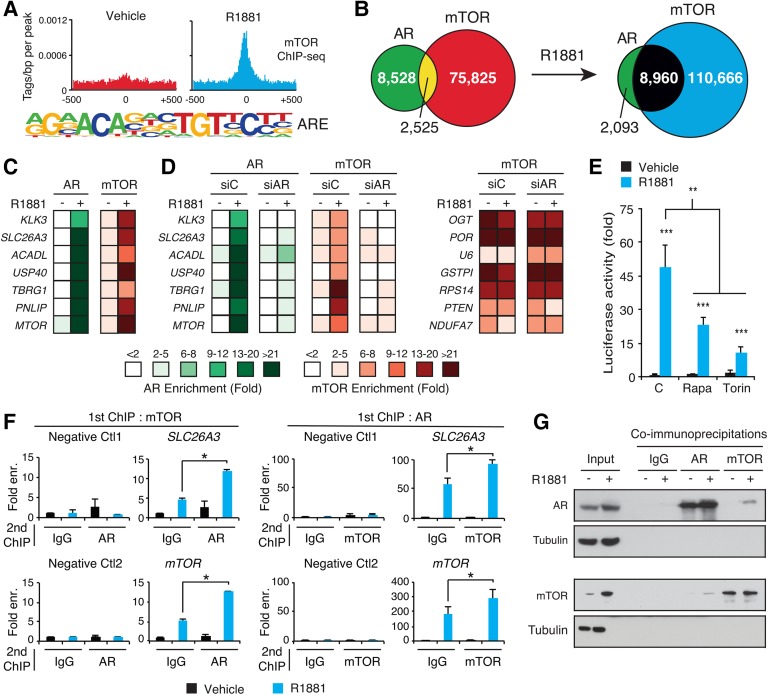
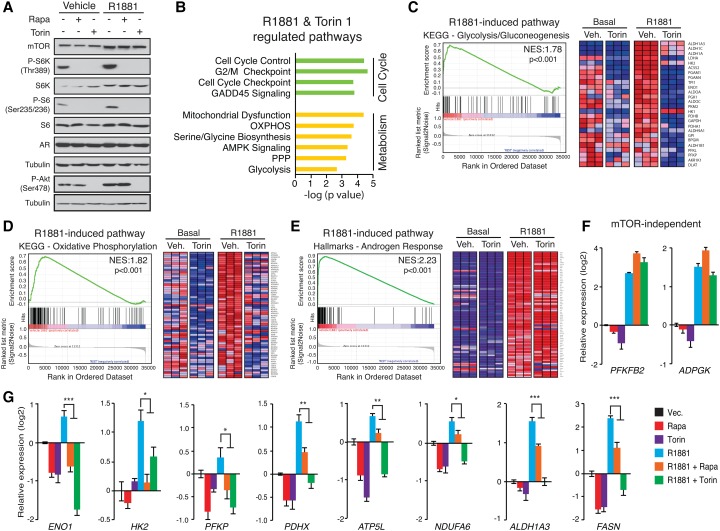
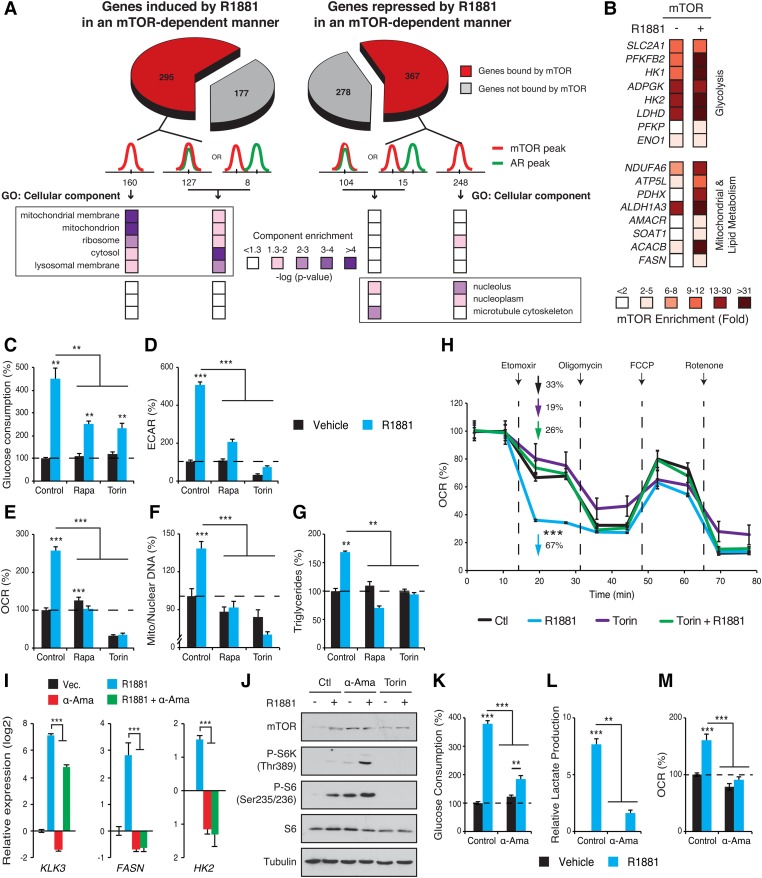
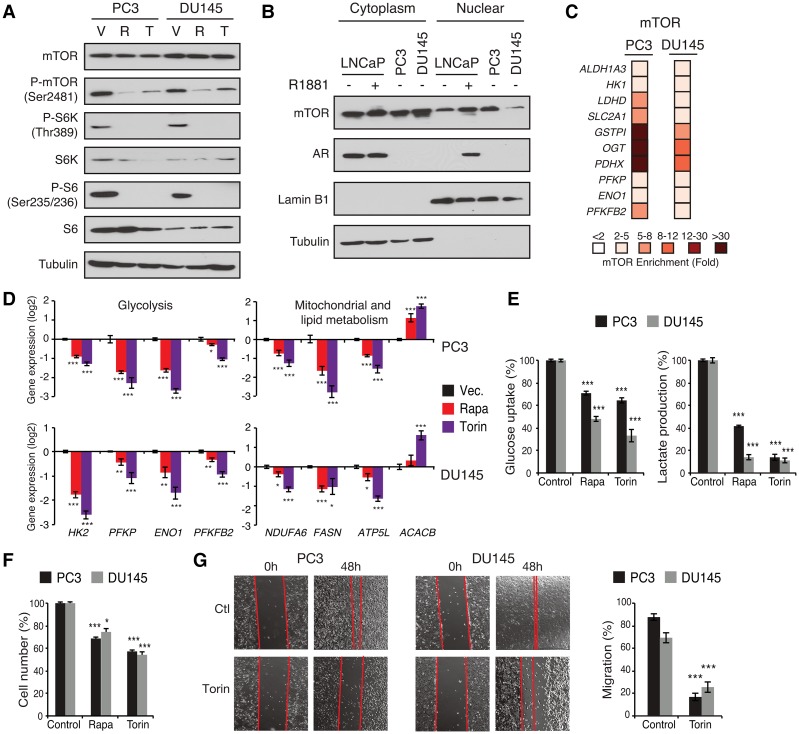
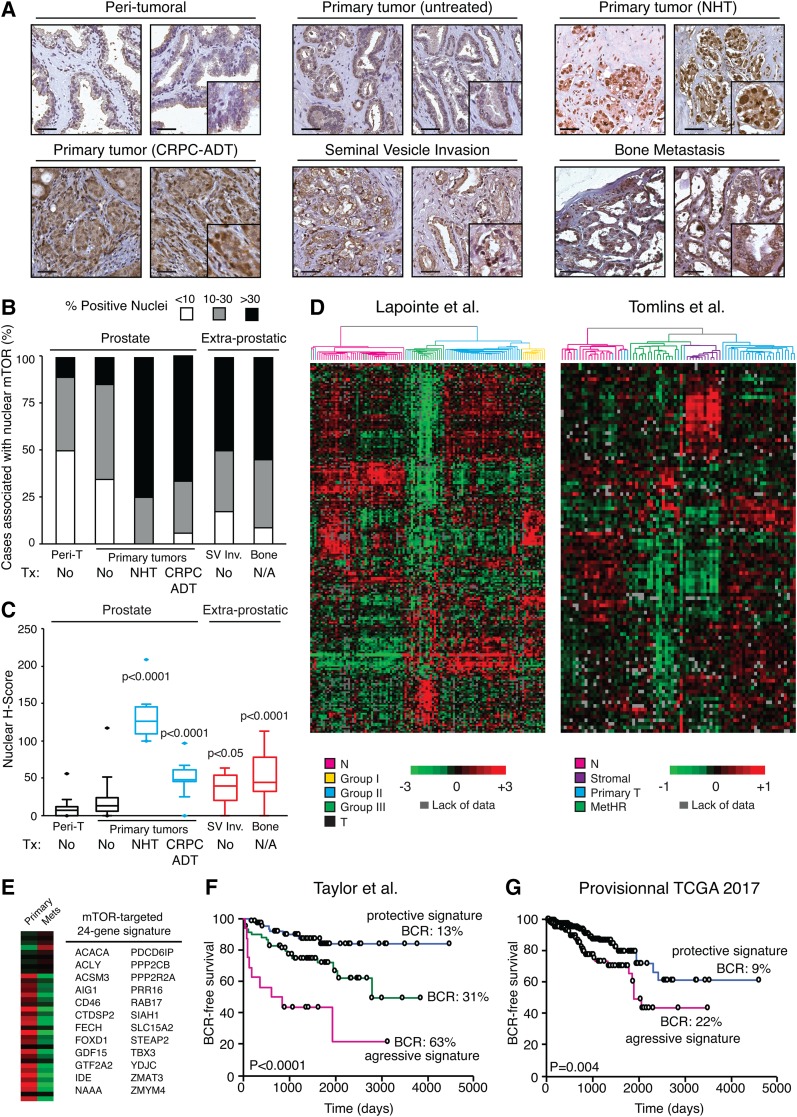
Androgen receptor (AR) signaling reprograms cellular metabolism to support prostate cancer (PCa) growth and survival. Another key regulator of cellular metabolism is mTOR, a kinase found in diverse protein complexes and cellular localizations, including the nucleus. However, whether nuclear mTOR plays a role in PCa progression and participates in direct transcriptional cross-talk with the AR is unknown. Here, via the intersection of gene expression, genomic, and metabolic studies, we reveal the existence of a nuclear mTOR-AR transcriptional axis integral to the metabolic rewiring of PCa cells. Androgens reprogram mTOR-chromatin associations in an AR-dependent manner in which activation of mTOR-dependent metabolic gene networks is essential for androgen-induced aerobic glycolysis and mitochondrial respiration. In models of castration-resistant PCa cells, mTOR was capable of transcriptionally regulating metabolic gene programs in the absence of androgens, highlighting a potential novel castration resistance mechanism to sustain cell metabolism even without a functional AR. Remarkably, we demonstrate that increased mTOR nuclear localization is indicative of poor prognosis in patients, with the highest levels detected in castration-resistant PCa tumors and metastases. Identification of a functional mTOR targeted multigene signature robustly discriminates between normal prostate tissues, primary tumors, and hormone refractory metastatic samples but is also predictive of cancer recurrence. This study thus underscores a paradigm shift from AR to nuclear mTOR as being the master transcriptional regulator of metabolism in PCa.

Keywords: CRPC; ChIP-seq; androgen receptor; energy metabolism; nuclear receptor; steroid.


Figures

Figure 1.
Figure 1.
Cytoplasmic and nuclear mTOR activities are induced by androgen signaling. (A) Protein expression of components of the mTOR signaling pathway and AR in whole-cell lysates from LNCaP cells after a 48-h treatment with R1881 or vehicle. Tubulin is shown as a loading control. (B) Protein expression of components of the mTOR signaling pathway in whole-cell lysates from LNCaP cells after a 48-h treatment with R1881 and/or anti-androgens (bicalutamide [B] and enzalutamide [E]). Tubulin is shown as a loading control. (C) Western blot analysis of nuclear fractions of LNCaP cells treated with R1881 or vehicle for various amounts of time. Lamin B1 is shown as a loading control. (D) Western blot analysis of cytoplasmic and nuclear fractions of LNCaP cells transfected with control or anti-AR siRNA and treated with R1881 or vehicle for 48 h. Lamin B1 and tubulin are shown as controls for nuclear and cytoplasmic extracts, respectively. (E) Immunofluorescence showing increased mTOR (red) levels in the nucleus following a 48-h treatment with R1881 in LCNaP cells. Nuclei were stained with DAPI (blue). (F) Overlap between mTOR DNA-binding peaks in LNCaP cells treated for 48 h with R1881 or vehicle and heat maps of the signal intensity of mTOR genomic binding peaks in a window of ±2.5 kb. (G) Average ChIP-seq (chromatin immunoprecipitation [ChIP] combined with high-throughput sequencing) signal intensities normalized per reads for down-regulated, unregulated, and up-regulated mTOR peaks. (H) Examples of University of California at Santa Cruz Genome Browser graphical views of mTOR-binding peaks in LNCaP cells treated with R1881 or vehicle that are either unaffected (unregulated) or positively or negatively regulated by androgens. Genes and peaks (black boxes) are indicated below tag density graphs. ChIP-qPCR (ChIP combined with quantitative PCR) of mTOR in LNCaP (I) or LAPC4 (J) cells after 48 h of treatment with R1881 or vehicle. Relative fold enrichment was normalized over two negative regions and is shown relative to IgG (set at 1). Results are shown as the average of three independent experiments.
Figure 2.
Figure 2.
AR reprograms mTOR interaction with the genome of PCa cells. (A) Motif discovery analysis of mTOR ChIP-seq peaks identified from R1881-treated LNCaP cells revealed the ARE as the major motif enriched in response to androgen stimulation. (B) Overlap between AR and mTOR DNA-binding sites following R1881 or vehicle treatment. (C) ChIP-qPCR of mTOR and AR at the same binding sites in LNCaP cells following a 48 h of androgen treatment. (D) ChIP-qPCR analyses of AR and mTOR binding in LNCaP cells transfected with siControl (siC) or siAR and treated with vehicle or R1881 for 48 h. ChIP-qPCRs were performed for androgen-sensitive (left) and androgen-insensitive (right) mTOR-binding sites. (E) Luciferase reporter assay under the control of 2xAREs in LNCaP cells following a 24 h of treatment with R1881, rapamycin, torin 1, or vehicles, as indicated. Results are shown as the average of three independent experiments performed in triplicate. (F) ChIP–reChIP analysis shows corecruitment of AR and mTOR to the same genomic regions following androgen treatment. The significant enrichments at SLC26A3 and mTOR genes with IgG as a second antibody reflect the enrichment from the first ChIP, done with either AR or mTOR antibodies. Results are shown as the average of two independent experiments. (G) Co-IP of AR and mTOR in the absence or presence of androgens. (*) P < 0.05; (**) P < 0.01; (***) P < 0.001.
Figure 3.
Figure 3.
Nuclear mTOR is essential for androgen-mediated transcriptional control of metabolic gene signatures. (A) Activation status of the mTOR signaling pathway following treatment with R1881 and/or cotreatment with the mTOR inhibitors rapamycin and torin 1. (B) Ingenuity Pathway Analysis (IPA) pathway enrichment of genes modulated by R1881 but blocked by mTOR inhibition in LNCaP cells. GSEA plots for androgen-stimulated glycolytic (C) and OXPHOS (D) gene signatures that are AR- and mTOR-dependent. “Core genes” are shown in the heat maps. (E) GSEA plots for the AR-dependent but mTOR-independent gene signatures associated with “androgen response.” Only genes identified as “core genes” are shown in the heat map. qRT–PCR analysis of metabolic genes modulated by androgens in an mTOR-independent (F) or mTOR-dependent (G) manner following a 48-h treatment with R1881 and/or cotreatment with rapamycin or torin 1. Values represent mean ± SEM of three independent experiments performed at least in duplicate. (*) P < 0.05; (**) P < 0.01; (***) P < 0.001.
Figure 4.
Figure 4.
Nuclear mTOR dictates androgen-dependent metabolic reprogramming. (A) Functional genomics analysis of AR–mTOR cross-talk in PCa cells. Genes positively regulated by AR activation and for which mTOR inhibition by torin 1 blocked this regulation are shown. Gene ontology (GO) component enrichment analysis of the subset of these genes containing at least one mTOR peak within ±20 kb of their transcription start sites is shown. (B) mTOR ChIP-qPCR analysis of metabolic genes in LNCaP cells treated for 2 d with R1881 or vehicle. Results are shown as the average of three independent experiments. (C) Glucose consumption of LNCaP cells after a 4-d treatment with R1881 and/or cotreatment with mTOR inhibitors. The ECAR (D), an indicator of lactate production, and the oxygen consumption rate (OCR) (E) were analyzed in LNCaP cells following a 3-d treatment with R1881 and/or cotreatment with mTOR inhibitors. (F) Relative mitochondrial/nuclear DNA content of LNCaP cells following a 96-h treatment with R1881 with or without mTOR inhibitors. (G) Triglyceride content of LNCaP cells treated for 96 h with R1881, mTOR inhibitors, or vehicles. (H) Oxidative capacity following inhibition of FAO by etomoxir in LNCaP cells following treatment with R1881 or vehicle. One representative experiment is shown. n = 5. (I) qRT–PCR analysis of metabolic gene expression following a 48-h treatment with androgens and/or α-amanitin. (J) Activation status of the mTOR signaling pathway following treatment with R1881 or vehicle with or without cotreatment with the RNA polymerase II inhibitor α-amanitin. Glucose consumption (K), lactate production (L), and OCR (M) of LNCaP cells after a 3-d treatment with or without androgens and cotreated with or without α-amanitin. Results from CG, I, and KM are shown as the average ± SEM of at least three independent experiments performed in triplicate, and metabolic data were further normalized for cell number. (**) P < 0.01; (***) P < 0.001.
Figure 5.
Figure 5.
Transcriptional control of metabolism by mTOR in AR-null PCa cells. (A) Status of the mTOR signaling pathway activity following treatment with vehicle (V), rapamycin (R), or torin 1 (T) in PC3 and DU145 cells in the absence of androgens. Tubulin is shown as a loading control. (B) Detection of nuclear mTOR by Western blotting in LNCaP, PC3, and DU145 cells. Lamin B1 and tubulin are shown as loading controls for nuclear and cytoplasmic extracts, respectively. (C) ChIP-qPCR assessment of mTOR recruitment to DNA regulatory regions of metabolic genes in PC3 and DU145 cells. Results are shown as the average of three independent experiments. (D) qRT–PCR assessment of metabolic gene expression related to glycolysis (left) or mitochondrial and lipid metabolism (right) following 48 h of treatment with vehicle, rapamycin (rapa), or torin 1. (E) Glucose consumption and lactate production measured from the media of PC3 and DU145 cultured cells following a 48-h treatment with rapamycin, torin 1, or vehicle (control). (F) Cell number determination of PC3 and DU145 cells following a 48-h treatment with rapamycin, torin 1, or vehicle (control). (G) Migration assay for PC3 and DU145 cells with or without treatment with the mTOR inhibitor torin 1. Values in D–G represent mean ± SEM of at least three independent experiments performed in triplicate. (*) P < 0.05; (**) P < 0.01; (***) P < 0.001.
Figure 6.
Figure 6.
Nuclear mTOR levels and activities are indicators of poor-outcome PCa. (A) Representative images from human prostate specimens immunostained for mTOR detection. Bar, 50 µm. (B) Histogram of nuclear mTOR distribution across patient samples. (C) Nuclear H-score of mTOR staining of peri-tumoral, primary PCa tumors, and metastatic lesions. (Peri-t) Peri-tumoral; (SV Inv.) seminal vesicle invasion; (Tx) treatment. Refer to Supplemental Figure S6F for cohort sizes. Significance is shown compared with both peri-tumoral and primary PCa tumors. (D) Unsupervised hierarchical clustering analysis with an mTOR targeted 622-gene signature in two independent clinical cohorts. In the data published by Lapointe et al. (2004), subtype colors denote sample classification as originally published. (N) Peri-tumoral tissues; (T) two tumors that clustered with peri-tumoral tissues in the original classification also clustered in a similar manner in the present study. In the data published by Tomlins et al. (2007), subtype colors discriminate between normal or peri-tumoral epithelial cells (N), stromal cells, primary localized PCa (primary T), and hormone-refractory metastatic PCa (MetHR). (E) A condensed mTOR targeted 24-gene signature capable of discriminating primary versus metastatic tumors and used to assess the risk of the biochemical recurrence rate (BCR) in patients. Kaplan-Meier biochemical recurrence-free survival analysis of patients from Taylor et al. (2010) (F) and The Cancer Genome Atlas (TCGA) provisional cohort (G) using a 24-gene mTOR targeted signature. Log-rank P-values are shown.

Similar articles

Cited by

References

    1. Alayev A, Salamon RS, Berger SM, Schwartz NS, Cuesta R, Snyder RB, Holz MK. 2016. mTORC1 directly phosphorylates and activates ERα upon estrogen stimulation. Oncogene 35: 3535–3543. - PMC - PubMed
    1. Armstrong AJ, Halabi S, Healy P, Alumkal JJ, Winters C, Kephart J, Bitting RL, Hobbs C, Soleau CF, Beer TM, et al. 2017. Phase II trial of the PI3 kinase inhibitor buparlisib (BKM-120) with or without enzalutamide in men with metastatic castration resistant prostate cancer. Eur J Cancer 81: 228–236. - PMC - PubMed
    1. Audet-Walsh E, Papadopoli DJ, Gravel SP, Yee T, Bridon G, Caron M, Bourque G, Giguère V, St-Pierre J. 2016. The PGC-1α/ERRα axis represses one-carbon metabolism and promotes sensitivity to anti-folate therapy in breast cancer. Cell Rep 14: 920–931. - PubMed
    1. Audet-Walsh E, Yee T, McGuirk S, Vernier M, Ouellet C, St-Pierre J, Giguere V. 2017. Androgen-dependent repression of ERRγ reprograms metabolism in prostate cancer. Cancer Res 77: 378–389. - PubMed
    1. Beltran H, Prandi D, Mosquera JM, Benelli M, Puca L, Cyrta J, Marotz C, Giannopoulou E, Chakravarthi BV, Varambally S, et al. 2016. Divergent clonal evolution of castration-resistant neuroendocrine prostate cancer. Nat Med 22: 298–305. - PMC - PubMed

Publication types

Grants and funding