. 2017 Jul 14;12(7):e0179762.
doi: 10.1371/journal.pone.0179762. eCollection 2017.

Tumor Necrosis Factor dynamically regulates the mRNA stabilome in rheumatoid arthritis fibroblast-like synoviocytes

Affiliations

Tumor Necrosis Factor dynamically regulates the mRNA stabilome in rheumatoid arthritis fibroblast-like synoviocytes

Konstantinos Loupasakis et al. PLoS One. .

Abstract

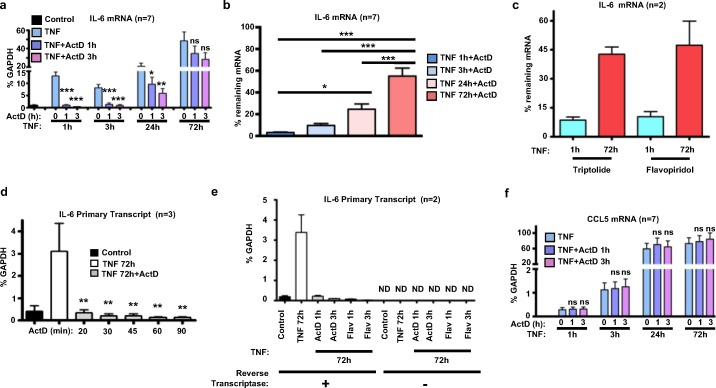
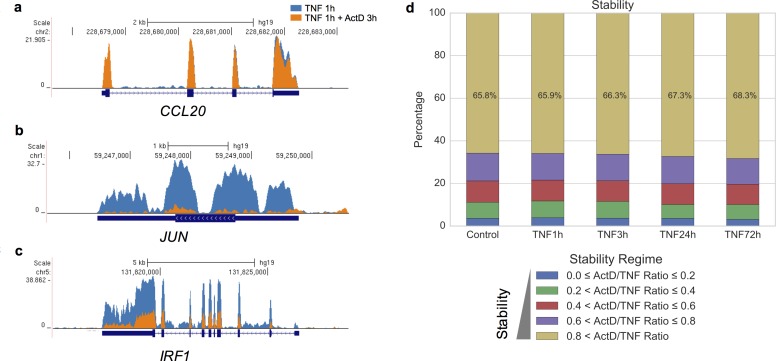
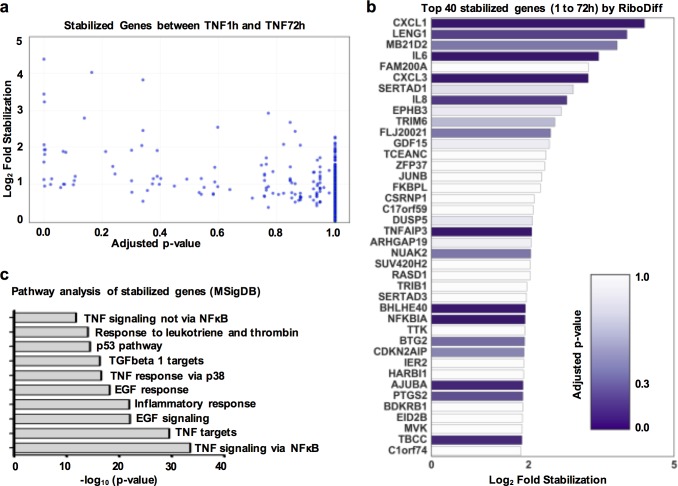
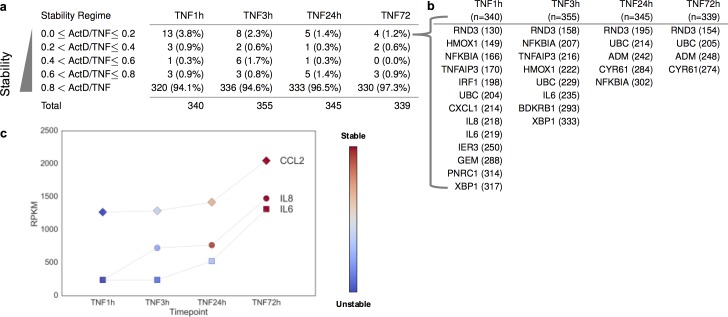
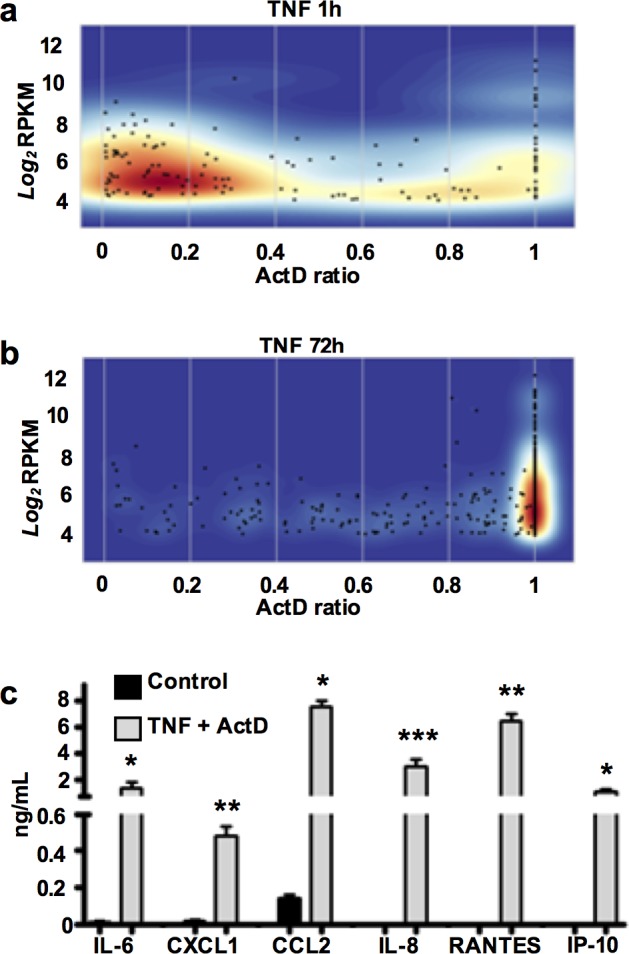
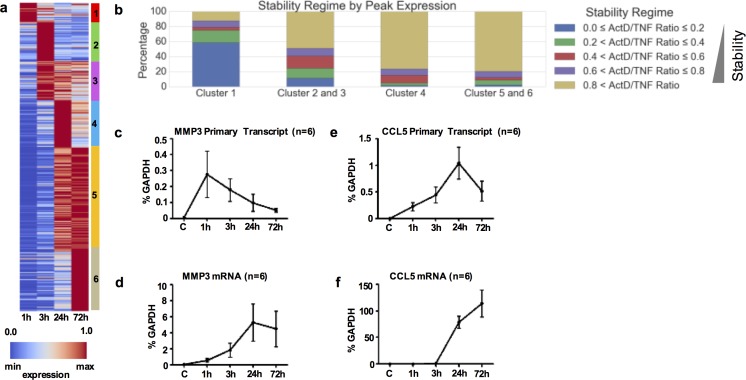
During rheumatoid arthritis (RA), Tumor Necrosis Factor (TNF) activates fibroblast-like synoviocytes (FLS) inducing in a temporal order a constellation of genes, which perpetuate synovial inflammation. Although the molecular mechanisms regulating TNF-induced transcription are well characterized, little is known about the impact of mRNA stability on gene expression and the impact of TNF on decay rates of mRNA transcripts in FLS. To address these issues we performed RNA sequencing and genome-wide analysis of the mRNA stabilome in RA FLS. We found that TNF induces a biphasic gene expression program: initially, the inducible transcriptome consists primarily of unstable transcripts but progressively switches and becomes dominated by very stable transcripts. This temporal switch is due to: a) TNF-induced prolonged stabilization of previously unstable transcripts that enables progressive transcript accumulation over days and b) sustained expression and late induction of very stable transcripts. TNF-induced mRNA stabilization in RA FLS occurs during the late phase of TNF response, is MAPK-dependent, and involves several genes with pathogenic potential such as IL6, CXCL1, CXCL3, CXCL8/IL8, CCL2, and PTGS2. These results provide the first insights into genome-wide regulation of mRNA stability in RA FLS and highlight the potential contribution of dynamic regulation of the mRNA stabilome by TNF to chronic synovitis.


Conflict of interest statement

Competing Interests: The authors have declared that no competing interests exist.

Figures

Fig 1
Fig 1. TNF induces late stabilization of IL-6 mRNA in RA FLS.
RA FLS were exposed to a single dose of TNF (10 ng/ml) for 1-72h. Subsequently, actinomycin D (Act D; 10 μg/ml) or triptolide (1 μM), or flavopiridol (Flav; 0.5 μM) was added for 1 or 3h and qPCR was used to measure the mRNA levels of IL-6 (a-c), the primary transcripts (PT) of IL6 (d-e), and the mRNA levels of CCL5 (f). For (b-c), the remaining expression of IL-6 after exposure to inhibitors of transcription (Act D, triptolide, and flavopiridol) was calculated as % of the IL-6 mRNA expressed in the absence of inhibitor at the corresponding TNF-stimulated condition. For (a-b) and (f), cumulative results from 7 independent experiments are shown. For (d-e), FLS were exposed to a single dose of TNF (10 ng/ml) for 72 hours and then inhibitors (Act D or flavopiridol) were added for the indicated time points to block active transcription. Primers specific for the fourth intronic region of IL6 were designed to capture primary transcripts of IL6.Values were normalized relative to GAPDH mRNA and presented as mean ±SEM. GAPDH was considered an appropriate internal control for normalizing qPCR results since TNF stimulation had no impact on expression levels and stability status of GAPDH mRNA (S1 Table). P values were calculated by one-way ANOVA and Tukey post-test analysis (* = p<0.05, ** = p<0.01, *** = p<0.001, ns = not significant, and ND = not detected).
Fig 2
Fig 2. Genome-wide evaluation of mRNA stability states of expressed genes in RA FLS.
(a-c), Gene tracks showing sequencing reads from RNA sequencing mapped to CCL20 (a), JUN (b) and IRF1 (c) genes. The sequencing reads after TNF stimulation for 1 hour without (blue) or with Act D (orange) are shown. (d), Stacked bar graphs illustrating the mRNA stability states of genes expressed in unstimulated (Control) and TNF-stimulated FLS (1, 3, 24 and 72 hours of TNF stimulation). The mRNA stability status was calculated as the ratio of expression levels at the TNF+Act D condition divided to the expression levels at the TNF condition. This ratio ranges from 0 to 1 and classifies genes to a spectrum from very unstable to very stable transcripts. The expressed genes were classified into five groups with distinct stability states and the size of each group is represented as % of total number of expressed genes for each condition.
Fig 3
Fig 3. Genome-wide identification of transcripts stabilized by TNF in RA FLS.
Two biologic replicates of RA FLS (derived from two different RA patients) were exposed to a single dose of TNF (10 ng/ml) for 1 or 72h. Subsequently, Act D was added for 3h and gene expression was measured by RNA sequencing. The degree of TNF-induced mRNA stabilization was calculated as the log2 difference of TNF+Act D/TNF ratio between 1 and 72h of TNF stimulation and the adjusted p values of TNF-induced stabilization were calculated by RiboDiff. (a), Scatter-plot of the genes displaying TNF-induced mRNA stabilization comparing the degree of mRNA stabilization (y axis) to the adjusted p values of the stabilizing effect of TNF (x-axis). (b), The top 40 genes displaying the highest TNF-induced mRNA stabilization ranked by the degree of stabilization. (c), Enriched biological processes identified by GSEA/MSigDB pathway analysis of the top 10% of the genes (n = 593) displaying the highest degree of TNF-induced mRNA stabilization.
Fig 4
Fig 4. TNF induces expression of mRNA-stabilizing pathways and mRNA stabilization is MAPK-dependent.
(a), RNA sequencing was performed in 2 biological replicates (derived from two different RA patients) of TNF-stimulated RA FLS and Panther-Gene Ontology was used to evaluate their enrichment for the biological process “Regulation of RNA stability” (GO:0043487 or GO:0043488). F.E = fold enrichment and ns = not significant. (b-h), RA FLS were exposed to a single dose of TNF (10 ng/ml) for 72h and then Act D (10 μg/ml) was added for 20 mins to block active transcription. Subsequently, the cells were treated for 4h with SB202190 (p38 inhibitor) alone or in various combinations with U0126 (MEK inhibitor) and SP600125 (JNK inhibitor). qPCR was used to measure the mRNA levels of CCL5 (b), IL-6 (c), IL-8 (d), CXCL3 (e), CCL2 (f), PTGS2 (g), and CXCL1 (h). Cumulative results from 4 independent experiments are shown. Values were normalized relative to GAPDH mRNA and presented as mean ±SEM. The mRNA expression at the TNF+Act D condition was set to 100 and the mRNA expression at all the other conditions was calculated as % of the TNF+Act D condition. P values were calculated by one-way ANOVA and Tukey post-test analysis (* = p<0.05, ** = p<0.01, *** = p<0.001, and ns = not significant).
Fig 5
Fig 5. Scatterplots comparing the expression levels to the mRNA stability states of the expressed genes in RA FLS.
Two biological replicates of RA FLS (derived from two different RA patients) were exposed to a single dose of TNF (10 ng/ml) for 1, 3, 24, or 72 hours. Subsequently, actinomycin D (Act D, 10μg/ml) was added for 3 hours to block active transcription and gene expression was measured by RNA sequencing. RPKM values were generated using CuffDiff2. The mRNA stability status was calculated genome-wide as the ratio of RPKM levels at the TNF+Act D condition divided to the RPKM levels at the TNF condition. This ratio ranges from 0 to 1 and classifies genes to a spectrum from very unstable to very stable transcripts. The genes expressed at 1 (a), 3 (b), 24 (c), and 72 (d) hours of TNF stimulation were plotted based on their expression levels and the mRNA stability states. Shades of blue represent the region of unstable genes, and shades of red represent the zone of stable genes.
Fig 6
Fig 6. Genome-wide association of the gene expression levels with the mRNA stability states in rheumatoid arthritis (RA) fibroblast-like synoviocytes (FLS).
(a), Table of the top 10% of highly expressed genes at 1, 3, 24 and 72 hours of TNF stimulation grouped by their mRNA stability status. The number of genes included in each stability group is presented. (b), Table of the highly expressed genes with very unstable mRNAs. Their ranking by level of expression is presented in parentheses. (c), Kinetics of expression and TNF-induced dynamics of mRNA stability for IL-6, IL-8 and CCL2. Shades of blue represent unstable status and shades of red represent stable status.
Fig 7
Fig 7. TNF induces a temporal switch from an early program dominated by unstable transcripts to a late program with expansion of the pool of stable transcripts.
(a-b), Density-plots illustrating the distribution of TNF-inducible genes (≥2-fold by TNF at 1 (a) and 72h (b)) based on their mRNA stability (shades of red represent areas with the highest numbers of genes (highest density)). The mRNA stability was calculated genome-wide in 2 biologic replicates as the ratio of RPKM levels at the TNF+Act D condition divided to the RPKM levels at the TNF condition. This ratio ranges from 0 (very unstable transcripts) to 1 (very stable transcripts). (c), RA FLS were stimulated with a single dose of TNF (10 ng/ml) for 72 hours and then Act D (10 μg/ml) was added for 1 hour. Subsequently cells were washed and fresh serum-free medium + Act D was replenished. Supernatants were collected 6 hours later and the protein levels of IL-6, CXCL1, CCL2, IL-8, RANTES and IP-10 were measured by magnetic bead-based multiplex immunoassay. Values are the mean ±SEM of three independent experiments. P values were calculated by one-way ANOVA and Tukey post-test analysis (* = p<0.05, ** = p<0.01, and *** = p<0.001).
Fig 8
Fig 8. Association of expression kinetics with mRNA stability states of TNF-inducible genes in RA FLS.
For (a-b), two biological replicates of RA FLS (derived from two different RA patients) were exposed to a single dose of TNF (10 ng/ml) for 1-72h. Subsequently, Act D (10 μg/ml) was added for 3h and gene expression was measured by RNA sequencing. 386 genes were identified as highly induced (≥5-fold) by TNF at any time point and were clustered into 6 clusters with distinct kinetics of peak expression. (a), Heatmap illustrating the expression kinetics of the 6 clusters (red represents the maximum and blue the minimum expression level across the lane). (b), Stacked bar graphs illustrating the stability states of genes for Cluster 1, Clusters 2 &3, Cluster 4, and Clusters 5 & 6. For (c-f), RA FLS were exposed to a single dose of TNF (10 ng/ml) for 1–72 hours. Primers specific for the eighth intronic region of MMP3 and for the first intronic region of CCL5 were designed to capture primary transcripts (PT) of MMP3 and CCL5. qPCR was used to measure the levels of PT and total mRNA of MMP3 (c-d) and CCL5 (e-f). Cumulative results from six independent experiments are shown. Values were normalized relative to mRNA for GAPDH and are presented as mean ±SEM.

Similar articles

Cited by

References

    1. McInnes IB, Schett G (2011) The pathogenesis of rheumatoid arthritis. N Engl J Med 365: 2205–2219. doi: 10.1056/NEJMra1004965 - DOI - PubMed
    1. Noss EH, Brenner MB (2008) The role and therapeutic implications of fibroblast-like synoviocytes in inflammation and cartilage erosion in rheumatoid arthritis. Immunol Rev 223: 252–270. doi: 10.1111/j.1600-065X.2008.00648.x - DOI - PubMed
    1. Kalliolias GD, Ivashkiv LB (2016) TNF biology, pathogenic mechanisms and emerging therapeutic strategies. Nat Rev Rheumatol 12: 49–62. doi: 10.1038/nrrheum.2015.169 - DOI - PMC - PubMed
    1. Bottini N, Firestein GS (2013) Duality of fibroblast-like synoviocytes in RA: passive responders and imprinted aggressors. Nat Rev Rheumatol 9: 24–33. doi: 10.1038/nrrheum.2012.190 - DOI - PMC - PubMed
    1. Neumann E, Lefevre S, Zimmermann B, Gay S, Muller-Ladner U (2010) Rheumatoid arthritis progression mediated by activated synovial fibroblasts. Trends Mol Med 16: 458–468. doi: 10.1016/j.molmed.2010.07.004 - DOI - PubMed

MeSH terms