. 2017 Jul 27;547(7664):453-457.
doi: 10.1038/nature23007. Epub 2017 Jul 5.

Dependency of a therapy-resistant state of cancer cells on a lipid peroxidase pathway

Affiliations

Dependency of a therapy-resistant state of cancer cells on a lipid peroxidase pathway

Vasanthi S Viswanathan et al. Nature. .

Abstract

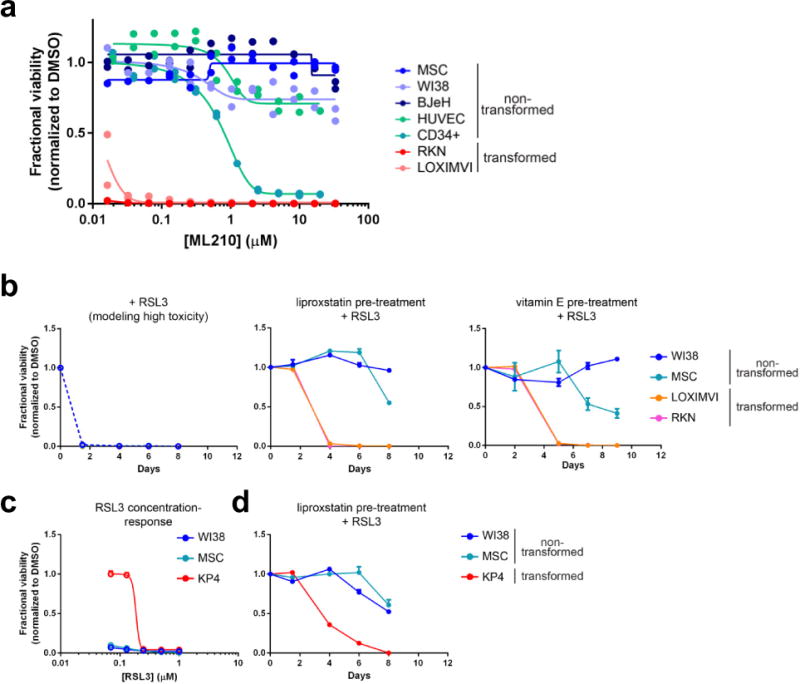
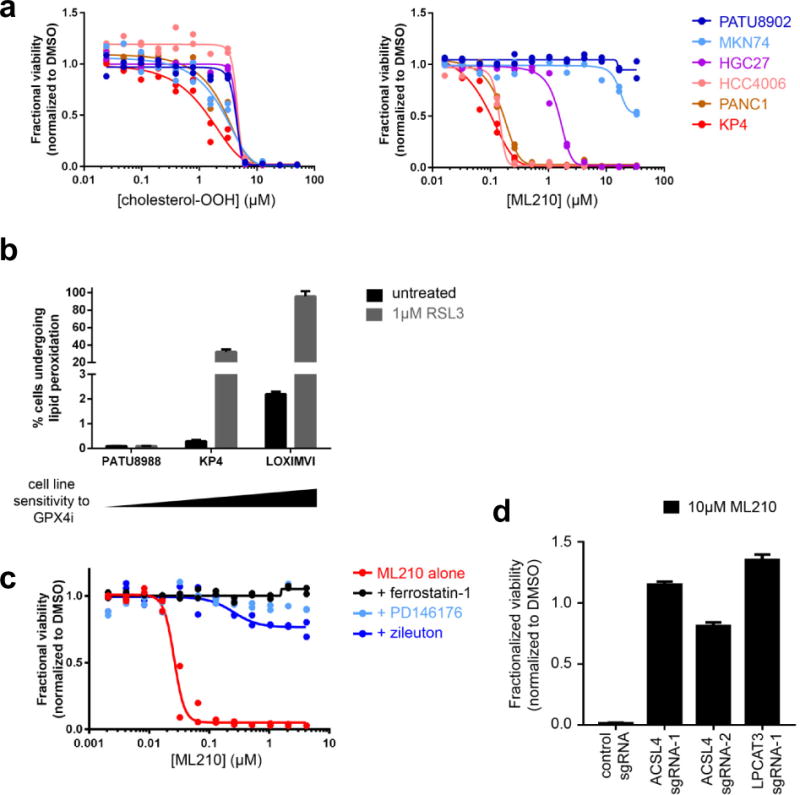
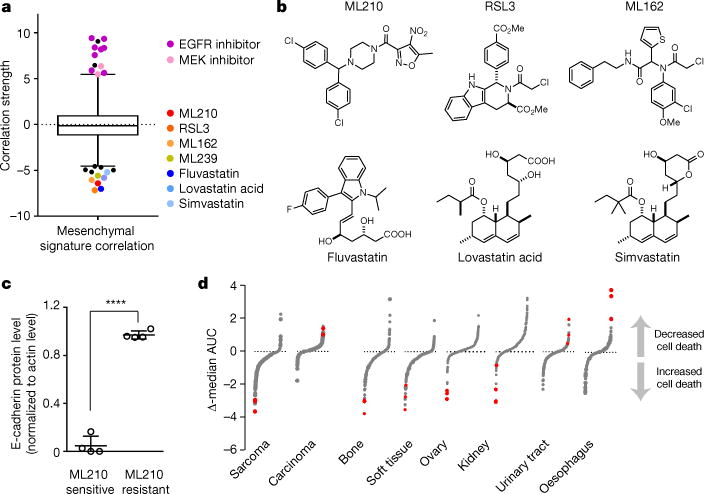
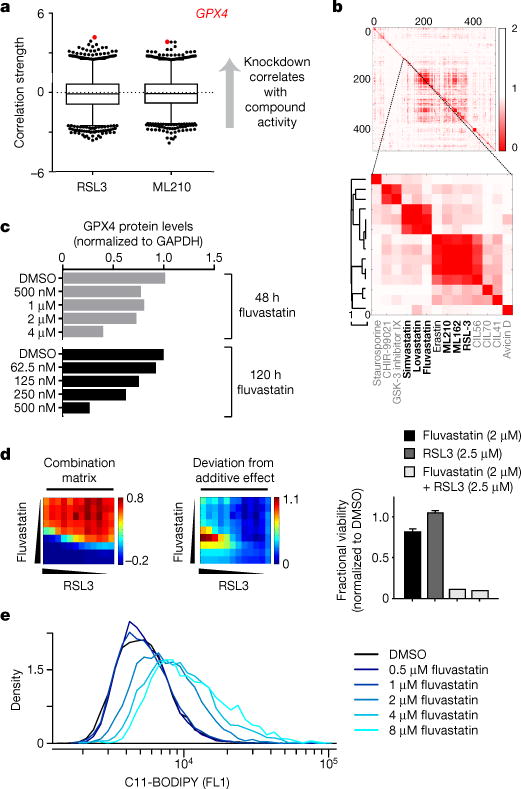
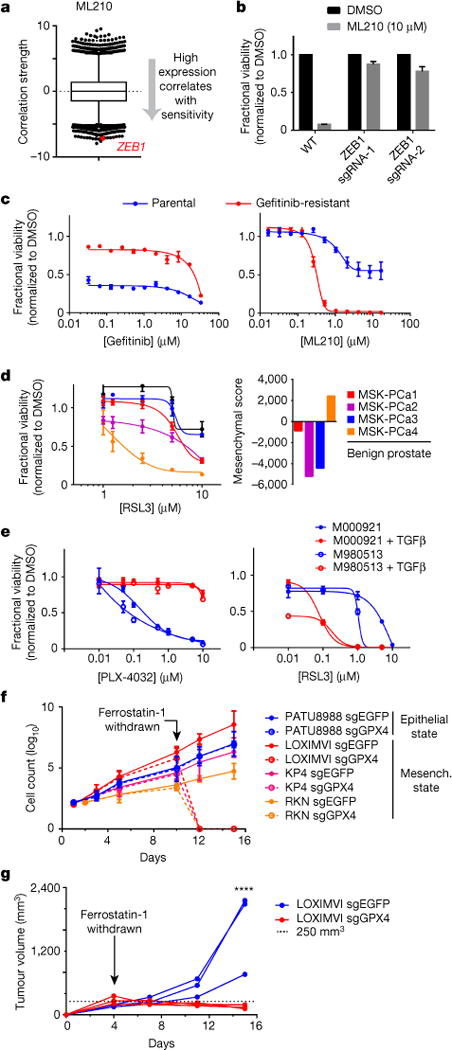
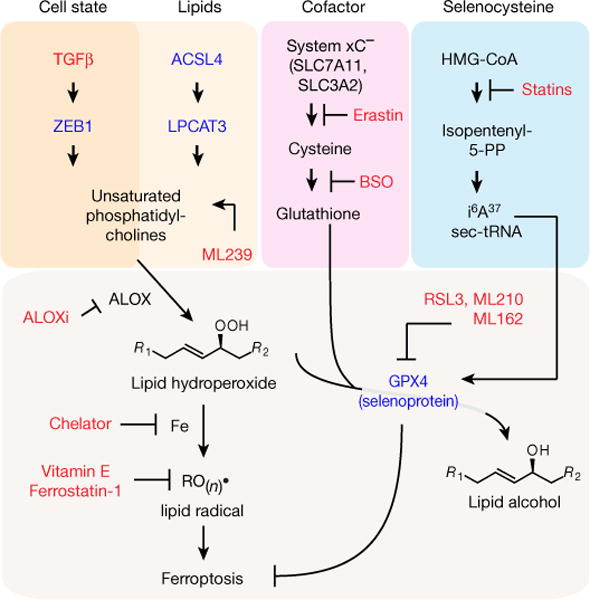
Plasticity of the cell state has been proposed to drive resistance to multiple classes of cancer therapies, thereby limiting their effectiveness. A high-mesenchymal cell state observed in human tumours and cancer cell lines has been associated with resistance to multiple treatment modalities across diverse cancer lineages, but the mechanistic underpinning for this state has remained incompletely understood. Here we molecularly characterize this therapy-resistant high-mesenchymal cell state in human cancer cell lines and organoids and show that it depends on a druggable lipid-peroxidase pathway that protects against ferroptosis, a non-apoptotic form of cell death induced by the build-up of toxic lipid peroxides. We show that this cell state is characterized by activity of enzymes that promote the synthesis of polyunsaturated lipids. These lipids are the substrates for lipid peroxidation by lipoxygenase enzymes. This lipid metabolism creates a dependency on pathways converging on the phospholipid glutathione peroxidase (GPX4), a selenocysteine-containing enzyme that dissipates lipid peroxides and thereby prevents the iron-mediated reactions of peroxides that induce ferroptotic cell death. Dependency on GPX4 was found to exist across diverse therapy-resistant states characterized by high expression of ZEB1, including epithelial-mesenchymal transition in epithelial-derived carcinomas, TGFβ-mediated therapy-resistance in melanoma, treatment-induced neuroendocrine transdifferentiation in prostate cancer, and sarcomas, which are fixed in a mesenchymal state owing to their cells of origin. We identify vulnerability to ferroptic cell death induced by inhibition of a lipid peroxidase pathway as a feature of therapy-resistant cancer cells across diverse mesenchymal cell-state contexts.


Conflict of interest statement

The authors declare no competing financial interests. Readers are welcome to comment on the online version of the paper.

Figures

Extended Data Figure 1
Extended Data Figure 1. Correlation of E-cadherin and vimentin protein levels of cell lines with sensitivity to mesenchymal statetargeting compounds
a, b, Pancreatic and gastric cancer cell lines with low E-cadherin protein levels have high levels of vimentin (a) and are preferentially sensitive to ML210, a mesenchymal state-targeting compound (b). Concentration-response curves are from CTRP c, d, Two patient-derived pancreatic cancer cell lines with differing sensitivity to erlotinib (d), show GPX4-inhibitor sensitivity and levels of epithelial and mesenchymal protein markers correlating in the predicted direction with erlotinib sensitivity. Data plotted in c and d are mean ± s.d. of four technical replicates and are representative of two biological replicates.
Extended Data Figure 2
Extended Data Figure 2. Lineage-specific AUC-mesenchymal score correlations
Scatter plots with linear regression line (red) show the relationship between cancer cell-line mesenchymal score and cell-line sensitivity to ML210 (a ferroptosis-inducing, mesenchymal state-targeting compound) within different epithelium-derived cancer lineages. Gastrointestinal cancer lineages showing stronger correlations are demarcated with dashed boxes.
Extended Data Figure 3
Extended Data Figure 3. Correlation of individual cell-line features with mesenchymal state-targeting compounds
a, Box-and-whisker plot shows the coefficient of correlation between the cytotoxic effects of the GPX4 inhibitor RSL3 and cytotoxic effects of 481 other compounds (black dots; inducers of electrophilic stress in shades of orange) across 656 cancer cell lines (excludes suspension cell lines). Plotted values are absolute correlation coefficients z scored using Fisher’s z transformation to account for individual compounds having been exposed to different numbers of cell lines; line, median; box, 25th–75th percentile; whiskers, expansion of the 2.5th and 97.5th percentile outlier compounds (black and coloured dots); dotted line marks 0.0. Data for compounds indicated to the right of the plot are significant with a P value of less than 0.005. b, c, Box-and-whisker plots show the extent of correlation between baseline expression of gene-expression transcripts (b) or sensitivity to gene knockdown (c) and cytotoxic effects of compounds with strong (RSL3, ML210), intermediate (erastin) and weak (piperlongumine) mesenchymal state-targeting properties despite otherwise sharing similar cell death-inducing profiles (shown in a). Plotted values in b and c are z scored Pearson’s correlation coefficients (see Methods); line, median; box, 25th-75th percentile; whiskers, expansion of 1st and 99th percentile outlier correlates; dotted line marks 0.0. Data highlighted with coloured dots are significant with a P value of less than 0.0002. Plots in b are derived from 610–631 cancer cell lines (excludes non-adherent cell lines). SLC7A11 (red dots) and SLC3A2 (orange dots) are shared gene-expression outlier correlates among the shown electrophilic stress-inducing compounds. Plots in c are derived from 132–136 cancer cell lines (excluding haematopoietic cell lines). Sensitivity to GPX4 knockdown (red dots) is uniquely correlated with sensitivity to mesenchymal state-targeting electrophilic compounds.
Extended Data Figure 4
Extended Data Figure 4. Effect of RSL3, ML162 and ML210 on GPX4 activity in cellular lysates
Treatment of cells with RSL3, ML162 or ML210 inhibits the ability of cellular lysates to reduce exogenous phosphatidylcholine hydroperoxide (m/z of 790.6). Data reflect the results of single biological experiment.
Extended Data Figure 5
Extended Data Figure 5. Modulation of statins by mevalonate pathway intermediates and antioxidants
a, b, The effect of statins on HT-1080 fibrosarcoma-derived cells is rescued by co-treatment with mevalonic acid (a), but not by co-treatment with a lipophilic antioxidant (b). Data for two technical replicates are plotted; data represent two separate biological experiments.
Extended Data Figure 6
Extended Data Figure 6. Relative GPX4 inhibitor sensitivity of cell lines modelling EMT driven by inducible expression of EMT transcription factors
a, Engineered MCF-7 breast cancer cells induced with a small molecule (4-hydroxytamoxifen; 4-OHT) to express high levels of SNAIL1 and undergo EMT (red curve). b, Engineered H358 lung cancer cells induced with 4-OHT to express high levels of TWIST1 and undergo EMT (red curve). Data plotted are mean ± s.d. of four technical replicates and are representative of two biological replicates.
Extended Data Figure 7
Extended Data Figure 7. Protein-level validation of successful gene knockout in CRISPR-Cas9-engineered cells
a, GPX4 protein levels in GPX4-wild-type (WT) and GPX4-knockout (k/o) clones generated using CRISPR-Cas9 technology. b, ZEB1 protein levels in KP4 pancreatic cancer cells exposed to ZEB1-targeting CRISPR-Cas9 technology.
Extended Data Figure 8
Extended Data Figure 8. Relative compound sensitivity of epithelial versus mesenchymal state cancer models
a, HCC4006 lung cancer cells that have undergone EMT as a mechanism of resistance to gefitinib (red curve). Erastin and buthionine sulfoximine (BSO) are ferroptosis inducers, while piperlongumine is an electrophile that induces a non-ferroptotic form of oxidative cell death. b, Mesenchymal state patient-derived pancreatic cancer cells (AA01) undergo ferroptosis in response to GPX4 inhibition as evidenced by the ability of ferrostatin-1 to rescue loss of viability due to GPX4 inhibition. c, Patient-derived prostate cancer organoid lines show sensitivity to a GPX4 inhibitor (RSL3) in a manner correlated with mesenchymal gene-expression score (Fig. 3d), in both collagen-based and Matrigel-based culture conditions. This correlation with mesenchymal score is not seen for a control lethal agent (5-fluorouracil). d, Scatter plot with linear regression line (red) showing the correlation between a melanoma-specific high mesenchymal state score and sensitivity to a GPX4 inhibitor (ML210) across 49 melanoma-derived cell lines from CTRP Data plotted in a–c are mean ± s.d. of four technical replicates (a and b) and three technical replicates (c) and are representative of two biological replicates.
Extended Data Figure 9
Extended Data Figure 9. Effect of lipophilic antioxidants on rescuing GPX4 inhibitor-mediated cell death in transformed versus non-transformed high-mesenchymal state cells
a, Relative sensitivity of transformed and non-transformed high-mesenchymal state cell lines to GPX4 inhibition. Data for two technical replicates are plotted and represent two separate biological experiments. Concentration-response curves collected over a period of several months are plotted on a single set of axes to aid comparison of cell-line sensitivities. BJeH, foreskin fibroblasts; CD34+ cells, haematopoietic progenitor cells; HUVEC, human umbilical vein endothelial cells; LOXIMVI, melanoma-derived cells; MSC, mesenchymal stem cells; RKN, leiomyosarcoma-derived cells; WI38, lung fibroblasts. b, A single pre-treatment of cells with a lipophilic antioxidant (liproxstatin-1 or vitamin E) protects non-transformed mesenchymal state cells for a longer period of time than transformed high-mesenchymal state cells, from prolonged treatment with a high concentration of a GPX4 inhibitor (RSL3). c, d, Transformed high-mesenchymal state cells that are less sensitive to GPX4 inhibition (KP4) than non-transformed mesenchymal state cells (WI38, MSC) can be killed preferentially by pretreating cells with a lipophilic antioxidant before initiating treatment with a GPX4 inhibitor. Data plotted in b–d are mean ± s.d. of four technical replicates and are representative of two biological replicates.
Extended Data Figure 10
Extended Data Figure 10. Relationship of GPX4 dependence and modulation of cellular lipid peroxides
a, Cell-line sensitivity to exogenous lipid peroxides (for example, cholesterol peroxide) does not correlate with differential cell-line sensitivity to a GPX4 inhibitor (ML210). b, Cell-line sensitivity to GPX4 inhibition correlates positively with induction of lipid peroxidation upon GPX4 inhibition (GPX4i). c, d, Small-molecule inhibitors of arachidonic acid lipoxygenases (PD146176, zileuton) (c) and genetic knockout of two upstream regulators of arachidonic acid metabolism (ACSL4, LPCAT3) (d) prevent cell death induced by a GPX4 inhibitor (ML210) in KP4 cells. Data in a and c are two technical replicates whereas data in b and d are mean ± s.d. of three technical replicates. All panels represent two separate biological experiments.
Figure 1
Figure 1. Gene-signature, proteomic and lineage-based correlation analyses identify mesenchymal state-targeting compounds
a, Box-and-whisker plots show the extent of correlation between cytotoxic effects of each compound (black and coloured dots) and cell-line mesenchymal score (516 carcinoma cell lines). Plotted values are z scored Pearson’s correlation coefficients (see Methods); line, median; box, 25th–75th percentile; whiskers, 2.5th and 97.5th percentile expansion; dotted line marks 0.0; P < 0.005. b, Structures of mesenchymal statetargeting compounds. c, Column scatterplot with mean ± s.d. showing the relationship between cell-line levels of E-cadherin protein and sensitivity to a mesenchymal state-targeting compound (ML210) across a panel of pancreatic and gastric cancer-derived cell lines (P < 0.0001). d, Relative activity of each of 481 compounds in the indicated lineage (see Methods). Ferroptosisinducing subset of mesenchymal state-correlated compounds (red dots) are preferentially active in sarcoma (mesenchymal-derived) compared to carcinoma (epithelial-derived), as well as among cancer cell lines derived from individual mesenchymal-origin versus epithelial lineages.
Figure 2
Figure 2. Mesenchymal state-targeting compounds act on a lipidperoxidase pathway converging on GPX4
a, Box-and-whisker plots show the extent of correlation between the indicated compound’s cytotoxic effects and sensitivity to knockdown of genes (black dots) across 136 (RSL3) and 132 (ML210) cancer cell lines (excluding haematopoietic cell lines). Plotted values are z scored Pearson’s correlation coefficients (see Methods), line, median; box, 25th–75th percentile; whiskers, 1st and 99th percentile expansions; dotted line marks 0.0; P < 0.0002 for coloured dots. b, Hierarchical clustering of a pairwise similarity matrix for 481 compounds, where each matrix element represents the strength of correlation between the sensitivity patterns of two compounds in up to 664 cell lines. Black compounds are those that fall into the two clusters of interest. The grey compounds fall outside these two clusters. c–e, Fluvastatin treatment of HT-1080 cells decreases GPX4 protein levels in a time-and concentration-dependent manner (c) synergizes with a direct GPX4 inhibitor (RSL3) (d) and leads to accumulation of lipid hydroperoxides (e). Bar graphs for fluvastatin + RSL3 in d are two technical replicates (fractional viability normalized to DMSO); other bar graphs shown mean ± s.d. of four technical replicates. Data in c–e are representative of two independent biological experiments.
Figure 3
Figure 3. Validation of dependency of therapy-resistance-associated high-mesenchymal state cancer cells on GPX4
a, High baseline ZEB1 transcripts levels (red dot) are strongly correlated with sensitivity to a GPX4 inhibitor (ML210) across 610 cancer cell lines (excludes nonadherent cell lines). Plotted values are z scored Pearson’s correlation coefficients (see Methods); line, median; box, 25th–75th percentile; whiskers, 1st and 99th percentile expansion; dotted line marks 0.0. b, Knockout of ZEB1 prevents cell death induced by GPX4 inhibition in KP4 high-mesenchymal state pancreatic cancer cells. c, HCC4006 lung cancer cells that have acquired a high-mesenchymal state concomitant with becoming resistant to gefitinib (red curve) exhibit increased sensitivity to GPX4 inhibition. d, A patient-derived prostate cancer organoid exhibiting high mesenchymal and ZEB1 gene expression related to therapy-induced neuroendocrine transition (MSK-PCa4) is selectively sensitive to GPX4 inhibition (three technical replicates representative of two separate experiments). e, Patient-derived melanoma lines induced into a therapy-resistant mesenchymal state with TGFβ treatment acquire resistance to BRAF inhibition and sensitivity to GPX4 inhibition. f, In vitro growth curves of GPX4 wild-type (sgEGFP) and GPX4 knockout (sgGPX4) cancer cells in the presence or absence of a lipophilic antioxidant (ferrostatin-1). g, In vivo growth of GPX4-wild-type (sgEGFP; blue curves) and GPX4-knockout (sgGPX4; red curves) melanoma xenografts in mice dosed with ferrostatin-1 and upon cessation of dosing with ferrostatin-1. Individual curves represent individual mice with one xenograft each. ****P < 0.0001 at day 15. Data reflect a single cohort experiment. Data plotted in b–f are mean ± s.d. of three (b, d–f) or four (c) technical replicates and are representative of two separate biological experiments.
Figure 4
Figure 4. Schematic of a pathway that characterizes a therapy-resistant mesenchymal cancer cell state and its dependency on lipid peroxide dissipation
This pathway centres on the ZEB1-dependent synthesis, storage and use of long-chain PUFAs, which are susceptible to becoming reactive lipid peroxides through the action of lipoxygenase enzymes. GPX4 dissipates these reactive peroxides and prevents their downstream iron-dependent reactions that ultimately result in ferroptotic cell death. Red text denotes chemical perturbations used to probe and uncover this circuitry; blue text denotes genetic perturbations that have been carried out. ACSL4, acyl-CoA synthetase long-chain family member 4; ALOX, arachidonate lipoxygenase; ALOXi, ALOX inhibitor; BSO, buthionine sulfoximine; GPX4, glutathione peroxidase 4; LPCAT3, lysophosphatidylcholine acyltransferase 3; sec-tRNA, selenocyteine tRNA; TGFβ, transforming growth factor-β; ZEB1, zinc finger E-box binding homeobox 1.

Comment in

  • Therapeutic resistance: Ironing it out.
    Harjes U. Harjes U. Nat Rev Cancer. 2017 Sep;17(9):510. doi: 10.1038/nrc.2017.71. Epub 2017 Aug 11. Nat Rev Cancer. 2017. PMID: 28798485 No abstract available.
  • Cancer: Ironing it out.
    Harjes U. Harjes U. Nat Rev Drug Discov. 2017 Sep 1;16(9):602. doi: 10.1038/nrd.2017.168. Nat Rev Drug Discov. 2017. PMID: 28860580 No abstract available.

Similar articles

Cited by

References

    1. Hoek KS, et al. In vivo switching of human melanoma cells between proliferative and invasive states. Cancer Res. 2008;68:650–656. - PubMed
    1. Tirosh I, et al. Dissecting the multicellular ecosystem of metastatic melanoma by single-cell RNA-seq. Science. 2016;352:189–196. - PMC - PubMed
    1. Bu X, Mahoney KM, Freeman GJ. Learning from PD-1 resistance: new combination strategies. Trends Mol Med. 2016;22:448–451. - PMC - PubMed
    1. Shaffer SM, et al. Rare cell variability and drug-induced reprogramming as a mode of cancer drug resistance. Nature. 2017;546:431–435. - PMC - PubMed
    1. Gröger CJ, Grubinger M, Waldhör T, Vierlinger K, Mikulits W. Metaanalysis of gene expression signatures defining the epithelial to mesenchymal transition during cancer progression. PLoS ONE. 2012;7:e51136. - PMC - PubMed

Publication types

MeSH terms