. 2017 Aug 15;595(16):5525-5544.
doi: 10.1113/JP274659. Epub 2017 Jul 20.

Functional expression of calcium-permeable canonical transient receptor potential 4-containing channels promotes migration of medulloblastoma cells

Affiliations

Functional expression of calcium-permeable canonical transient receptor potential 4-containing channels promotes migration of medulloblastoma cells

Wei-Chun Wei et al. J Physiol. .

Abstract

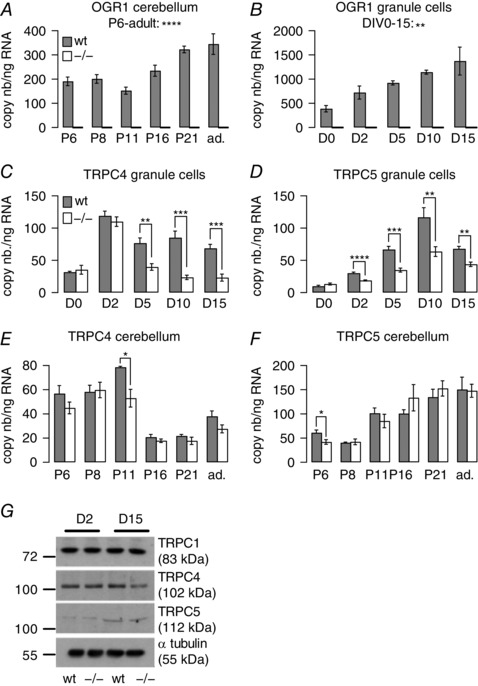
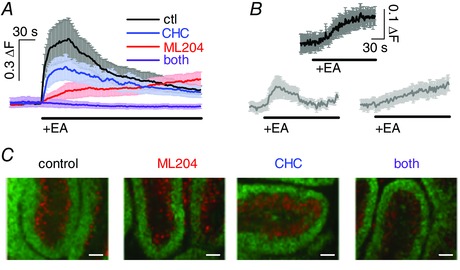
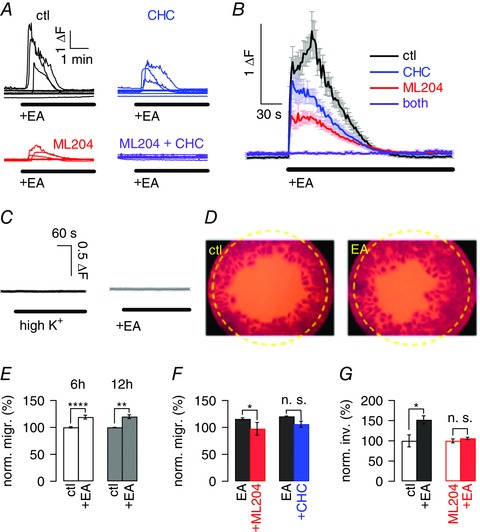
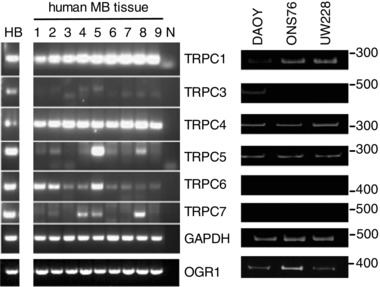
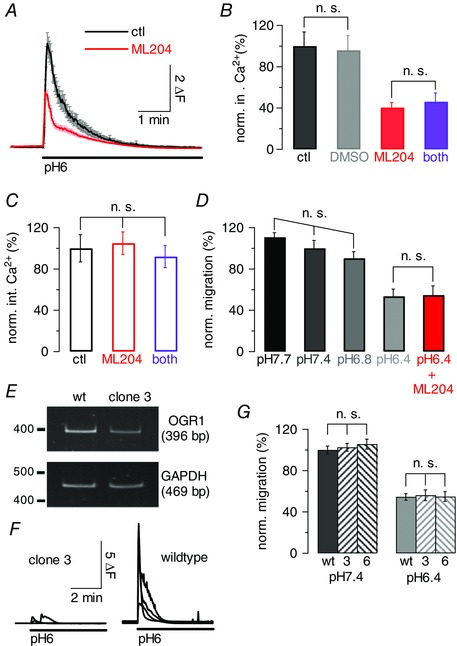
Key points: The proton sensing ovarian cancer G protein coupled receptor 1 (OGR1, aka GPR68) promotes expression of the canonical transient receptor potential channel subunit TRPC4 in normal and transformed cerebellar granule precursor (DAOY) cells. OGR1 and TRPC4 are prominently expressed in healthy cerebellar tissue throughout postnatal development and in primary cerebellar medulloblastoma tissues. Activation of TRPC4-containing channels in DAOY cells, but not non-transformed granule precursor cells, results in prominent increases in [Ca2+ ]i and promotes cell motility in wound healing and transwell migration assays. Medulloblastoma cells not arising from granule precursor cells show neither prominent rises in [Ca2+ ]i nor enhanced motility in response to TRPC4 activation unless they overexpressTRPC4. Our results suggest that OGR1 enhances expression of TRPC4-containing channels that contribute to enhanced invasion and metastasis of granule precursor-derived human medulloblastoma.

Abstract: Aberrant intracellular Ca2+ signalling contributes to the formation and progression of a range of distinct pathologies including cancers. Rises in intracellular Ca2+ concentration occur in response to Ca2+ influx through plasma membrane channels and Ca2+ release from intracellular Ca2+ stores, which can be mobilized in response to activation of cell surface receptors. Ovarian cancer G protein coupled receptor 1 (OGR1, aka GPR68) is a proton-sensing Gq -coupled receptor that is most highly expressed in cerebellum. Medulloblastoma (MB) is the most common paediatric brain tumour that arises from cerebellar precursor cells. We found that nine distinct human MB samples all expressed OGR1. In both normal granule cells and the transformed human cerebellar granule cell line DAOY, OGR1 promoted expression of the proton-potentiated member of the canonical transient receptor potential (TRPC) channel family, TRPC4. Consistent with a role for TRPC4 in MB, we found that all MB samples also expressed TRPC4. In DAOY cells, activation of TRPC4-containing channels resulted in large Ca2+ influx and enhanced migration, while in normal cerebellar granule (precursor) cells and MB cells not derived from granule precursors, only small levels of Ca2+ influx and no enhanced migration were observed. Our results suggest that OGR1-dependent increases in TRPC4 expression may favour formation of highly Ca2+ -permeable TRPC4-containing channels that promote transformed granule cell migration. Increased motility of cancer cells is a prerequisite for cancer invasion and metastasis, and our findings may point towards a key role for TRPC4 in progression of certain types of MB.

Keywords: OGR1; TRPC4; Transient Receptor Potential Channels; cerebellum; medulloblastoma; proton sensing G protein coupled receptors.


Figures

Figure 1
Figure 1. Impact of OGR1 knockout on TRPC4 and 5 expression levels in whole cerebellum and cerebellar granule cells
A, bars reflect average OGR1 copy numbers (nb) ± SEM in RNA isolated from whole cerebellum from wild‐type (wt; grey) and Ogr1−/− (white) mice at postnatal days (P)6, 8, 11, 21 and adult (ad.). B, bars reflect average OGR1 copy numbers ± SEM in RNA isolated from granule cell cultures derived from wild‐type and Ogr1−/− animals at days in vitro (D)0, 2, 5, 10 and 15. C–F, bars reflect average copy numbers ± SEM of either TRPC4 (C and E) or TRPC5 (D and F) per nanogram RNA isolated from either granule cell cultures (C and D) or whole cerebellum (E and F) in wild‐type (wt; grey) and Ogr1−/− (white) tissues as a function of days in vitro (C and D) and postnatal age (E and F). G, representative Western blot depicting protein levels for TRPC1, 4, 5 and α‐tubulin (internal control) for wild‐type and Ogr1−/−‐derived granule cells at DIV2 and 15. Two‐tailed ANOVA was used to establish statistical significance over the time period indicated for A and B. For C–F, Student's unpaired t test was used to assess statistical significance between wild‐type and Ogr1−/− tissues; n = 4 qPCR repeats for wild‐type and 6 for Ogr1−/−‐derived RNA.
Figure 2
Figure 2. Impact of TRPC4/5 activation on normal granule cells
A, graph showing average fluorescence signal (±SEM) in primary granule cells (DIV1/2) in response to application of 10 μm (−)englerin A (EA) under control (ctl) conditions (black), in the presence of 10 μm CHC (blue), ML204 (red), or both (purple); n = 17–88 granule cells . ΔF, fluorescence ratio (see Methods). B, fluorescence signals in response to application of 10 μm (−)EA in granule cells migrating through the molecular layer (top; n = 4), and resident in the internal granule cell layer (bottom) in acute sagittal cerebellar slices; responses were separated by response kinetics into fast (left; n = 9) and slow responders (right; n = 6). C, organotypic cerebellar slices after 14 days of culturing under control conditions (culture medium only), and in the presence of 10 μm ML204, 10 μm CHC, or both. Antibodies against NeuN label postmitotic granule cells (green); antibodies against calbindin label Purkinje cells (red). Scale bars are 0.1 mm.
Figure 3
Figure 3. Impact of activation of TRPC4/5‐containing channels by (−)EA on transformed granule cells
A, raw data showing 8 representative fluorescence traces in DAOY cells in response to application of 10 μm (−)EA application under control conditions (ctl; black), in the presence of 10 μm of CHC (blue), ML204 (red), or both inhibitors (purple). ΔF, fluorescence ratio (see Methods). B, average fluorescence traces (±SEM) obtained in DAOY cells exposed to (−)EA under the experimental conditions described for A; results include cells shown in A. C, left panel, average fluorescence signal (±SEM) in response to increasing extracellular K+ concentration to 12.5 mm; n = 38 DAOY cells. Right panel, average fluorescence signal (±SEM) in response to (−)EA application in the absence of extracellular Ca2+; n = 21 DAOY cells. Scale bar is the same for both panels. D, raw data showing representative migration assays; left panel shows migration under control (ctl) conditions, right panel in the presence of 10 μm (−)EA. Yellow circle indicates area for which migration was analysed. E, bars show average normalized (norm.) migration (migr.) (±SEM) of DAOY cells under control (ctl) conditions and in the presence of 10 μm (−)EA after 6 h (white) and 12 h (grey). Migration was normalized to average migration under control conditions for 6 or 12 h; n = 11 migration assays for 6 h and 3 for 12 h. F, bars show average migration (± SEM) of DAOY cells in the presence of 10 μm (−)EA (black), and in the additional presence of 10 μm ML204 (red), or 10 μm CHC (blue). Migration was normalized to average migration levels in the presence of (−)EA only; n = 4–5 migration assays. G, bars depicting average transwell migration as normalized invasion (norm. inv.) (±SEM) of DAOY cells under control conditions (open black) and in the presence of 10 μm (−)EA (filled black), as well as under conditions of TRPC4 block using 10 μm ML204 alone (open red) or together with 10 μm (−)EA (filled red).
Figure 4
Figure 4. Genetic evidence for a critical role of TRPC4 in transformed granule cell migration
A, representative Western blot showing extent of TRPC4 knock‐down in shTRPC4‐transfected DAOY cells (shT4) compared with non‐transfected wild‐type (wt) and shScramble‐transfected (shS) DAOY cells using a selective TRPC4 antibody. Tubulin was used as an internal control. B, graphs showing average (±SEM) fluorescence responses to 10 μm (−)EA under control conditions (left), and in the presence of 10 μm ML204 (top right) or CHC (bottom right). Black, red and blue traces depict averages obtained in non‐transfected DAOY cells, grey, light red and light blue traces depict averages obtained in shTRPC4‐transfected cells; n = 38‐41 cells. ΔF, fluorescence ratio (see Methods). C, bars showing mean normalized migration (norm. migr.) (±SEM) of DAOY cells in the presence of pluronic acid and DMSO (see Methods) in wild‐type, shScramble (shScr)‐ and shTRPC4 (shT4)‐transfected cells under control (ctl) conditions and in the presence of 10 μm (−)EA. Migration was normalized to mean migration levels of non‐transfected DAOY cells under control conditions; n = 3 repeats per condition. D, gel showing RT‐PCR results for cDNA generated from wild‐type DAOY cells and DAOY cell clone 6 using primers specific for human TRPC4 and GAPDH (internal control). E, graphs showing representative fluorescence responses to 10 μm (−)EA application in DAOY clone 6 (top two panels, grey) and in wild‐type DAOY cells (bottom two panels, black). Top scale bar applies to top panels, bottom scale bar applies to bottom panels. F, bars showing mean normalized migration (±SEM) of wild‐type DAOY (left bars) and DAOY clone 6 cells (right bars) under control conditions, in the presence of pluronic acid (PA) and in the presence of 10 μm (−)EA.
Figure 5
Figure 5. TRPC and OGR1 expression in human MB tissues and human MB cell lines
RT‐PCR results using primers specific for human TRPC1, 3, 4, 5, 6 and 7 as well as human OGR1 (bottom band), using cDNA generated with RNA isolated from 9 distinct human MB tissues (see Table 1 for classification) and the human MB cell lines DAOY, UW228‐1 and ONS76. cDNA generated from healthy human brain [HB; AMS Biotechnology (Abingdon, UK) Ltd] served as positive control; N denotes negative control. GAPDH was used as internal PCR control.
Figure 6
Figure 6. Effects of (−)EA on the MB cell lines UW228 and ONS76
A, representative fluorescence traces depicting changes in intracellular Ca2+ concentration in UW228‐1 cells upon application of 10 μm (−)EA. Scale bar applies to all traces; ΔF, fluorescence ratio (see Methods). B, bars depicting mean normalized migration (norm. migr.) under control (ctl) conditions, in the presence of 10 μm (−)EA (black), and in the additional presence of 10 μm ML204 (red), CHC (blue), or both (purple); n = 3 repeats. Migration was normalized to mean migration under control conditions. C and D, as A and B, respectively, but using ONS76 cells. Upper scale bar applies to upper panels, lower scale bar to lower panels. E, gel depicting RT‐PCR result using primers specific for human TRPC4 and GAPDH (internal control) and cDNA generated from wild‐type (wt), empty vector‐transfected (vect) and human TRPC4β‐transfected ONS76 cells. F, representative fluorescence traces depicting changes in intracellular Ca2+ concentration in ONS76 cells transfected with human TRPC4β upon application of 10 μm (−)EA. Scale bar applies to all traces. G, bars representing normalized migration of non‐transfected (wt), empty vector‐transfected (vect) and human TRPC4β‐transfected ONS76 cells under control conditions, in the presence of pluronic acid (PA), and in the presence of 10 μm (−)EA (red); n = 3 repeats per condition.
Figure 7
Figure 7. Activation of OGR1 results in opening of TRPC4‐containing channels but does not promote migration of DAOY cells
A, graph showing average fluorescence signal (±SEM) in DAOY cells in response to a drop in extracellular pH from pH 7.35 to pH 6 to activate OGR1 under control conditions (black) and in the presence of 10 μm ML204; ΔF, fluorescence ratio (see Methods). B, normalized (norm.) average fluorescence integrals (int.) (±SEM), in response to drop in extracellular pH as for A under control conditions (black), in the presence of 0.2% DMSO, or 10 μm ML204 (red), or 10 μm ML204 + 10 μm CHC (purple). Integrals were normalized to average fluorescence integrals under control conditions; same cells as in A for control and ML204 results. Only non‐significant (n.s.) differences are indicated. C, as B, but experiments carried out in the absence of extracellular Ca2+, to control for impact of ML204 and CHC on Ca2+ release from stores. D, bar graph showing mean normalized migration (±SEM) of DAOY cells under increasingly acidic extracellular pH conditions; last bar (red) reflects exposure of cells to pH 6.4 and 10 μm ML204. Migration was normalized to mean migration levels at pH 7.4; 3 repeats per condition. Only non‐significant differences are indicated. E, gel showing RT‐PCR results for cDNA generated from wild‐type DAOY and DAOY clone 3 cells using primers specific for human OGR and GAPDH (internal control). F, each panel shows 4 representative fluorescence traces obtained from wild‐type DAOY (right) and DAOY clone 3 (left) in response to a drop in extracellular pH from pH 7.35 to pH 6; experiments were performed in the absence of extracellular Ca2+ to monitor OGR1 activation only. Scale bar applies to both panels. G, bars reflecting average normalized migration of wild‐type (wt) DAOY, DAOY clone 3 (3) and DAOY clone 6 (6) cells at extracellular pH 7.4 (left bars) and pH 6.4 (right bars); 3 repeats per condition. Only non‐significant differences are depicted.

Similar articles

Cited by

References

    1. Akbulut Y, Gaunt HJ, Muraki K, Ludlow MJ, Amer MS, Bruns A, Vasudev NS, Radtke L, Willot M, Hahn S, Seitz T, Ziegler S, Christmann M, Beech DJ & Waldmann H (2015). (−)‐Englerin A is a potent and selective activator of TRPC4 and TRPC5 calcium channels. Angew Chem Int Ed 54, 3787–3791. - PMC - PubMed
    1. Arcangeli A, Crociani O, Lastraioli E, Masi A, Pillozzi S & Becchetti A (2009). Targeting ion channels in cancer: a novel frontier in antineoplastic therapy. Curr Med Chem 16, 66–93. - PubMed
    1. Asghar MY, Magnusson M, Kemppainen K, Sukumaran P, Lof C, Pulli I, Kalhori V & Tornquist K (2015). Transient receptor potential canonical 1 (TRPC1) channels as regulators of sphingolipid and VEGF receptor expression: Implications for thyroid cancer cell migration and proliferation. J Biol Chem 290, 16116–16131. - PMC - PubMed
    1. Bartlett F, Kortmann R & Saran F (2013). Medulloblastoma. Clin Oncol 25, 36–45. - PubMed
    1. Becchetti A & Arcangeli A (2010). Integrins and ion channels in cell migration: implications for neuronal development, wound healing and metastatic spread. Adv Exp Med Biol 674, 107–123. - PubMed

Publication types