Risk factors and short-term projections for serotype-1 poliomyelitis incidence in Pakistan: A spatiotemporal analysis
- PMID: 28604777
- PMCID: PMC5467805
- DOI: 10.1371/journal.pmed.1002323
Risk factors and short-term projections for serotype-1 poliomyelitis incidence in Pakistan: A spatiotemporal analysis
Abstract
Background: Pakistan currently provides a substantial challenge to global polio eradication, having contributed to 73% of reported poliomyelitis in 2015 and 54% in 2016. A better understanding of the risk factors and movement patterns that contribute to poliovirus transmission across Pakistan would support evidence-based planning for mass vaccination campaigns.
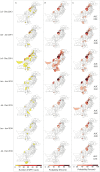
Methods and findings: We fit mixed-effects logistic regression models to routine surveillance data recording the presence of poliomyelitis associated with wild-type 1 poliovirus in districts of Pakistan over 6-month intervals between 2010 to 2016. To accurately capture the force of infection (FOI) between districts, we compared 6 models of population movement (adjacency, gravity, radiation, radiation based on population density, radiation based on travel times, and mobile-phone based). We used the best-fitting model (based on the Akaike Information Criterion [AIC]) to produce 6-month forecasts of poliomyelitis incidence. The odds of observing poliomyelitis decreased with improved routine or supplementary (campaign) immunisation coverage (multivariable odds ratio [OR] = 0.75, 95% confidence interval [CI] 0.67-0.84; and OR = 0.75, 95% CI 0.66-0.85, respectively, for each 10% increase in coverage) and increased with a higher rate of reporting non-polio acute flaccid paralysis (AFP) (OR = 1.13, 95% CI 1.02-1.26 for a 1-unit increase in non-polio AFP per 100,000 persons aged <15 years). Estimated movement of poliovirus-infected individuals was associated with the incidence of poliomyelitis, with the radiation model of movement providing the best fit to the data. Six-month forecasts of poliomyelitis incidence by district for 2013-2016 showed good predictive ability (area under the curve range: 0.76-0.98). However, although the best-fitting movement model (radiation) was a significant determinant of poliomyelitis incidence, it did not improve the predictive ability of the multivariable model. Overall, in Pakistan the risk of polio cases was predicted to reduce between July-December 2016 and January-June 2017. The accuracy of the model may be limited by the small number of AFP cases in some districts.
Conclusions: Spatiotemporal variation in immunization performance and population movement patterns are important determinants of historical poliomyelitis incidence in Pakistan; however, movement dynamics were less influential in predicting future cases, at a time when the polio map is shrinking. Results from the regression models we present are being used to help plan vaccination campaigns and transit vaccination strategies in Pakistan.
Conflict of interest statement
I have read the journal's policy and the authors of this manuscript have the following competing interests: ASB is employed with the study funder (Bill & Melinda Gates Foundation) and was involved in study design, interpretation, and writing of the report. The funder had no role in data collection.
Figures


Similar articles
-
Population Immunity against Serotype-2 Poliomyelitis Leading up to the Global Withdrawal of the Oral Poliovirus Vaccine: Spatio-temporal Modelling of Surveillance Data.PLoS Med. 2016 Oct 4;13(10):e1002140. doi: 10.1371/journal.pmed.1002140. eCollection 2016 Oct. PLoS Med. 2016. PMID: 27701425 Free PMC article.
-
The effect of mass immunisation campaigns and new oral poliovirus vaccines on the incidence of poliomyelitis in Pakistan and Afghanistan, 2001-11: a retrospective analysis.Lancet. 2012 Aug 4;380(9840):491-8. doi: 10.1016/S0140-6736(12)60648-5. Epub 2012 Jul 4. Lancet. 2012. PMID: 22766207 Free PMC article.
-
Population sensitivity of acute flaccid paralysis and environmental surveillance for serotype 1 poliovirus in Pakistan: an observational study.BMC Infect Dis. 2018 Apr 13;18(1):176. doi: 10.1186/s12879-018-3070-4. BMC Infect Dis. 2018. PMID: 29653509 Free PMC article.
-
Eradication and Current Status of Poliomyelitis in Pakistan: Ground Realities.J Immunol Res. 2016;2016:6837824. doi: 10.1155/2016/6837824. Epub 2016 Jul 18. J Immunol Res. 2016. PMID: 27517055 Free PMC article. Review.
-
[Towards the eradication of poliomyelitis: Mexico's achievements and challenges].Salud Publica Mex. 2012 Oct;54(5):537-43. doi: 10.1590/s0036-36342012000500011. Salud Publica Mex. 2012. PMID: 23011506 Review. Spanish.
Cited by
-
Analysis of population immunity to poliovirus following cessation of trivalent oral polio vaccine.Vaccine. 2023 Apr 6;41 Suppl 1(Suppl 1):A85-A92. doi: 10.1016/j.vaccine.2022.03.013. Epub 2022 Mar 23. Vaccine. 2023. PMID: 35339308 Free PMC article.
-
Modelling the spread of serotype-2 vaccine derived-poliovirus outbreak in Pakistan and Afghanistan to inform outbreak control strategies in the context of the COVID-19 pandemic.Vaccine. 2023 Apr 6;41 Suppl 1:A93-A104. doi: 10.1016/j.vaccine.2021.09.037. Epub 2021 Sep 25. Vaccine. 2023. PMID: 34629206 Free PMC article.
-
Modeling Poliovirus Surveillance and Immunization Campaign Quality Monitoring Costs for Pakistan and Afghanistan for 2019-2023.Open Forum Infect Dis. 2021 May 23;8(7):ofab264. doi: 10.1093/ofid/ofab264. eCollection 2021 Jul. Open Forum Infect Dis. 2021. PMID: 34295942 Free PMC article.
-
Disease Surveillance Investments and Administration: Limits to Information Value in Pakistan Polio Eradication.Risk Anal. 2021 Feb;41(2):273-288. doi: 10.1111/risa.13580. Epub 2020 Aug 21. Risk Anal. 2021. PMID: 32822075 Free PMC article.
-
Review of poliovirus modeling performed from 2000 to 2019 to support global polio eradication.Expert Rev Vaccines. 2020 Jul;19(7):661-686. doi: 10.1080/14760584.2020.1791093. Epub 2020 Aug 1. Expert Rev Vaccines. 2020. PMID: 32741232 Free PMC article. Review.
References
-
- GPEI. Data and monitoring. Wild poliovirus. [26 January 2017]. Available from: http://www.polioeradication.org/Dataandmonitoring/Poliothisweek/Wildpoli....
-
- Owais A, Khowaja AR, Ali SA, Zaidi AK. Pakistan's expanded programme on immunization: an overview in the context of polio eradication and strategies for improving coverage. Vaccine. 2013;31(33):3313–9. doi: 10.1016/j.vaccine.2013.05.015 - DOI - PubMed
-
- WHO. The Polio Eradication & Endgame Strategic Plan 2013–2018.2013.
-
- Chang AC, E.; Hameed S.; Lamb R.; Mixon R. Eradicating Polio in Afghanistan and Pakistan. A Report of the CSIS Global Health Policy Center. Center for Strategic & International Studies; 2012.
-
- Garon JR, Orenstein WA. Overcoming barriers to polio eradication in conflict areas. Lancet Infect Dis. 2015;15(10):1122–4. doi: 10.1016/S1473-3099(15)00008-0 - DOI - PubMed
MeSH terms
Grants and funding
LinkOut - more resources
Full Text Sources
Other Literature Sources
Medical

