. 2017 Jun 2:6:e24437.
doi: 10.7554/eLife.24437.

Diverse stimuli engage different neutrophil extracellular trap pathways

Affiliations

Diverse stimuli engage different neutrophil extracellular trap pathways

Elaine F Kenny et al. Elife. .

Abstract

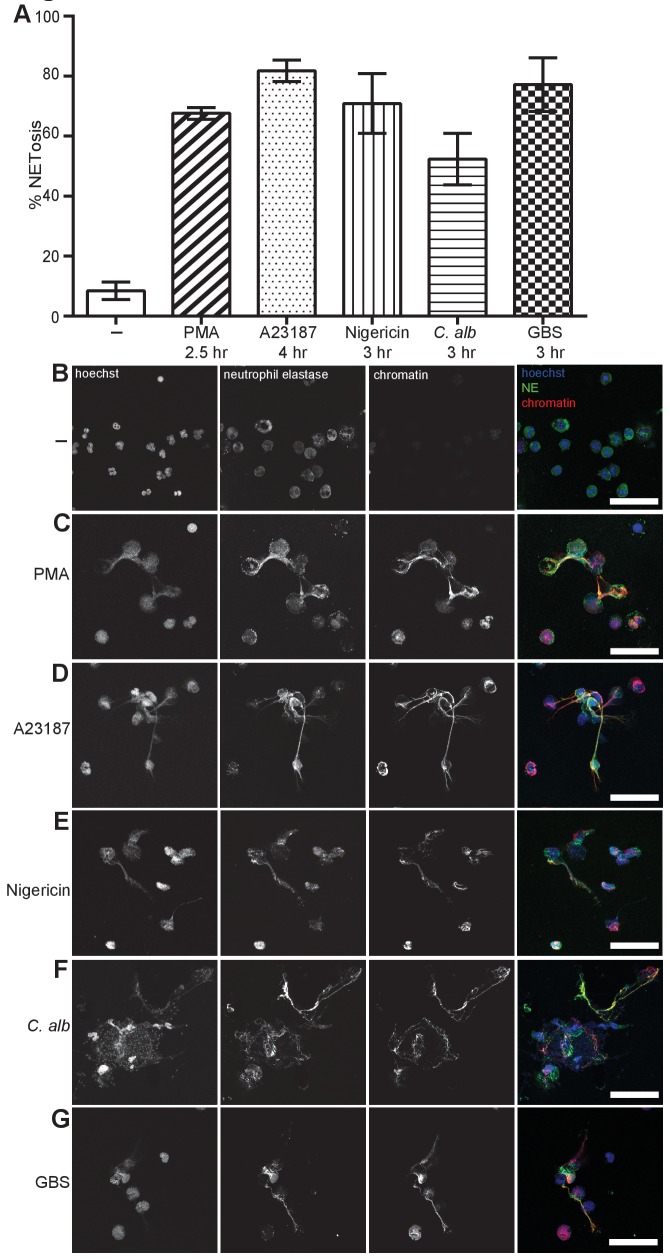
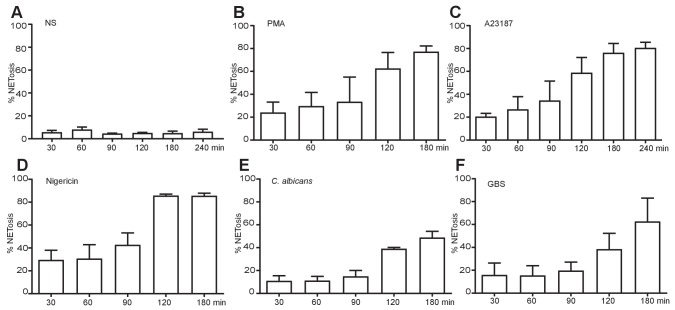
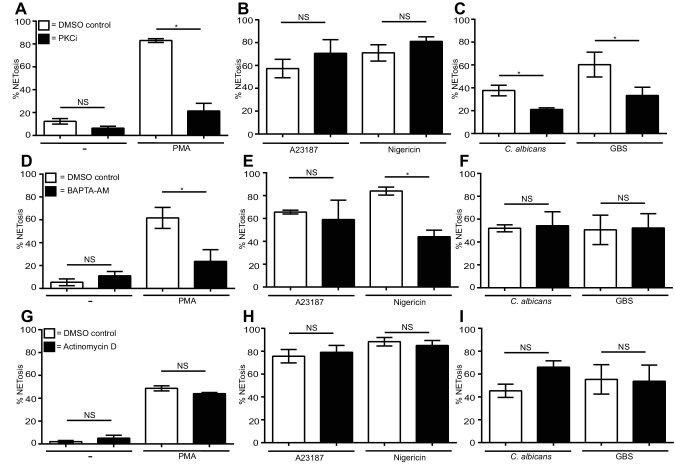
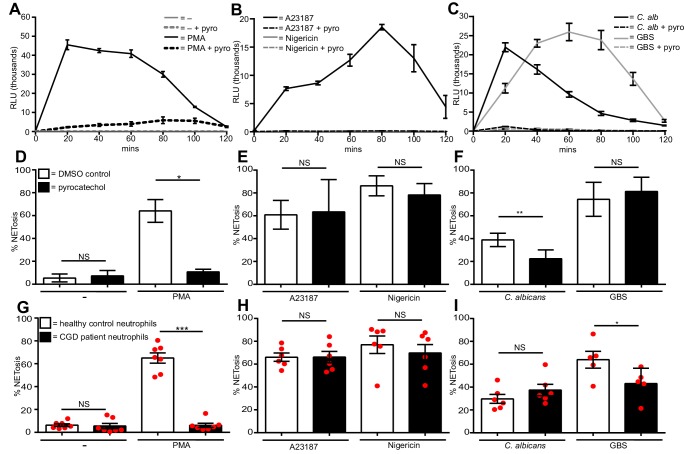
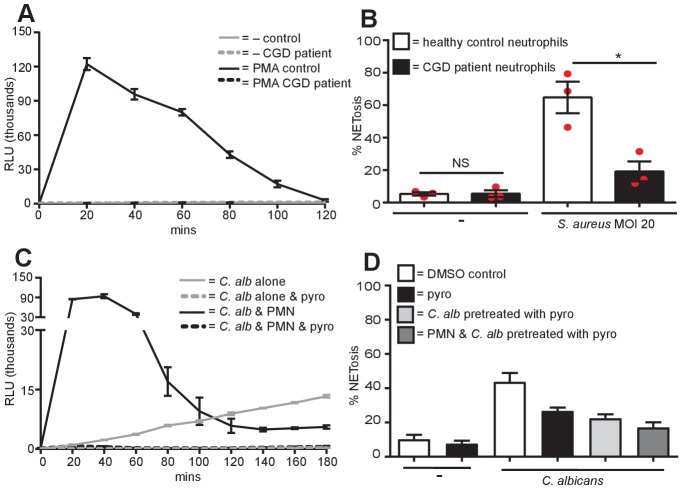
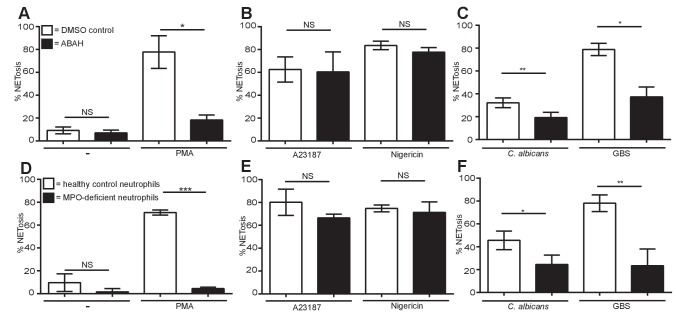
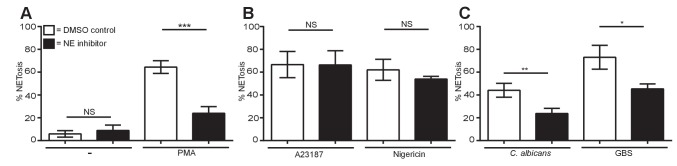
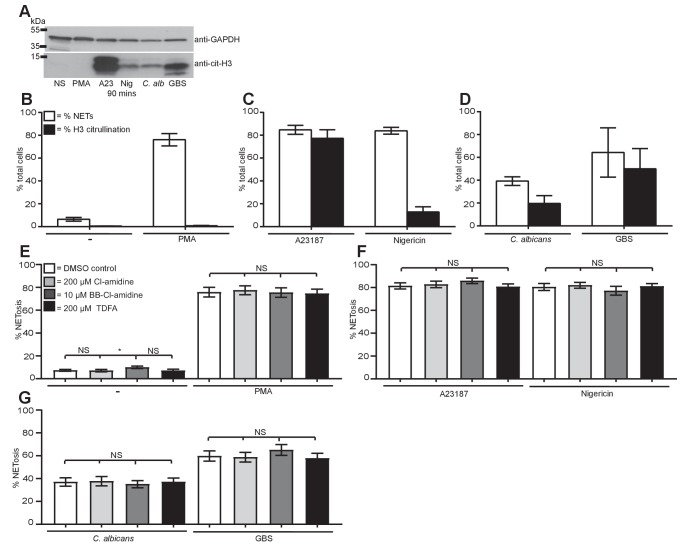
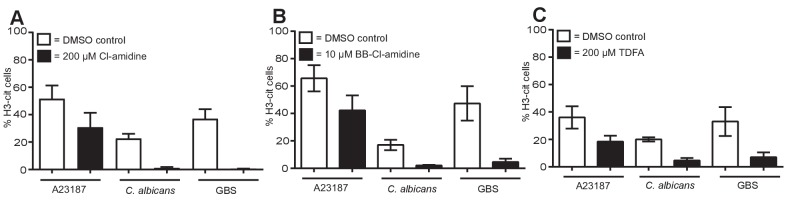
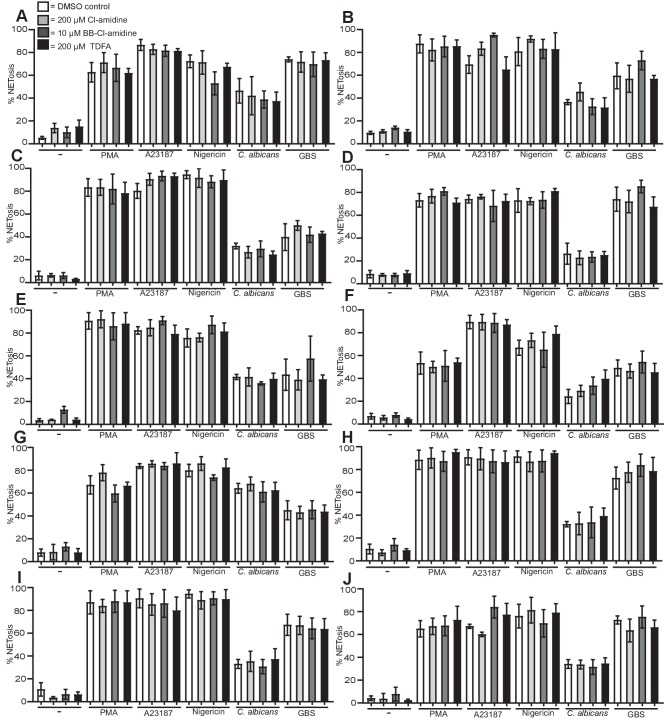
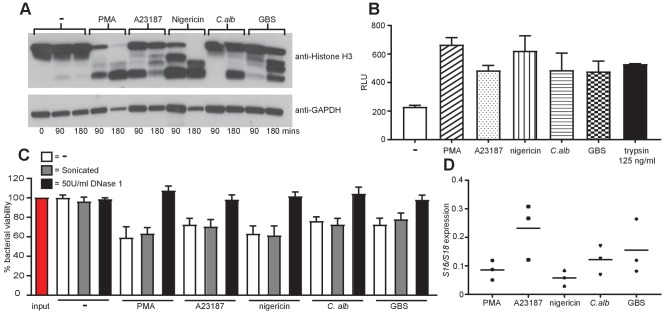
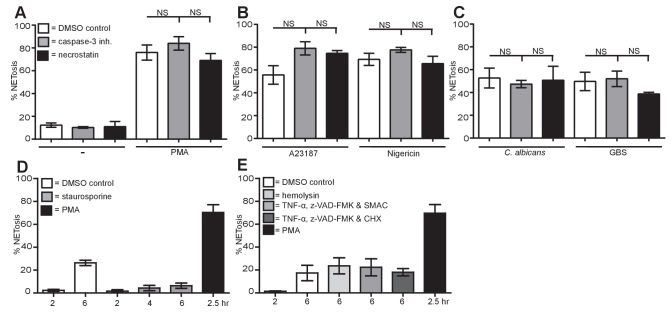
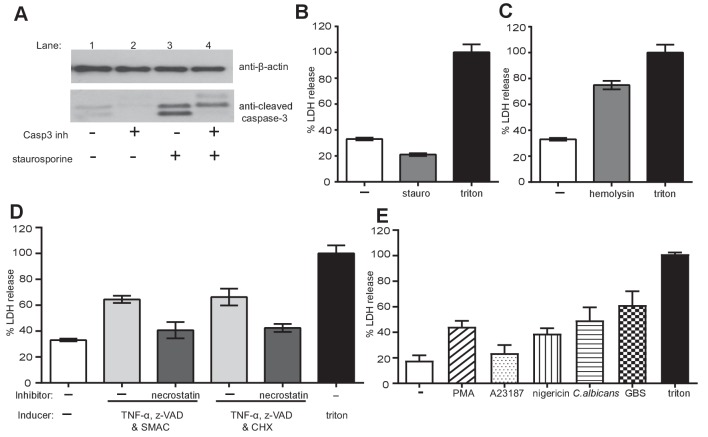
Neutrophils release neutrophil extracellular traps (NETs) which ensnare pathogens and have pathogenic functions in diverse diseases. We examined the NETosis pathways induced by five stimuli; PMA, the calcium ionophore A23187, nigericin, Candida albicans and Group B Streptococcus. We studied NET production in neutrophils from healthy donors with inhibitors of molecules crucial to PMA-induced NETs including protein kinase C, calcium, reactive oxygen species, the enzymes myeloperoxidase (MPO) and neutrophil elastase. Additionally, neutrophils from chronic granulomatous disease patients, carrying mutations in the NADPH oxidase complex or a MPO-deficient patient were examined. We show that PMA, C. albicans and GBS use a related pathway for NET induction, whereas ionophores require an alternative pathway but that NETs produced by all stimuli are proteolytically active, kill bacteria and composed mainly of chromosomal DNA. Thus, we demonstrate that NETosis occurs through several signalling mechanisms, suggesting that extrusion of NETs is important in host defence.

Keywords: NETs; Neutrophil; Neutrophil Extracellular Traps; cell biology; cell death; human; immunology; reactive oxygen species; signal transduction.


Conflict of interest statement

PRT: Consultant to Bristol-Myers Squibb.

The other authors declare that no competing interests exist.

Figures

Figure 1.
Figure 1.. NETosis induction by a range of stimuli.
Primary human neutrophils were stimulated for the indicated times with 50 nM PMA, 5 µM A23187, 15 µM nigericin, MOI 5 opsonized C. albicans or MOI 10 opsonized group B streptococcus (GBS), fixed with 2% PFA and incubated with a DNA stain (Hoechst) and immunolabeled with antibodies directed against Neutrophil Elastase (NE) and chromatin (A–G). (A) NETosis rate was quantified by immunofluorescence. Graph shows mean ± SEM from independent experiments with three different donors. (B–G) Representative confocal microscopy images of (B) non-stimulated neutrophils (-) or NETs induced by (C) PMA (D) A23187, (E) nigericin (F) C. albicans or (G) GBS and stained with Hoechst (blue) and immunolabeled for NE (green) and chromatin (red). Scale bars, 50 μm. DOI: http://dx.doi.org/10.7554/eLife.24437.003
Figure 1—figure supplement 1.
Figure 1—figure supplement 1.. NET induction over time with the five stimuli of interest.
Primary human neutrophils were stimulated for the indicated times with 50 nM PMA (B), 5 µM A23187 (C), 15 µM nigericin (D), MOI 5 C. albicans (E) or MOI 10 GBS (F), fixed with 2% PFA and incubated with a DNA stain (Hoechst) and immunolabeled with antibodies directed against Neutrophil Elastase (NE) and chromatin. NETosis rate was quantified by immunofluorescence. Graph shows mean ± SEM from independent experiments with three different donors. DOI: http://dx.doi.org/10.7554/eLife.24437.005
Figure 2.
Figure 2.. Differential requirements for PKC and calcium and a lack of requirement of transcription for NET induction by the stimuli of interest.
(A–C) NETosis rate in PKC inhibited neutrophils. Primary neutrophils were pre-treated with the PKC inhibitor Gö6976 (1 µM) for 30 min and stimulated with (A) PMA, (B) A23187 or nigericin, and (C) C. albicans or GBS for 2.5–4 hr and analysed for NET production by immunofluorescence. (D–F) NETosis rate in neutrophils pre-treated with the calcium chelator BAPTA-AM (10 µM) for 30 min and stimulated with (D) PMA, (E) A23187 or nigericin and (F) C. albicans or GBS for 2.5–4 hr and analysed for NET production by immunofluorescence. (G–I) NETosis rate in neutrophils pre-treated with actinomycin D (1 µg/ml) for 30 min and stimulated with (G) PMA, (H) A23187 or nigericin and (I) C. albicans or GBS for 2.5–4 hr and then analysed for NET production by immunofluorescence. Graphs show mean ± SEM from three independent experiments. *p<0.05, NS = not significant. DOI: http://dx.doi.org/10.7554/eLife.24437.012
Figure 3.
Figure 3.. Diverse stimuli have different ROS requirements for NETosis.
ROS production by neutrophils (A–C). ROS production was measured over a 2-hr time course in the presence or absence of the ROS scavenger pyrocatechol (pyro, 30 µM) in response to (A) PMA, (B) A23187 or nigericin and (C) C. albicans or GBS stimulation. Shown is a representative of three independent experiments. (D–F) NETosis rate of neutrophils pre-treated for 30 min with pyrocatechol or (G–I) NETosis rate of healthy control neutrophils and CGD patients stimulated with (D and G) PMA, (E and H) A23187 or nigericin and (F and I) C. albicans or GBS. (A–C) Graphs show mean ± SD from a representative of three independent experiments. (D–F) Graphs shows mean ± SEM from three independent experiments. (G–I) Graphs show mean ± SEM from five to seven independent experiments using neutrophils from five independent CGD patients (each represented by a red circle). *p<0.05, **p<0.01, ***p<0.001, NS = not significant. DOI: http://dx.doi.org/10.7554/eLife.24437.014
Figure 3—figure supplement 1.
Figure 3—figure supplement 1.. No ROS production in CGD patient neutrophils, S. aureus requires ROS for NET production and C. albicans produces ROS.
(A) ROS production by CGD neutrophils. Neutrophils from a healthy control donor and a CGD patient were examined for the production of ROS in response to PMA stimulation over a 2-hr time course. Graph shows mean ± SD from a representative of five independent ROS assays carried out with CGD patient neutrophils. (B) CGD patient neutrophils are impaired for S. aureus-induced NETosis. Healthy and CGD patient neutrophils were stimulated with S. aureus at a MOI of 20 for 4 hr and NETosis was examined as previously described. Graph shows mean ± SEM from three independent experiments. (C) C. albicans produces ROS. C. albicans-induced ROS was measured over a 3-hr time course in the presence or absence of either neutrophils (PMN) or pyrocatechol (pyro). Graph shows mean ± SD from a representative of three independent experiments. (D) NETosis in response to C. albicans utilises ROS generated from C. albicans. Healthy neutrophils or C. albicans were pre-treated with pyrocatechol for 30 mins. Cells were then stimulated with C. albicans at a MOI of 5 for 3 hr and NETosis was examined as previously described. Graph shows mean ± SEM from three independent experiments. DOI: http://dx.doi.org/10.7554/eLife.24437.016
Figure 4.
Figure 4.. Myeloperoxidase is essential for PMA, C. albicans and GBS-induced NETosis but not for A23187 and nigericin-induced NET formation.
(A–F) NETosis rate in response to (A and D) PMA, (B and E) A23187 or nigericin and (C and F) C. albicans or GBS. (A–C) Primary neutrophils were pre-treated for 30 min with 500 µM ABAH or a DMSO control, stimulated as indicated for 2.5–4 hr and analysed for NET production by immunofluorescence. Graphs show mean ± SEM from three independent experiments. (D–F) Healthy control neutrophils and neutrophils from a MPO-deficient patient were stimulated as outlined above. Graphs show mean ± SD from a representative of two independent experiments from a single MPO-deficient donor. *p<0.05, **p<0.01, ***p<0.001, NS = not significant. DOI: http://dx.doi.org/10.7554/eLife.24437.018
Figure 5.
Figure 5.. Neutrophil elastase is required for PMA, C. albicans and GBS-induced NETosis but not for A23187 or nigericin NET production.
(A–C) NETosis rate of neutrophils during NE inhibition. Primary neutrophils were pre-treated for 30 min with a neutrophil elastase inhibitor (GW311616A, 20 µM) or a DMSO control and stimulated for 2.5–4 hr with (A) PMA, (B) A23187 or nigericin and (C) C. albicans or GBS and analysed for NET production by immunofluorescence. Graphs show mean ± SEM from three independent experiments. *p<0.05, **p<0.01, ***p<0.001, NS = not significant. DOI: http://dx.doi.org/10.7554/eLife.24437.020
Figure 6.
Figure 6.. Citrullination of histone H3 occurs during NETosis but is not required for NET induction.
(A–D) Histone H3 was citrullinated during NETosis in response to all stimuli bar PMA. (A) Primary neutrophils were stimulated for 90 min with PMA, A23187, nigericin, C. albicans or GBS, lysed and assayed for the presence of citrullinated histone H3 and GAPDH by SDS-PAGE electrophoresis and Western immunoblotting. (B–D) NETosis rate and percentage of citrullinated cells in response to (B) PMA, (C) A23187 or nigericin and (D) C. albicans or GBS. Graphs show mean ± SD from a representative of two independent experiments. (E–G) NETosis rate in neutrophils pre-treated with the PAD inhibitor Cl-amidine at 200 µM, BB-Cl-amidine at 10 µM, TDFA at 200 µM, or DMSO as control and stimulated with (E) PMA, (F) A23187 or nigericin and (G) C. albicans or GBS and analysed for NET production by immunofluorescence. Graphs show mean ± SEM from 10 independent experiments. *p<0.05, NS = not significant. DOI: http://dx.doi.org/10.7554/eLife.24437.022
Figure 6—figure supplement 1.
Figure 6—figure supplement 1.. PAD inhibitors reduce histone H3 citrullination.
Neutrophils were pre-treated with (A) 200 µM Cl-amidine, (B) 10 µM BB-Cl-amidine or (C) 200 µM TDFA, stimulated with A23187, C. albicans or GBS for 3–4 hr, fixed, stained with an antibody against citrullinated histone H3 and hoechst and analysed for percentage of cells citrullinated on histone H3 by immunofluorescence. Graphs show mean ± SEM from three independent experiments. DOI: http://dx.doi.org/10.7554/eLife.24437.024
Figure 6—figure supplement 2.
Figure 6—figure supplement 2.. PAD inhibitors do not prevent NETosis.
(A–J) Neutrophils were pre-treated with Cl-amidine at 200 µM (light grey bars), BB-Cl-amidine at 10 µM (dark grey bars), TDFA (black bars) at 200 µM, or DMSO as control (white bars), stimulated with PMA, A23187, nigericin, C. albicans or GBS for 2.5–4 hr and analysed for NET production by immunofluorescence. Graphs show mean ± SD from 10 independent experiments. DOI: http://dx.doi.org/10.7554/eLife.24437.025
Figure 7.
Figure 7.. NETs are proteolytically active, kill bacteria and are mainly composed of chromosomal DNA.
(A) NETosis leads to histone H3 degradation. Primary neutrophils were stimulated for 90 and 180 min with PMA, A23187, nigericin, C. albicans or GBS, lysed and assayed for the presence of histone H3 and GAPDH by SDS-PAGE electrophoresis and Western immunoblotting. Shown is a representative of three independent experiments. (B) Isolated NETs are proteolytically active. NETosis was induced for 4 hr, NETs were isolated after treatment with AluI for 20 min, the DNA content was determined and 200 ng/ml DNA was tested for its proteolytic activity using the Pierce Fluorescent Protease Assay Kit according the manufacturer’s instructions. 100 µl of non-stimulated neutrophil supernatant was used to determine the background activity and 125 ng/ml trypsin was added as a positive control. (C) NETs can kill E. coli. Neutrophils were stimulated to produce NETs for 4 hr. Phagocytosis was inhibited by the addition of Cytochalasin D and E. coli at a MOI of 1 were added in the presence or absence of 50 U/ml DNase 1. After 1 hr the cells, NETs and E. coli were collected (selected samples were sonicated), serially diluted, plated on tetracycline-resistant agar plates and incubated for 24 hr at 37°C followed by CFU counts to determine killing. (D) NETs are primarily composed of chromosomal DNA. 4 hr post NET induction the NETs were isolated by MNase treatment, followed by proteinase K treatment. NET DNA was isolated by phenol-chloroform extraction and the ratio of S18 to S16 DNA was analysed by real-time PCR. Graphs show mean ± SEM from three independent experiments. DOI: http://dx.doi.org/10.7554/eLife.24437.026
Figure 8.
Figure 8.. NETosis is a unique form of cell death different from apoptosis, necrosis and necroptosis.
(A–C) NETosis occurs in the presence of apoptosis and necroptosis inhibitors. Primary human neutrophils were pre-treated for 30 min with 20 µM caspase-3 inhibitor or 30 µM necrostatin or a DMSO control and stimulated with (A) PMA, (B) A23187 or nigericin and (C) C. albicans or GBS for 2.5–4 hr and analysed for NET production by immunofluorescence. Graphs show mean ± SEM from three independent experiments. (D) NETosis rate in the presence of the apoptosis inducer staurosporine. Primary neutrophils were stimulated for 2–6 hr with staurosporine (500 nM) or PMA and analysed for NET induction by immunofluorescence. Graphs show mean ± SEM from three independent experiments. (E) NETosis rate in response to necrosis or necroptosis inducers. Primary neutrophils were stimulated with α-hemolysin (25 µg/ml) to induce necrosis or with TNF-α (50 ng/ml), Z-VAD-FMK (50 µM) and a SMAC mimetic (100 nM) or cycloheximide (25 µg/ml) to induce necroptosis for 6 hr and analysed for NET production by immunofluorescence. Graphs show mean ± SEM from three independent experiments. NS = not significant. DOI: http://dx.doi.org/10.7554/eLife.24437.027
Figure 8—figure supplement 1.
Figure 8—figure supplement 1.. Apoptosis, necrosis and necroptosis can be induced in primary neutrophils, NETosis results in LDH release.
(A) Staurosporine induced caspase-3 cleavage in neutrophils. Primary neutrophils were pre-treated with a caspase-3 inhibitor for 30 mins, stimulated with staurosporine for 3 hr; cell lysates were generated and assayed for the presence of cleaved caspase-3 and β-actin by SDS-PAGE electrophoresis and Western immunoblotting. Data shown is a representative of three independent experiments. (B) Staurosporine does not induce LDH release. Neutrophils were stimulated with staurosporine for 21 hr and LDH release was measured as per the manufacturer’s instructions. (C) Neutrophils were stimulated for 21 hr with α-hemolysin and LDH release was measured. (D) Neutrophils were pre-treated with a necrostatin inhibitor for 30 min and stimulated with TNF-α, Z-VAD-FMK and a SMAC mimetic or cycloheximide (CHX) for 21 hr and LDH release was measured. (C–D) Graphs show mean ± SD from a representative of two independent experiments. (E) LDH is released in NETosis. Neutrophils were treated with the indicated stimuli for 4 hr and LDH release was measured. Graph shows mean ± SEM from three independent experiments. Treatment of neutrophils with triton-X100 was used to normalise the data with triton treatment set to 100% LDH release. DOI: http://dx.doi.org/10.7554/eLife.24437.029

Similar articles

Cited by

References

    1. Amini P, Stojkov D, Wang X, Wicki S, Kaufmann T, Wong WW, Simon HU, Yousefi S. NET formation can occur independently of RIPK3 and MLKL signaling. European Journal of Immunology. 2016;46:178–184. doi: 10.1002/eji.201545615. - DOI - PMC - PubMed
    1. Amulic B, Cazalet C, Hayes GL, Metzler KD, Zychlinsky A. Neutrophil function: from mechanisms to disease. Annual Review of Immunology. 2012;30:459–489. doi: 10.1146/annurev-immunol-020711-074942. - DOI - PubMed
    1. Bardoel BW, Kenny EF, Sollberger G, Zychlinsky A. The balancing act of neutrophils. Cell Host & Microbe. 2014;15:526–536. doi: 10.1016/j.chom.2014.04.011. - DOI - PubMed
    1. Barrientos L, Marin-Esteban V, de Chaisemartin L, Le-Moal VL, Sandré C, Bianchini E, Nicolas V, Pallardy M, Chollet-Martin S. An improved strategy to recover large fragments of functional human neutrophil extracellular traps. Frontiers in Immunology. 2013;4:166. doi: 10.3389/fimmu.2013.00166. - DOI - PMC - PubMed
    1. Brinkmann V, Goosmann C, Kühn LI, Zychlinsky A. Automatic quantification of in vitro NET formation. Frontiers in Immunology. 2012;3:413. doi: 10.3389/fimmu.2012.00413. - DOI - PMC - PubMed

MeSH terms