. 2017 Jun 5;214(6):1567-1580.
doi: 10.1084/jem.20162115. Epub 2017 May 19.

IL-2high tissue-resident T cells in the human liver: Sentinels for hepatotropic infection

Affiliations

IL-2high tissue-resident T cells in the human liver: Sentinels for hepatotropic infection

Laura J Pallett et al. J Exp Med. .

Abstract

The liver provides a tolerogenic immune niche exploited by several highly prevalent pathogens as well as by primary and metastatic tumors. We have sampled healthy and hepatitis B virus (HBV)-infected human livers to probe for a subset of T cells specialized to overcome local constraints and mediate immunity. We characterize a population of T-betloEomesloBlimp-1hiHobitlo T cells found within the intrahepatic but not the circulating memory CD8 T cell pool expressing liver-homing/retention markers (CD69+CD103+ CXCR6+CXCR3+). These tissue-resident memory T cells (TRM) are preferentially expanded in patients with partial immune control of HBV infection and can remain in the liver after the resolution of infection, including compartmentalized responses against epitopes within all major HBV proteins. Sequential IL-15 or antigen exposure followed by TGFβ induces liver-adapted TRM, including their signature high expression of exhaustion markers PD-1 and CD39. We suggest that these inhibitory molecules, together with paradoxically robust, rapid, cell-autonomous IL-2 and IFNγ production, equip liver CD8 TRM to survive while exerting local noncytolytic hepatic immunosurveillance.


Figures

Figure 1.
Figure 1.
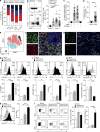
Liver-resident memory CD8 T cells are present in the human liver but not in blood. (a) Frequencies of CD8 T cell differentiation/memory subsets (CD27+CD45RA+; CD27+CD45RA; CD27CD45RA; and CD27CD45RA+) in peripheral blood (n = 40 healthy controls) and intrahepatic samples (n = 11 healthy liver tissues; n = 19 healthy margins of resected tissue distant to colorectal carcinoma metastases [CRC margins], and n = 24 perfusates). (b) Percent CD69+CD103+ of healthy control peripheral (n = 40) and intrahepatic CD8 T cells (n = 10 healthy liver tissues, n = 20 CRC margins, and n = 27 perfusates). (c) Intrahepatic CD69+CD103+ CD8 T cells stratified by memory phenotype in healthy livers (n = 47). (d) Percent CD69+CD103+ within memory (CD45RA) CD8 in healthy control PBMCs (n = 40) or livers (n = 54). (e) The dimensionality reduction method tSNE analysis was used to generate a two-dimensional map of T cells within perfusate samples from healthy livers with regard to their expression of key transcription factors and tissue-residency markers. tSNE was performed on the expression data for the markers CD69, CD103, Blimp-1, Eomes, and T-bet as measured by FACS on all CD3+CD8+CD45RA events concatenated from four perfusates. Manual gating was used to identify CD69+CD103+ (black), CD69+CD103 (red), and CD69CD103 T cells (blue) as shown in the bottom left corner. These gated populations were then plotted on to the total tSNE map. (f and g) Representative immunofluorescence staining of frozen liver sections: hepatocytes surrounding a vessel stained with cytokeratin (green) and e-cadherin (red; f), and another vessel stained with CD8 (green) and CD103 (red; g). Arrows in g denote cells coexpressing CD8 and CD103 in situ. (h–l) Representative examples and summary data from circulating (white), intrahepatic CD45RACD69CD103 (gray), and intrahepatic CD45RACD69+CD103+ (black) memory CD8 T cells from healthy donors for CXCR6 (%; n = 24) and CXCR3 (MFI; n = 21; h), CD98 (MFI; n = 12) and CD14 (%; n = 20; i), perforin (MFI; n = 16) and granzyme B (MFI; n = 16; j), HLA-DR (%; n = 21; k), and IFNγ and IL-2 intracellular cytokine production (4 h anti-CD3 and anti-CD28; n = 15; l). Error bars indicate means ± SEM; *, P < 0.05; **, P < 0.01; ***, P < 0.001; ****, P < 0.0001; p-values were determined via MANOVA (a); Kruskal-Wallis test (ANOVA) with a Dunn’s post hoc test for pairwise multiple comparisons (b, c, h, i, j, k, and l); and Mann-Whitney t test (d).
Figure 2.
Figure 2.
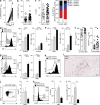
CD8 TRM expand in patients controlling HBV infection. (a and b) Frequencies of CD69+CD103+ as percentages of the CD8 T cell memory (CD45RA) pool in paired blood and liver biopsies from patients with chronic HBV infection (n = 33; a) and biopsy/resection tissue from healthy (n = 54) or HBV-infected (n = 35) livers (b). (c) Percent intrahepatic CD8 T cells within live singlet lymphocytes and stratified by differentiation/memory subsets (defined in Fig. 1). (d–f) PD-1 expression (percentage and MFI) on circulating (white), intrahepatic CD45RACD69CD103 (gray), and intrahepatic CD45RACD69+CD103+ (black) memory CD8 T cells isolated from healthy controls (n = 26; d), patients with CHB (n = 13; e), and comparing intrahepatic CD45RACD69+CD103+ CD8 T cells from healthy controls and CHB (f). (g) CD39 expression (percentage) on circulating (white), intrahepatic CD45RACD69CD103 (gray), and intrahepatic CD45RACD69+CD103+ (black) memory CD8 T cells isolated from healthy controls (n = 25) or CHB (n = 18). (h) Representative example of PD-1 expression on CD39/CD39+ CD45RACD69+CD103+ CD8 T cells. (i) Representative immunohistochemical staining of PD-L1 (brown) and CD8 (gray) using a paraffin-embedded liver section. Arrow denotes PD-L1 staining on a cell localized in the liver sinusoids. (j–l) Ki67 (%; n = 10; j), CD57 (%; n = 5; k) and granzyme B (MFI; n = 9; l) expression on circulating (white), intrahepatic CD45RACD69CD103 (gray), and intrahepatic CD45RACD69+CD103+ (black) on memory CD8 T cells from patients with CHB. Error bars indicate means ± SEM; *, P < 0.05; **, P < 0.01; ***, P < 0.001; ****, P < 0.0001; p-values were determined via Wilcoxon Signed-rank t test (a); Mann-Whitney t test (b, c, and f); MANOVA (c); and Kruskal-Wallis test (ANOVA) with a Dunn’s post hoc test for pairwise multiple comparisons (c, d, e, g, j, k, and l).
Figure 3.
Figure 3.
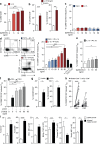
Sequential exposure to IL-15 or antigen and TGFβ induces CD8 “residency” in vitro. (a and b) CD69 expression (%; n = 27; a) and CXCR6 (%; n = 17) or CXCR3 (%; n = 12; b) expressing peripheral CD8 T cells after 3 d culture in the presence of rhIL-15 at indicated doses (red; n = 11). (c and d) Coexpression of CD69 and CD103 on peripheral CD8 T cells (“induced” CD69+CD103+ CD8 T cells; n = 11) after either rhIL-15 alone (red) or rhTGFβ alone (blue; c) at the indicated doses for 6 d, two-step sequential cytokine exposure with 3 d rhIL-15 followed by a further 3 d rhTGFβ (red) at concentrations of both cytokines indicated or vice versa (blue; n = 20; d) or two-step sequential cytokine exposure with 3 d rhIL-15 followed by 3 d rhIL-33 at concentrations of both cytokines indicated (n = 11; e). (f) Frequency of induced CD69+CD103+ CD8 T cells after two-step culture with 3 d 0.25 µg/ml immobilized anti-CD3 followed by 3 d ± addition of rhTGFβ at concentrations indicted (n = 12). (g) Expression of CXCR6 (%; n = 12) and CXCR3 (%; n = 12) on peripheral CD8 T cells after 6 d 0.25 µg/ml immobilized anti-CD3 (n = 10). (h) Frequency of induced CD69+CD103+ within the global or peptide-specific (HBV or CEF) CD8 T cells after culture with either 1 µg/ml of overlapping peptides spanning the core region of HBV genotype D or 0.5 µg/ml CEF (peptide pool against CEF) for 7 d (n = 12). (i) Expression of CD14 (%; n = 17), CD39 (%; n = 20), PD-1 (MFI; n = 17), Blimp-1 (MFI; n = 12), Eomes (MFI; n = 6), and Notch (MFI; n = 6) on CD69CD103 CD8+ (white) and CD69+CD103+ (“induced resident;” black) CD8 T cells after sequential exposure to 3 d of 50 ng/ml rhIL-15 followed by 3 d of 50 ng/ml rhTGFβ. All figures show summary data from at least four independent experiments. Error bars indicate means ± SEM; *, P < 0.05; **, P < 0.01; ***, P < 0.001; ****, P < 0.0001; p-values were determined via a Kruskal-Wallis test (ANOVA) with a Dunn’s post hoc test for pairwise multiple comparisons (a, c, d, e, and f) or a Wilcoxon Signed-rank t test (b, g, h, and i).
Figure 4.
Figure 4.
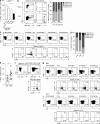
Liver CD8 TRM include virus-specific CD8 and are associated with HBV control. (a) Frequencies of CD45RACD69+CD103+ CD8 T cells in HBV-infected liver biopsies stratified by viral load (IU/ml; ≤2,000, n = 10; 2 × 10³ − 2 × 10⁵, n = 15; >2 × 10⁵, n = 8; all treatment naive) compared with healthy livers (n = 54). (b–d) Proportion of HBV-specific CD8 T cells in CHB expressing residency markers CD103 and CD69, identified by ex vivo staining with a panel of HLA-A2–HBV peptide dextramers (example plots for blood and an HBV+ resection liver; summary data n = four livers; one resection, three biopsies; b) or after stimulation of IHL for 16 h with 10 µg/ml of overlapping peptides spanning core, polymerase, or envelope regions (using an HBsAg+ HBV perfusate; c) and after 16-h stimulation with core (HBV genotype D) alone and intracellular cytokine staining for IFNγ, TNF, and IL-2 (n = 7; d). (e) Proportion of CEF–specific (n = 10; four margins, six biopsies) and HBV-specific (n = 8; one resection, one perfusate, six biopsies) IFNγ CD8 responses expressing a CD45RACD69+CD103+ phenotype. (f) Detection of CD8 T cells according to CD69 and CD103 expression within ex vivo HLA-A2–HBV dextramer (dex.) panel-binding cells in an HLA-A2+ perfusate sample from an individual with HBsAg-resolved HBV infection. (g) IHLs from an HLA-A2 perfusate from an individual with HBsAg-resolved HBV infection were stimulated with 10 µg/ml of overlapping peptides spanning core, envelope, or polymerase regions of HBV genotype D for 16 h followed by intracellular cytokine staining for IFNγ and IL-2 and assessment of residency markers on cytokine-positive populations. Error bars indicate means ± SEM; *, P < 0.05; **, P < 0.01; ****, P < 0.0001; p-values were determined by a Kruskal-Wallis test (ANOVA) with a Dunn’s post hoc test for pairwise multiple comparisons (a) or Wilcoxon Signed-rank t test (e).

Comment in

Similar articles

Cited by

References

    1. Alves N.L., Hooibrink B., Arosa F.A., and van Lier R.A.. 2003. IL-15 induces antigen-independent expansion and differentiation of human naive CD8+ T cells in vitro. Blood. 102:2541–2546. 10.1182/blood-2003-01-0183 - DOI - PubMed
    1. Bertoletti A., and Ferrari C.. 2016. J. Hepatol. 64:S71–S83. 10.1016/j.jhep.2016.01.026 - DOI - PubMed
    1. Boni C., Laccabue D., Lampertico P., Giuberti T., Viganò M., Schivazappa S., Alfieri A., Pesci M., Gaeta G.B., Brancaccio G., et al. . 2012. Restored function of HBV-specific T cells after long-term effective therapy with nucleos(t)ide analogues. Gastroenterology. 143:963–73.e9. 10.1053/j.gastro.2012.07.014 - DOI - PubMed
    1. Cheuk S., Schlums H., Gallais Sérézal I., Martini E., Chiang S.C., Marquardt N., Gibbs A., Detlofsson E., Introini A., Forkel M., et al. . 2017. CD49a expression defines tissue-resident CD8+ T cells poised for cytotoxic function in human skin. Immunity. 46:287–300. 10.1016/j.immuni.2017.01.009 - DOI - PMC - PubMed
    1. Crispe I.N. 2014. Immune tolerance in liver disease. Hepatology. 60:2109–2117. 10.1002/hep.27254 - DOI - PMC - PubMed

Publication types

MeSH terms