. 2017 May 10;21(5):580-591.e7.
doi: 10.1016/j.chom.2017.04.005.

CRISPR/Cas9 Screens Reveal Epstein-Barr Virus-Transformed B Cell Host Dependency Factors

Affiliations

CRISPR/Cas9 Screens Reveal Epstein-Barr Virus-Transformed B Cell Host Dependency Factors

Yijie Ma et al. Cell Host Microbe. .

Abstract

Epstein-Barr virus (EBV) causes endemic Burkitt lymphoma (BL) and immunosuppression-related lymphomas. These B cell malignancies arise by distinct transformation pathways and have divergent viral and host expression programs. To identify host dependency factors resulting from these EBV+, B cell-transformed cell states, we performed parallel genome-wide CRISPR/Cas9 loss-of-function screens in BL and lymphoblastoid cell lines (LCLs). These highlighted 57 BL and 87 LCL genes uniquely important for their growth and survival. LCL hits were enriched for EBV-induced genes, including viral super-enhancer targets. Our systematic approach uncovered key mechanisms by which EBV oncoproteins activate the PI3K/AKT pathway and evade tumor suppressor responses. LMP1-induced cFLIP was found to be critical for LCL defense against TNFα-mediated programmed cell death, whereas EBV-induced BATF/IRF4 were critical for BIM suppression and MYC induction in LCLs. Finally, EBV super-enhancer-targeted IRF2 protected LCLs against Blimp1-mediated tumor suppression. Our results identify viral transformation-driven synthetic lethal targets for therapeutic intervention.

Keywords: CRISPR; Epstein-Barr virus; NF-kappaB; apoptosis; dependency factor; gamma-herpesvirus; interferon regulatory factor; oncoprotein; synthetic lethal; tumor virus.


Figures

Figure 1.
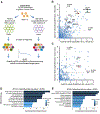
Figure 1.. CRISRP/Cas9 Screens Identify Growth and Survival Factors in EBV-infected Burkitt and Lymphoblastoid B-cells.
(A) CRISPR/Cas9 screen workflow and screening strategy. (B-C) Scatter plots showing the statistical significance of top (B) GM12878-selective and (C) P3HR1-selective hits. Statistical significance was quantitated by the STARS algorithm, using two biological replicates for each axis (see Table S1). (D-E) Enrichr pathway analysis of (D) GM12878-selective and (E) P3HR1-selective screen hits, using a q<0.05 cutoff. See also Figure S1.
Figure 2.
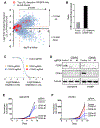
Figure 2.. CRISPR Screens Highlight LCL and BL Dependency Factors.
(A) Scatter plot of EBV-mediated effects on primary human B cell gene expression Y axis, Log2 (LCL to primary B-cell ratios); X axis, −log10 (p-value). Values (Price et al., 2012) of top LCL-selective hits (red circle) versus all other B cell genes (blue circle) are shown. (B) Ratios of EBV-induced to EBV-suppressed primary B-cell host genes for genome-wide (gray bar) versus for the 87 LCL-selective screen hits at q <0.05 cutoff (black bar). (C) CRISPR screens identified distinct GM12878 and P3HR1 cyclin/cyclin-dependent kinase dependencies. Data are expressed as Log2 normalized values of sgRNA abundance from quadruplicate screens. The four sgRNAs against CDK4 (triangle), CCND3 (square), CDK6 (closed circle) and CCND2 (diamond) are highlighted among all Avana sgRNA library abundances (open circle). (D) Immunoblot analysis of CDK4 or CDK6 knockout in whole cell extracts of GM12878 or P3HR1 with the indicated sgRNAs. (E-F) Growth curves of GM12878 versus P3HR1 Cas9 cells expressing CDK6 (red), CDK4 (blue) or non-targeting control (black) sgRNA. Mean and standard deviation (S.D.) of triplicate experiments are shown. See also Figure S1.
Figure 3.
Figure 3.. CD19/81 Promote EBV-Mediated PI3K/AKT Pathway Activation.
(A-C) Log2 normalized abundance of sgRNAs targeting (A) CD19, (B) CD81 or (C) CD21 in the library input, P3HR1 BL (Day 21) or GM12878 LCL (Day 21). Mean and S.D. values from quadruplicate screens are shown. (D) Flow cytometry profiles of plasma membrane CD19 levels in GM12878 Cas9+ LCLs following control (blue) or CD19 sgRNA (red) expression. (E) Growth curve analysis of GM12878 Cas9 cells expressing control, CD19 or CD18 sgRNAs. Mean and S.D. values of triplicate experiments are shown. (F) Immunoblot analysis of phospho-AKT, phospho-SYK or GAPDH in GM12878 expressing the indicated sgRNAs. (G) Schematic model of EBV latent membrane protein in comparison to B-cell receptor-mediated PI3K pathway activation. See also Figure S2–3.
Figure 4.
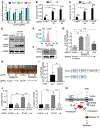
Figure 4.. LCLs are Critically Dependent on LMP1-induced cFLIP.
(A). Log2 normalized abundance of the CFLAR sgRNAs in the library input, P3HR1 BL (Day 21) or GM12878 LCL (Day 21). (B-C) CFLAR sgRNAs induce caspase-8 (B) and caspase-3/7 activity (C) in GM12878 LCLs but not P3HR1 BL. (D) Immunoblot analysis of PARP cleavage in GM12878 expressing control or CFLAR sgRNAs, as shown. (E) Flow cytometry analysis of cell surface Fas levels in GM12878 expressing control or Fas sgRNAs. (F) Immunoblot analysis of type I TNF receptor (TNFR1) in GM12878 expressing control or TNFRSF1A sgRNA. (G) LCLs expressing control, TNFRSF1A, or FAS sgRNA (sgRNA 1) were subsequently transduced with lentivirus expressing either CFLAR or control sgRNAs (sgRNA 2). Normalized live cell numbers were expressed as the ratio of cells transduced with CFLAR sgRNA to those with control sgRNA. (H) Cultures of GM12878 expressing TNFRSF1A or control sgRNA on day 5 after transduction of control or CFLAR sgRNAs. (I) cDNA rescue of CFLAR-sgRNA-transduced LCLs. GM12878 stably expressing the indicated rescue cDNAs were transduced with control or CFLAR sgRNA. 1 week after transduction, live cell ratios of CFLAR- to control-sgRNA-transduced cells were shown. Schematic diagram of cFLIP isoforms is shown on the right. (J) GM12878 expressing GFP or cFLIP-S rescue cDNAs were transduced with control or CFLAR sgRNAs. After 5 days, caspase-8 and 3/7 activities were measured. (K) Schematic diagram of LMP1-induced cFLIP survival roles. Mean and S.D. values of at least triplicate experiments are shown. See also Figure S4–6.
Figure 5.
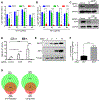
Figure 5.. LCLs are Addicted to EBV-induced BATF and IRF4.
(A-B) Log2 normalized abundances of (A) BATF and (B) IRF4 sgRNAs in the library input, P3HR1 BL (Day 21) or GM12878 LCL (Day 21). Mean and S.D. of quadruplicate samples are shown; ****, p<0.0001. (C) Immunoblot analysis of GM12878 whole cell extracts collected 5 days after expression of control, BATF, or IRF4 sgRNAs, as indicated. (D) Caspase-3/7 activity was measured 5 days after introduction of control, BATF or IRF4 sgRNA in GM12878 LCL or P3HR1 BL. (E) Immunoblot analysis of BATF, IRF4 and tubulin in whole cell lysates of primary human B-cells infected by EBV at the indicated time points post infection. (F) cDNA rescue of BATF-sgRNA-transduced LCLs. GM12878 stably expressing the indicated rescue cDNAs were transduced with control or BATF sgRNA. 1 week after transduction, live cell ratios of BATF- to control-sgRNA-transduced cells were shown. (G) Venn diagrams of GM12878 genes upregulated or downregulated by BATF or IRF4 sgRNA. Differentially expressed (DE) genes associated with a FDR adjusted p value < 0.05 between BATF or IRF4 sgRNA and control sgRNA groups were subject to analysis. See also Figure S7.
Figure 6.
Figure 6.. BATF and IRF4 are Critical for LCL BIM Suppression and MYC Induction.
(A) Immunoblot analysis of BIM extra long (EL), long (L) or short (S) isoforms, IRF4, or GAPDH expression in whole cell lysates of GM12878 cells 6 days following expression of control or IRF4 sgRNA. (B) Immunoblot analysis of the whole cell lysates of GM12878 stably expressing HA-BATF rescue or V5-GFP cDNA on day 7 after transduction of control or BATF sgRNA. (C) ChIP-seq signal visualization for IRF4, BATF, H3K27Ac, EBNA3A and EBNA3C at the BCL2L11 locus in GM12878. (D-E) GSEA Hallmark analysis of significantly downregulated gene sets in RNAseq datasets obtained from GM12878 4 days after transduction of control, IRF4 or BATF sgRNA, as indicated. (F) MYC mRNA levels in GM12878 on day 5 after transduction of control, IRF4 or BATF sgRNA. Mean and S.D. values from triplicate independent experiments are shown; ***, p<0.0001. (G) GM12878 ChIP-seq signals of IRF4, BATF, EBNA3C, 3A or H3K27Ac at the EBV super enhancer closest to the MYC transcriptional start site.
Figure 7.
Figure 7.. LCLs are Addicted to EBV-Targeted IRF2.
(A) Log2 normalized abundances of IRF2 sgRNAs in the library input, P3HR1 BL (Day 21) or GM12878 LCL (Day 21); **, p<0.01; ****, p<0.0001. (B) Immunoblot analysis of IRF2 in GM12878 whole cell lysates 5 days after transduction of the control or IRF2 sgRNA. (C) Caspase 3/7 activity in GM12878 (white box) or P3HR1 (grey box) 5 days after transduction of the control or IRF2 sgRNA. Mean and S.D. of three replicates are shown. (D) Heatmap visualization of RNAseq levels for representative GM12878 genes divergently affected by IRF2 versus IRF4 sgRNAs. Data from triplicate samples are shown. (E) GSEA Hallmark analysis of significantly downregulated gene sets in RNAseq datasets from GM12878 transduced with IRF2 sgRNA compared to control sgRNA. (F) GSEA Enrichment plot of MYC target genes in GM12878 following transduction of IRF2 versus control sgRNA. (G) GM12878 expressing control or independent PRDM1 sgRNAs (sgRNA 1) were subsequently transduced with IRF2 or control sgRNA (sgRNA 2). Normalized live cell numbers were expressed as the ratio of cells transduced with IRF2 sgRNA to those with control sgRNA. Mean and S.D. of triplicate experiments is shown (**p<0.01). See also Figure S7.

Similar articles

Cited by

References

    1. Anderton E, Yee J, Smith P, Crook T, White RE, and Allday MJ (2008). Two Epstein-Barr virus (EBV) oncoproteins cooperate to repress expression of the proapoptotic tumour-suppressor Bim: clues to the pathogenesis of Burkitt’s lymphoma. Oncogene 27, 421–433. - PubMed
    1. Arvey A, Tempera I, Tsai K, Chen HS, Tikhmyanova N, Klichinsky M, Leslie C, and Lieberman PM (2012). An atlas of the Epstein-Barr virus transcriptome and epigenome reveals host-virus regulatory interactions. Cell Host Microbe 12, 233–245. - PMC - PubMed
    1. Banerjee S, Lu J, Cai Q, Saha A, Jha HC, Dzeng RK, and Robertson ES (2013). The EBV Latent Antigen 3C Inhibits Apoptosis through Targeted Regulation of Interferon Regulatory Factors 4 and 8. PLoS Pathog 9, e1003314. - PMC - PubMed
    1. Basso K, and Dalla-Favera R (2012). Roles of BCL6 in normal and transformed germinal center B cells. Immunol Rev 247, 172–183. - PubMed
    1. Bernhardt K, Haar J, Tsai MH, Poirey R, Feederle R, and Delecluse HJ (2016). A Viral microRNA Cluster Regulates the Expression of PTEN, p27 and of a bcl-2 Homolog. PLoS Pathog 12, e1005405. - PMC - PubMed

MeSH terms

Substances