Comprehensive Transcriptome and Mutational Profiling of Endemic Burkitt Lymphoma Reveals EBV Type-Specific Differences
- PMID: 28465297
- PMCID: PMC5471630
- DOI: 10.1158/1541-7786.MCR-16-0305
Comprehensive Transcriptome and Mutational Profiling of Endemic Burkitt Lymphoma Reveals EBV Type-Specific Differences
Abstract
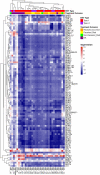
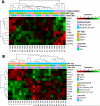
Endemic Burkitt lymphoma (eBL) is the most common pediatric cancer in malaria-endemic equatorial Africa and nearly always contains Epstein-Barr virus (EBV), unlike sporadic Burkitt lymphoma (sBL) that occurs with a lower incidence in developed countries. Given these differences and the variable clinical presentation and outcomes, we sought to further understand pathogenesis by investigating transcriptomes using RNA sequencing (RNAseq) from multiple primary eBL tumors compared with sBL tumors. Within eBL tumors, minimal expression differences were found based on: anatomical presentation site, in-hospital survival rates, and EBV genome type, suggesting that eBL tumors are homogeneous without marked subtypes. The outstanding difference detected using surrogate variable analysis was the significantly decreased expression of key genes in the immunoproteasome complex (PSMB9/β1i, PSMB10/β2i, PSMB8/β5i, and PSME2/PA28β) in eBL tumors carrying type 2 EBV compared with type 1 EBV. Second, in comparison with previously published pediatric sBL specimens, the majority of the expression and pathway differences was related to the PTEN/PI3K/mTOR signaling pathway and was correlated most strongly with EBV status rather than geographic designation. Third, common mutations were observed significantly less frequently in eBL tumors harboring EBV type 1, with mutation frequencies similar between tumors with EBV type 2 and without EBV. In addition to the previously reported genes, a set of new genes mutated in BL, including TFAP4, MSH6, PRRC2C, BCL7A, FOXO1, PLCG2, PRKDC, RAD50, and RPRD2, were identified. Overall, these data establish that EBV, particularly EBV type 1, supports BL oncogenesis, alleviating the need for certain driver mutations in the human genome.
Implications: Genomic and mutational analyses of Burkitt lymphoma tumors identify key differences based on viral content and clinical outcomes suggesting new avenues for the development of prognostic molecular biomarkers and therapeutic interventions.
©2017 American Association for Cancer Research.
Figures


Similar articles
-
Epstein-Barr Virus Genomes Reveal Population Structure and Type 1 Association with Endemic Burkitt Lymphoma.J Virol. 2020 Aug 17;94(17):e02007-19. doi: 10.1128/JVI.02007-19. Print 2020 Aug 17. J Virol. 2020. PMID: 32581102 Free PMC article.
-
Distinct Viral and Mutational Spectrum of Endemic Burkitt Lymphoma.PLoS Pathog. 2015 Oct 15;11(10):e1005158. doi: 10.1371/journal.ppat.1005158. eCollection 2015 Oct. PLoS Pathog. 2015. PMID: 26468873 Free PMC article.
-
Immunoglobulin gene analysis reveals 2 distinct cells of origin for EBV-positive and EBV-negative Burkitt lymphomas.Blood. 2005 Aug 1;106(3):1031-6. doi: 10.1182/blood-2005-01-0168. Epub 2005 Apr 19. Blood. 2005. PMID: 15840698
-
The company malaria keeps: how co-infection with Epstein-Barr virus leads to endemic Burkitt lymphoma.Curr Opin Infect Dis. 2011 Oct;24(5):435-41. doi: 10.1097/QCO.0b013e328349ac4f. Curr Opin Infect Dis. 2011. PMID: 21885920 Free PMC article. Review.
-
Endemic Burkitt lymphoma: a complication of asymptomatic malaria in sub-Saharan Africa based on published literature and primary data from Uganda, Tanzania, and Kenya.Malar J. 2020 Jul 28;19(1):239. doi: 10.1186/s12936-020-03312-7. Malar J. 2020. PMID: 32718346 Free PMC article. Review.
Cited by
-
Genetic subgroups inform on pathobiology in adult and pediatric Burkitt lymphoma.Blood. 2023 Feb 23;141(8):904-916. doi: 10.1182/blood.2022016534. Blood. 2023. PMID: 36201743 Free PMC article.
-
EBV-associated diseases: Current therapeutics and emerging technologies.Front Immunol. 2022 Oct 27;13:1059133. doi: 10.3389/fimmu.2022.1059133. eCollection 2022. Front Immunol. 2022. PMID: 36389670 Free PMC article. Review.
-
Latent membrane proteins from EBV differentially target cellular pathways to accelerate MYC-induced lymphomagenesis.Blood Adv. 2022 Jul 26;6(14):4283-4296. doi: 10.1182/bloodadvances.2022007695. Blood Adv. 2022. PMID: 35605249 Free PMC article.
-
Reframing Burkitt lymphoma: virology not epidemiology defines clinical variants.Ann Lymphoma. 2021 Sep;5:22. doi: 10.21037/aol-21-18. Epub 2021 Sep 30. Ann Lymphoma. 2021. PMID: 34888589 Free PMC article.
-
Burkitt lymphoma-related TCF3 mutations alter TCF3 alternative splicing by disrupting hnRNPH1 binding.RNA Biol. 2020 Oct;17(10):1383-1390. doi: 10.1080/15476286.2020.1772559. Epub 2020 Jun 4. RNA Biol. 2020. PMID: 32449435 Free PMC article.
References
-
- Burkitt D, Denis B. MALIGNANT LYMPHOMA IN AFRICAN CHILDREN. Lancet. 1961;277:1410–1.
-
- Satou A, Akira S, Naoko A, Atsuko N, Tomoo O, Masahito T, et al. Epstein-Barr Virus (EBV)-positive Sporadic Burkitt Lymphoma. Am J Surg Pathol. 2015;39:227–35. - PubMed
-
- Ferry JA. Burkitt's lymphoma: clinicopathologic features and differential diagnosis. Oncologist. 2006;11:375–83. - PubMed
-
- Boerma EG, van Imhoff GW, Appel IM, Veeger NJGM, Kluin PM, Kluin-Nelemans JC. Gender and age-related differences in Burkitt lymphoma – epidemiological and clinical data from The Netherlands. Eur J Cancer. 2004;40:2781–7. - PubMed
-
- Chen B-J, Chang S-T, Weng S-F, Huang W-T, Chu P-Y, Hsieh P-P, et al. EBV-associated Burkitt lymphoma in Taiwan is not age-related. Leuk Lymphoma. 2016;57:644–53. - PubMed
Publication types
MeSH terms
Grants and funding
LinkOut - more resources
Full Text Sources
Other Literature Sources
Research Materials
Miscellaneous

