. 2017 Apr 24;41(2):204-220.e5.
doi: 10.1016/j.devcel.2017.03.018.

A Global View of RNA-Protein Interactions Identifies Post-transcriptional Regulators of Root Hair Cell Fate

Affiliations

A Global View of RNA-Protein Interactions Identifies Post-transcriptional Regulators of Root Hair Cell Fate

Shawn W Foley et al. Dev Cell. .

Abstract

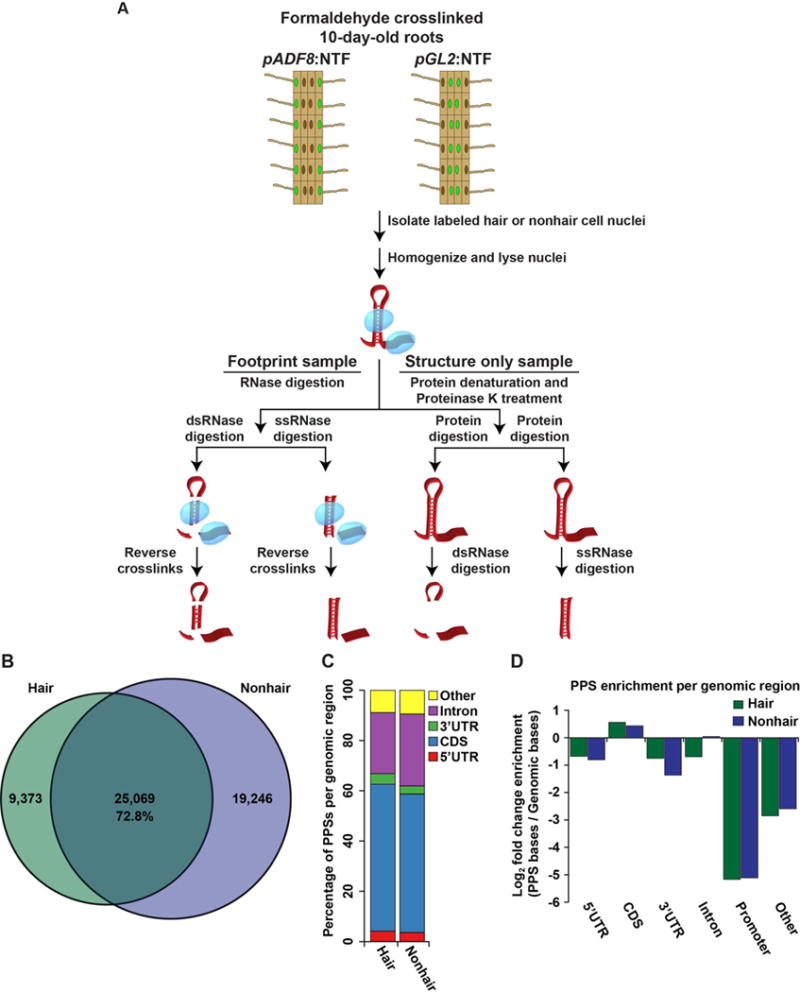
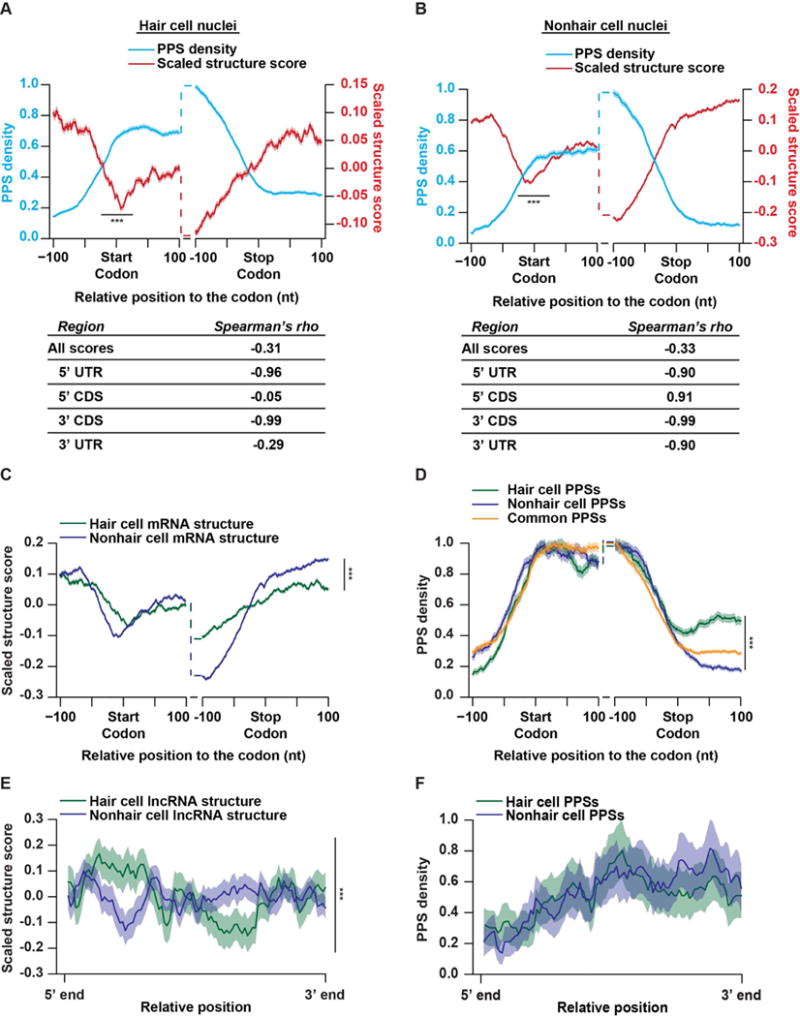
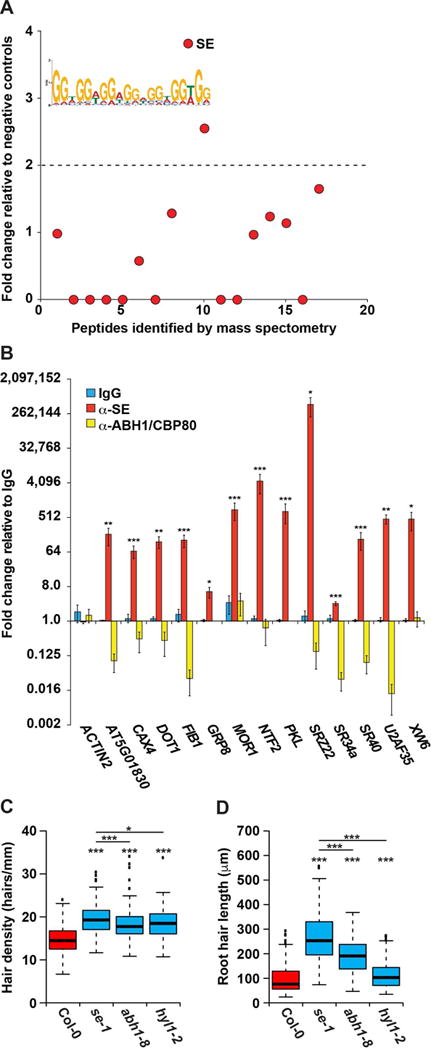
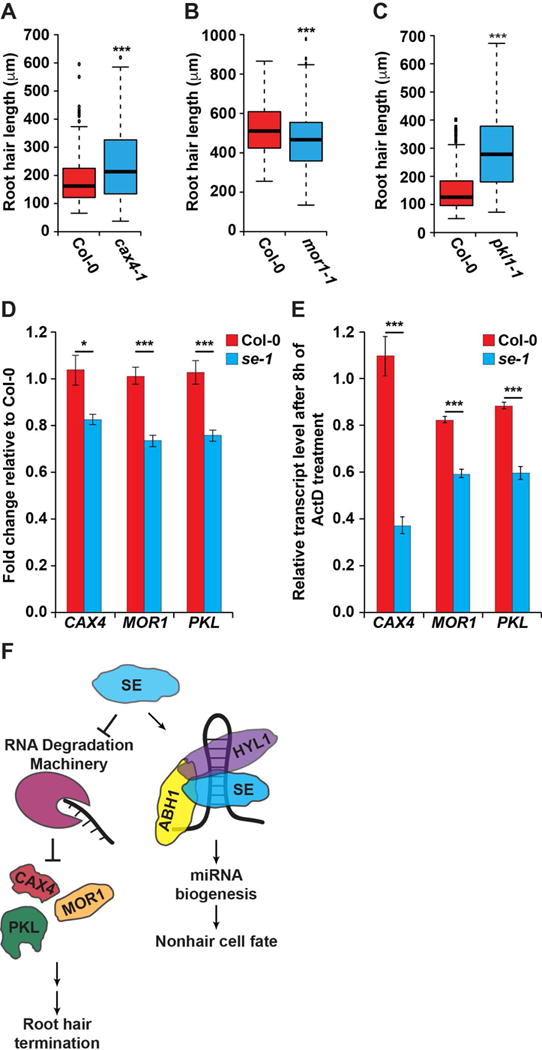
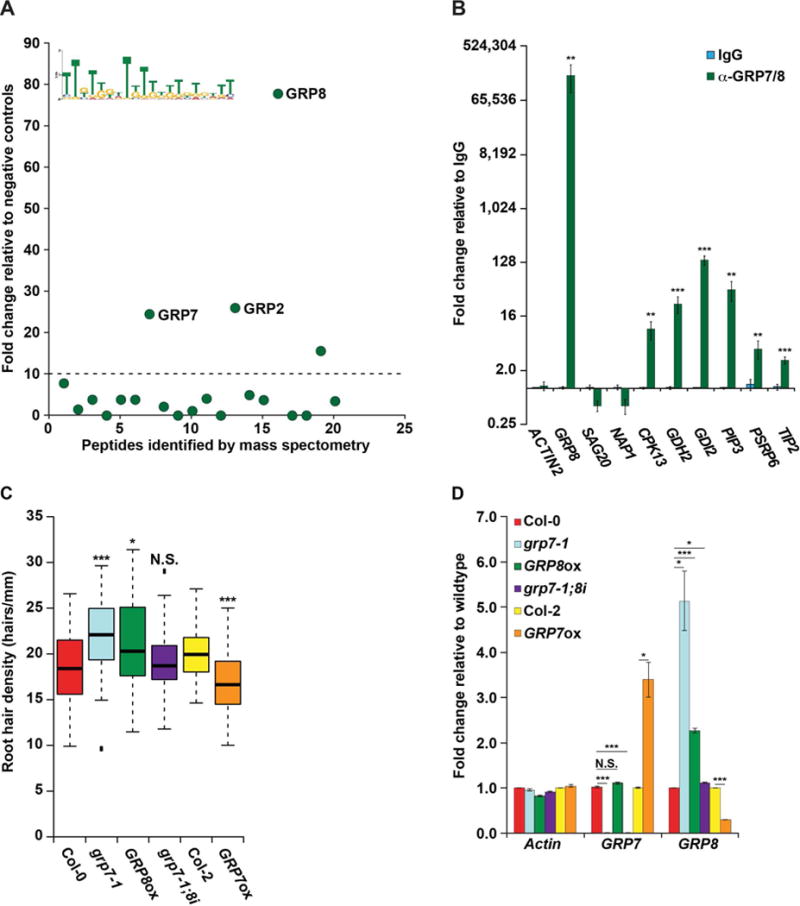
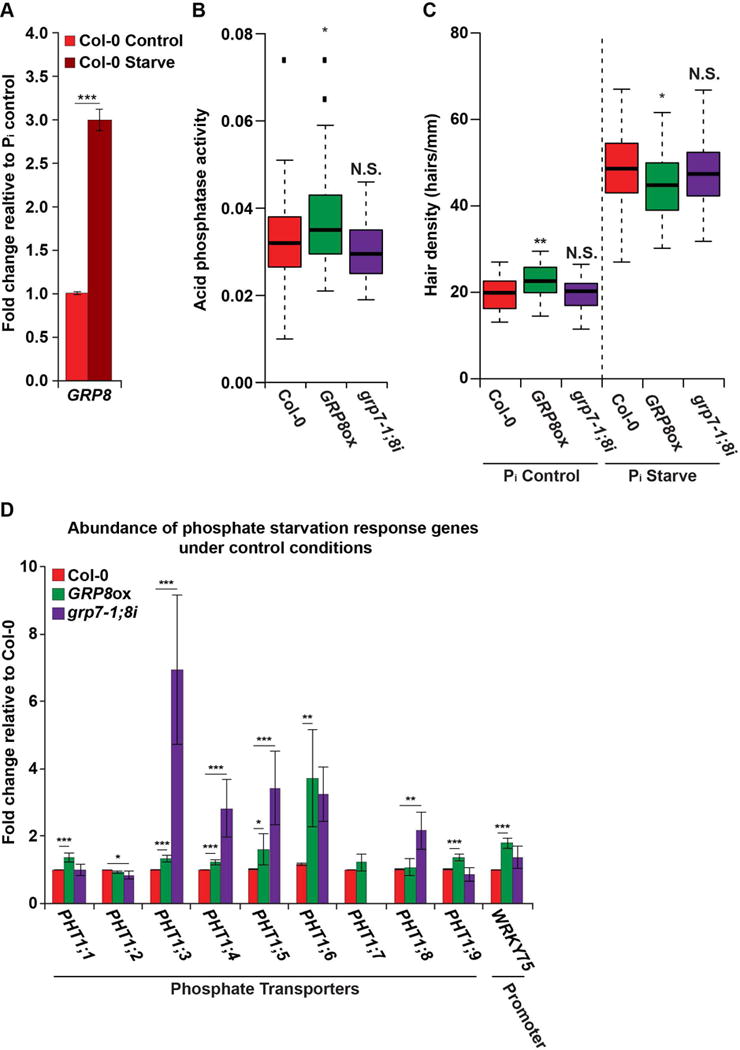
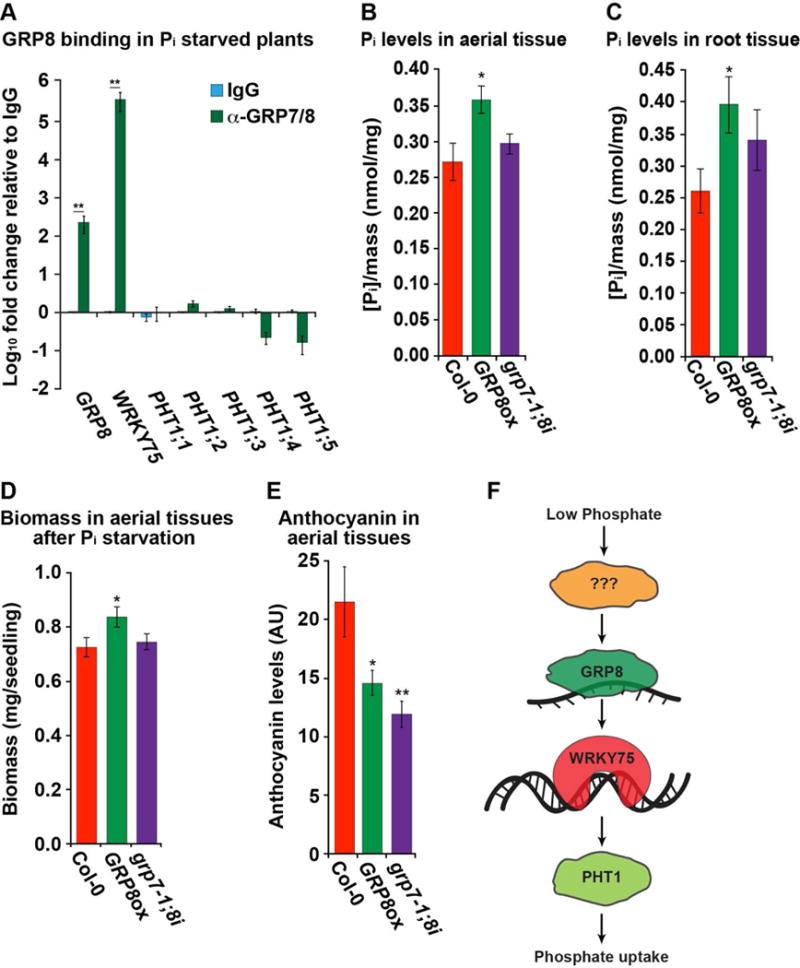
The Arabidopsis thaliana root epidermis is comprised of two cell types, hair and nonhair cells, which differentiate from the same precursor. Although the transcriptional programs regulating these events are well studied, post-transcriptional factors functioning in this cell fate decision are mostly unknown. Here, we globally identify RNA-protein interactions and RNA secondary structure in hair and nonhair cell nuclei. This analysis reveals distinct structural and protein binding patterns across both transcriptomes, allowing identification of differential RNA binding protein (RBP) recognition sites. Using these sequences, we identify two RBPs that regulate hair cell development. Specifically, we find that SERRATE functions in a microRNA-dependent manner to inhibit hair cell fate, while also terminating growth of root hairs mostly independent of microRNA biogenesis. In addition, we show that GLYCINE-RICH PROTEIN 8 promotes hair cell fate while alleviating phosphate starvation stress. In total, this global analysis reveals post-transcriptional regulators of plant root epidermal cell fate.

Keywords: RNA binding proteins; RNA biology; RNA secondary structure; phosphate starvation response; plant development; post-transcriptional regulation; root hairs.


Figures

Figure 1
Figure 1. Nuclear PIP-seq identifies cell type specific RNA-protein interactions
(A) The PIP-seq approach in the nucleus of Arabidopsis root hair and nonhair cells. Fully differentiated root epidermal cells were excised from 10-day-old Arabidopsis plants and crosslinked with a 1% formaldehyde solution. The nuclei of either root hair or nonhair cells (green circles) were then isolated via the INTACT technique. Nuclei were lysed and separated into footprinting and structure only samples. Four total sequencing libraries were then prepared for each replicate experiment as previously described (Gosai et al., 2015). (B) Overlap between protein protected sites (PPSs) identified in hair (green) or nonhair (purple) cell nuclei. The intersection indicates PPSs identified in both cell types that overlap by at least a single nucleotide. (C) Absolute distribution of PPSs throughout regions of mRNA transcripts. (D) Genomic enrichment of PPS density, measured as log2 enrichment of the fraction of PPS base coverage normalized to the fraction of genomic bases covered by indicated nuclear mRNA regions for hair (green bars) and nonhair (purple bars) cells. See also Figures S1–S3.
Figure 2
Figure 2. Hair and nonhair cells have distinct RNA-protein interaction and RNA secondary structure profiles
(A–B) PPS density (blue line) and scaled structure score (red line) profiles for nuclear mRNAs at each nucleotide +/− 100 nt from the annotated start or stop codons in hair (A) or nonhair (B) cell nuclei. The tables represent the Spearman’s rho correlations between the PPS density and scaled structure scores across the graphed windows up- and downstream of the start codon, stop codon, or across all detectable mRNA transcripts. (C–D) Scaled structure score (C) or PPS density (D) profiles at each nucleotide +/− 100 nt from the annotated start or stop codons in nuclear mRNAs expressed in both hair (green line) and nonhair (purple line) cells. PPSs are divided into those that are detected in hair cells (green line), nonhair cells (purple line), or common to both cell types (orange line). (E–F) Scaled structure score (E) or PPS density (F) across binned unspliced lncRNAs expressed in root hair (green) or nonhair (purple) cell nuclei. Shading around the solid lines indicates standard error of the mean (SEM) across all detectable transcripts. ***indicates p value < 0.001, Wilcoxon test in all panels. See also Figures S1 and S2.
Figure 3
Figure 3. SERRATE regulates hair cell fate and hair length in a partially microRNA-independent manner
(A) RNA affinity chromatography followed by LC-MS was performed on whole root cell lysate using the MEME identified GGN repeat motif as bait. The number of peptide spectrum matches (PSMs) for each identified peptide was graphed as fold change over the average PSMs of scrambled RNA bait and no RNA controls. Peptides above the dotted line have a more than 2-fold change and correspond to candidate RBPs. SE is denoted as being highly bound by our analysis. (B) RIP-qPCR was performed on whole root lysate using rabbit α-IgG (blue bars), α-SE (red bars), or α-ABH1/CBP80 (yellow bars) antibodies, graphed as fold change relative to the IgG negative control pull down, n = 4. Error bars indicate SEM. *, **, and *** denote p value < 0.05, 0.01, and 0.001, respectively, Welch’s t-test. (C–D) Root hair cell density (hairs/mm) (C) and root hair length (μm) (D) of Col-0, se-1, abh1-8, and hyl1-2 mutant plants. For analysis of root hair length n=400, and for root hair density n > 135. *, **, and *** denote p value < 0.05, 0.01, and 0.001, respectively, while N.S. denotes p value > 0.05, Wilcoxon test. See also Figures S1, S2, and S4–S6.
Figure 4
Figure 4. SE bound GGN motif containing genes regulate root hair cell development
(A–C) Root hair length for null cax4-1 (A), mor1-1 (B), and pkl1-1 (C) mutant plants as compared to wild type Col-0. For root hair length analysis n=200. *, **, and *** denote p value < 0.05, 0.01, and 0.001, respectively, Wilcoxon test. (D) RT-qPCR of SE bound genes in WT (red) and se-1 (blue) roots, n = 6. (E) Roots from both WT (red) and se-1 (blue) plants were subjected to Actinomycin D treatment for 8 hours to inhibit transcription, followed by RT-qPCR analysis of the mRNAs noted in the figure, n = 3. *, **, and *** denote p value < 0.05, 0.01, and 0.001, respectively, Welch’s t-test. Error bars indicate SEM. (F) A model of the role of SE in both the microRNA-independent promotion of root hair termination, as well as the microRNA-dependent promotion of the nonhair cell fate. See also Figures S1, S2, and S4–S6.
Figure 5
Figure 5. GRP8 regulates root hair cell fate in a GRP7-independent manner
(A) RNA affinity chromatography followed by LC-MS was performed on whole root cell lysate using the MEME identified TG-rich motif as bait. Peptides above the dotted line have a more than 10-fold change and are candidate RBPs, with three GRPs denoted. (B) RIP-qPCR was performed on whole root lysate using rabbit IgG (blue bars) or rabbit serum raised against GRP7 and GRP8 (green bars) graphed as fold change relative to IgG. (C) Root hair cell density was measured in 8-day-old seedlings of WT or plants with decreased or increased GRP7 (grp7-1 or GRP7ox, respectively), increased GRP8 (GRP8ox), or decreased GRP7 with WT levels of GRP8 (grp7-1;8i), n > 50. * and *** denote p value < 0.05 and 0.001, respectively, while N.S. denotes p value > 0.05, Wilcoxon test. (D) RT-qPCR of root tissue from lines with altered GRP7 and/or GRP8 levels, graphed as fold change relative to WT (Col-0 or Col-2). For (B) and (D), *, **, and *** denote p value < 0.05, 0.01, and 0.001, respectively, Welch’s t-test. Error bars indicate SEM. See also Figures S1, S2, S4, S6, and S7.
Figure 6
Figure 6. GRP8 functions in the phosphate starvation response pathway
(A) RT-qPCR measuring GRP8 levels in Col-0 plants after three days of phosphate deprivation (dark red bar) or control treatment (light red bar). (B) Acid phosphatase activity in the roots of phosphate starved Col-0 and GRP7/8 mutant 8-day-old seedlings, n > 40. (C) Root hair cell density (hairs/mm) in 8-day-old seedlings after three days of phosphate starvation. (D) Levels of phosphate starvation response genes as measured by RT-qPCR in roots from Col-0 (blue), GRP8ox (green), and grp7-1;8i (purple) grown under control conditions. For (A) and (D), * and ** denote p value < 0.05 and 0.01, respectively, Welch’s t-test. For (B) and (C), * and ** denote p value < 0.05 and 0.01, respectively, Wilcoxon test. Error bars indicate SEM. See also Figures S1, S2, S4, S6–S7.
Figure 7
Figure 7. GRP8 alleviates phosphate deprivation stress
(A) RIP-qPCR of root tissue from grp7-1 plants grown under phosphate starvation. RIP-qPCR was performed with a rabbit IgG (blue) or rabbit serum raised against GRP7 and GRP8 (green) graphed as fold change relative to α-IgG, n = 4 (B–C) Measurement of phosphate levels normalized to mass after 3-days of phosphate starvation in the shoots (B) or roots (C) of 8-day-old seedlings, n = 12. (D–E) Biomass (D) or anthocyanin levels (E) for 18-day-old seedlings after 2 weeks of phosphate deprivation, n = 12. For (A)-(E), *, **, and *** denote p value < 0.05, 0.01, and 0.001, respectively, Welch’s t-test. Error bars indicate SEM. (F) A model of the role of GRP8 on the plant phosphate starvation response. See also Figures S1, S2, S4, S6–S7.

Similar articles

Cited by

References

    1. Bailey TL, Boden M, Buske FA, Frith M, Grant CE, Clementi L, Ren J, Li WW, Noble WS. MEME SUITE: tools for motif discovery and searching. Nucleic Acid Res. 2009;37:W202–W208. - PMC - PubMed
    1. Bates TR, Lynch JP. Stimulation of root hair elongation in Arabidopsis thaliana by low phosphorus availability. Plant Cell Environ. 1996;19:529–538.
    1. Berkowitz ND, Silverman IM, Childress DM, Kazan H, Wang LS, Gregory BD. A comprehensive database of high-throughput sequencing-based RNA secondary structure probing data (Structure Surfer) BMC Bioinformatics. 2016;17:215. - PMC - PubMed
    1. Clarke JH, Tack D, Findlay K, Van Montagu M, Van Lijsebettens M. The SERRATE locus controls the formation of the early juvenile leaves and phase length in Arabidopsis. Plant J Cell Mol Biol. 1999;20:493–501. - PubMed
    1. Cruz JA, Westhof E. The Dynamic Landscapes of RNA Architecture. Cell. 2009;136:604–609. - PubMed

Publication types

MeSH terms