

Epigenetic aging signatures in mice livers are slowed by dwarfism, calorie restriction and rapamycin treatment
- PMID: 28351423
- PMCID: PMC5371228
- DOI: 10.1186/s13059-017-1186-2
Epigenetic aging signatures in mice livers are slowed by dwarfism, calorie restriction and rapamycin treatment
Abstract
Background: Global but predictable changes impact the DNA methylome as we age, acting as a type of molecular clock. This clock can be hastened by conditions that decrease lifespan, raising the question of whether it can also be slowed, for example, by conditions that increase lifespan. Mice are particularly appealing organisms for studies of mammalian aging; however, epigenetic clocks have thus far been formulated only in humans.
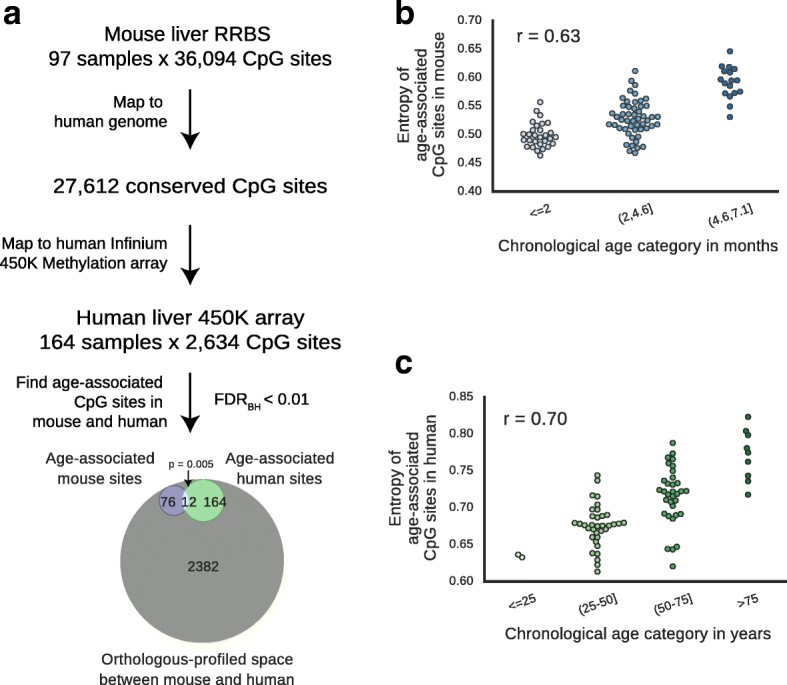
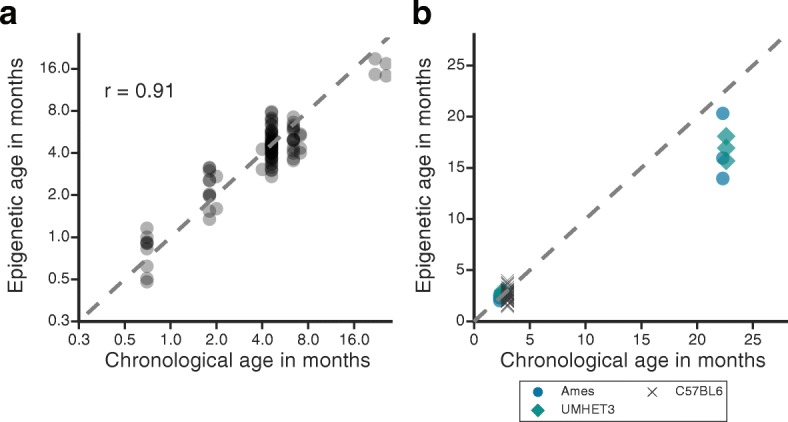
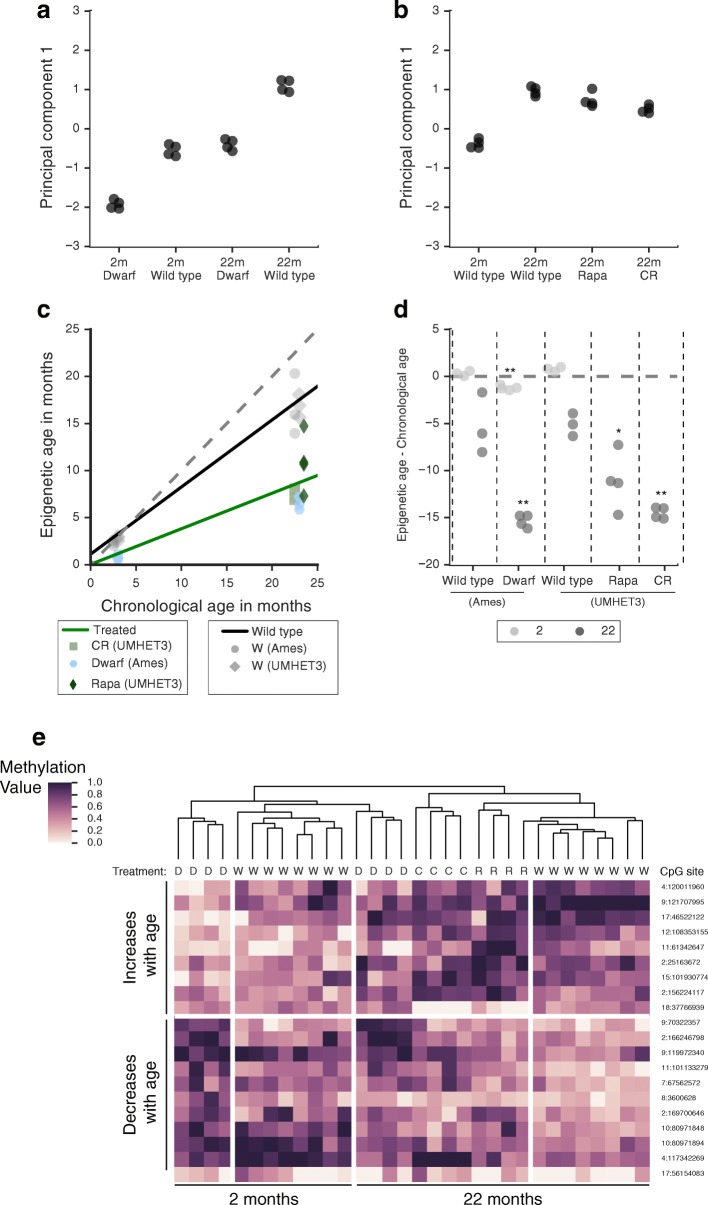
Results: We first examined whether mice and humans experience similar patterns of change in the methylome with age. We found moderate conservation of CpG sites for which methylation is altered with age, with both species showing an increase in methylome disorder during aging. Based on this analysis, we formulated an epigenetic-aging model in mice using the liver methylomes of 107 mice from 0.2 to 26.0 months old. To examine whether epigenetic aging signatures are slowed by longevity-promoting interventions, we analyzed 28 additional methylomes from mice subjected to lifespan-extending conditions, including Prop1df/df dwarfism, calorie restriction or dietary rapamycin. We found that mice treated with these lifespan-extending interventions were significantly younger in epigenetic age than their untreated, wild-type age-matched controls.
Conclusions: This study shows that lifespan-extending conditions can slow molecular changes associated with an epigenetic clock in mice livers.
Keywords: Aging; DNA methylation; Epigenetic aging; Epigenomics.
Figures
Similar articles
-
Diverse interventions that extend mouse lifespan suppress shared age-associated epigenetic changes at critical gene regulatory regions.Genome Biol. 2017 Mar 28;18(1):58. doi: 10.1186/s13059-017-1185-3. Genome Biol. 2017. PMID: 28351383 Free PMC article.
-
A multi-tissue full lifespan epigenetic clock for mice.Aging (Albany NY). 2018 Oct 21;10(10):2832-2854. doi: 10.18632/aging.101590. Aging (Albany NY). 2018. PMID: 30348905 Free PMC article.
-
Hepatic gene body hypermethylation is a shared epigenetic signature of murine longevity.PLoS Genet. 2018 Nov 21;14(11):e1007766. doi: 10.1371/journal.pgen.1007766. eCollection 2018 Nov. PLoS Genet. 2018. PMID: 30462643 Free PMC article.
-
The role of DNA methylation in epigenetics of aging.Pharmacol Ther. 2019 Mar;195:172-185. doi: 10.1016/j.pharmthera.2018.11.001. Epub 2018 Nov 9. Pharmacol Ther. 2019. PMID: 30419258 Free PMC article. Review.
-
Epigenetic Clock: Just a Convenient Marker or an Active Driver of Aging?Adv Exp Med Biol. 2019;1178:175-206. doi: 10.1007/978-3-030-25650-0_10. Adv Exp Med Biol. 2019. PMID: 31493228 Review.
Cited by
-
Growth Hormone and Aging: New Findings.World J Mens Health. 2021 Jul;39(3):454-465. doi: 10.5534/wjmh.200201. Epub 2021 Feb 3. World J Mens Health. 2021. PMID: 33663025 Free PMC article. Review.
-
Epigenetic aging studies of pair bonding in prairie voles.Sci Rep. 2024 Jul 29;14(1):17439. doi: 10.1038/s41598-024-67641-2. Sci Rep. 2024. PMID: 39075111 Free PMC article.
-
Impact of Growth Hormone-Related Mutations on Mammalian Aging.Front Genet. 2018 Nov 27;9:586. doi: 10.3389/fgene.2018.00586. eCollection 2018. Front Genet. 2018. PMID: 30542372 Free PMC article. Review.
-
Epigenetic age-predictor for mice based on three CpG sites.Elife. 2018 Aug 24;7:e37462. doi: 10.7554/eLife.37462. Elife. 2018. PMID: 30142075 Free PMC article.
-
Pleiotropic influence of DNA methylation QTLs on physiological and ageing traits.Epigenetics. 2023 Dec;18(1):2252631. doi: 10.1080/15592294.2023.2252631. Epigenetics. 2023. PMID: 37691384 Free PMC article.
References
Publication types
MeSH terms
Substances
Grants and funding
LinkOut - more resources
Full Text Sources
Other Literature Sources
Medical
Miscellaneous
