. 2017 Feb 13:8:14392.
doi: 10.1038/ncomms14392.

IFI16 and cGAS cooperate in the activation of STING during DNA sensing in human keratinocytes

Affiliations

IFI16 and cGAS cooperate in the activation of STING during DNA sensing in human keratinocytes

Jessica F Almine et al. Nat Commun. .

Abstract

Many human cells can sense the presence of exogenous DNA during infection though the cytosolic DNA receptor cyclic GMP-AMP synthase (cGAS), which produces the second messenger cyclic GMP-AMP (cGAMP). Other putative DNA receptors have been described, but whether their functions are redundant, tissue-specific or integrated in the cGAS-cGAMP pathway is unclear. Here we show that interferon-γ inducible protein 16 (IFI16) cooperates with cGAS during DNA sensing in human keratinocytes, as both cGAS and IFI16 are required for the full activation of an innate immune response to exogenous DNA and DNA viruses. IFI16 is also required for the cGAMP-induced activation of STING, and interacts with STING to promote STING phosphorylation and translocation. We propose that the two DNA sensors IFI16 and cGAS cooperate to prevent the spurious activation of the type I interferon response.


Conflict of interest statement

The authors declare no competing financial interests.

Figures
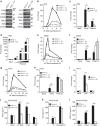
Figure 1
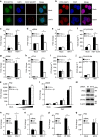
Figure 1. IFI16 is required for DNA but not RNA sensing in HaCaT keratinocytes.
(a) Immunoblot analysis of wild-type (IFI16 +/+) HaCaT and two IFI16 −/− HaCaT clones. (bi) Quantitative real-time PCR (qRT-PCR) analysis of mRNA expression levels normalized to β-actin mRNA and mock transfection in IFI16 +/+ and IFI16 −/− HaCaT cells, as indicated. (b) qRT-PCR analysis of IFN-β mRNA expression in IFI16+/+ and two IFI16 −/− HaCaT cells clones transfected with 1 μg ml−1 HT DNA for the times indicated. (c) qRT-PCR analysis of IFN-β mRNA 6 h post transfection with 1 μg ml−1 of a 70nt dsDNA oliogonucleotide (70mer) or circular pcDNA3.1 plasmid. (d) IFN-β mRNA induction 6 h after transfection with 1, 10 or 100 ng ml−1 poly(I:C). (e) Time course of ISG56 mRNA expression following transfection with 1 μg ml−1 HT DNA. (f) ISG56 mRNA expression 6 h post transfection with 1 μg ml−1 70mer oligonucleotide or 100 ng ml−1 poly(I:C). (g) qRT-PCR analysis of CCL5 mRNA expression following transfection with 1 μg ml−1 HT DNA for the times indicated. (h) Relative CCL5 mRNA expression levels 6 h post transfection with 1 μg ml−1 70mer oligonucleotide or 100 ng ml−1 poly(I:C). (i) CCL5 mRNA expression levels 6 h post transfection with 1 μg ml−1 of Y-G3 or Y-C3 oligonucleotides. (j) Secreted CCL5 (Rantes) protein detected by ELISA in the supernatants of IFI16 +/+ or IFI16 −/− HaCaT cells transfected with 1 μg ml−1 HT DNA, Y-G3 or Y-C3 DNA for 24 h. (k) ELISA quantitation of CCL5 protein in supernatants from IFI16 +/+ and IFI16 −/− HaCaT cells stimulated with 5 μg ml−1 extracellular (EC) poly(I:C) added to the medium for 24 h. (l) ELISA quantitation of CXCL10 (IP-10) protein in supernatants of IFI16 +/+ or IFI16 −/− HaCaT cells transfected with 1 μg ml−1 70mer oligonucleotide or HT DNA. All qRT-PCR and ELISA data are presented as mean values of biological triplicates. Error bars indicate s.d. *P<0.05, **P<0.01, ***P<0.001 Student's t-test. Data are representative of at least two experiments in two independent IFI16-deficient cell clones.
Figure 2
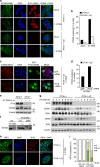
Figure 2. IFI16 is required for the innate immune response to DNA viruses.
(a) Confocal imaging of HaCaT cells infected with VACV-A3-RFP (MOI=0.1) for 24 h and stained with FITC-labelled IFI16 antibody (green). A3-RFP is shown in red, DNA is stained with DAPI (blue). (b) Confocal imaging of HaCaT cells infected with HSV-1 (MOI=1) for 6 h and stained with anti-IFI16 antibody (red). DNA is visualized with DAPI (blue). Scale bars, 20 μm. (ce) qRT-PCR analysis of IFI16 +/+ and IFI16 −/− HaCaT cells infected with HSV-1 (MOI=1) for 6 h. mRNA expression levels normalized to β-actin mRNA were determined for IFNb (c), ISG56 (d) and IL6 (e). (f) Secreted CCL5 protein from HaCaT cells infected with UV inactivated HSV-1 (MOI=5) for 24 h, quantified by ELISA. (g,h) qRT-PCR analysis of ISG56 (g) and CCL5 (h) mRNA expression in HaCaT cells infected with MVA (MOI=5) for 6 h. (i) ELISA quantitation of CCL5 protein in supernatants from HaCaT cells infected with MVA (MOI=5) for 24 h. (j) ELISA analysis of CCL5 protein from HaCaT cells infected with a Sendai virus (SeV) preparation containing defective viral particles (1:2,000 dilution) for 24 h. (k,l) qRT-PCR analysis of IFNβ (k) and ISG56 (l) mRNA expression in HaCaT cells infected with Sendai virus (SeV) at dilutions of 1: 20 000, 1: 2,000 and 1:200 for 6 h. (m) Primary human keratinocytes (NHEK) were transfected with a non-targeting (NT) or IFI16-targeting siRNA pool for 48 h. Protein expression was examined by Western blotting. (n,o) NHEK were treated with siRNA pools for 48 h, and infected with HSV-1 (MOI=1) for 6 h. IFN-β (n) and IL-6 (o) mRNA expression levels were quantified by qRT-PCR. (p,q) qRT-PCR analysis of IFN-β mRNA expression in MRC-5 human embryonic lung fibroblasts treated with siRNA pools for 48 h, and transfected for 6 h with 1 μg ml−1 HT DNA (p) or 100 ng ml−1 poly(I:C) (q). Data are representative of at least two independent experiments, and presented as mean values of biological triplicates, with error bars indicating s.d. *P<0.05, **P<0.01, ***P<0.001 Student's t-test.
Figure 3
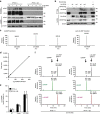
Figure 3. IFI16 is required for the DNA-induced activation of STING and IRF3.
(a) Confocal analysis of IFI16 +/+ and IFI16 −/− HaCaT cells that were mock transfected or transfected for 1 h with 5 μg ml−1 HT DNA. Cells were stained for endogenous IFI16 (red) and STING (green). DNA is visualized with DAPI (blue). (b) Cells as in (a) were observed by confocal microscopy and scored for STING clustering. At least 200 cells were counted per sample. (c) Confocal analysis of IFI16 −/− HaCaT cells reconstituted for 6 h with 1 μg ml−1 in vitro transcribed, capped and polyadenylated mRNA encoding GFP or IFI16, followed by transfection with 5 μg ml−1 HT DNA for 1 h. Cells were stained for STING (red), and DNA (DAPI, blue). GFP or AlexaFluor488-stained IFI16 are shown in green. (d) Cells as in c were scored for STING clustering, with at least 300 cells counted per sample. (e) Immunoblot analysis of HaCaT cells treated with 1 μg ml−1 HT DNA for 4 h, and probed for IFI16, STING and β-actin protein levels by Western blotting. (f) HaCaT cells were stimulated with 1 μg ml−1 HT DNA for 6 h or left untreated (UT). STING immunoprecipitates (IP) were treated with λ phosphatase where indicated, and analysed by western blotting. (g) Western blot analysis of IRF3 phosphorylation at Ser396 (pIRF3) and TBK1 phosphorylation at Ser172 (pTBK1) in HaCaT cells transfected with 1 μg ml−1 HT DNA for the times indicated. (h) HaCaT cells were transfected with 5 μg ml−1 HT DNA for 4 h, and the translocation of endogenous IRF3 was analysed by confocal microscopy. Cells were stained for IRF3 (green) and IFI16 (red), DNA is visualized with DAPI (blue). (i) Cells as in (h) were scored for predominately cytosolic (C), predominantly nuclear (N) and evenly distributed nuclear and cytosolic (N+C) localization of IRF3. At least 200 cells were counted per sample. Results are representative of at least two experiments each in two independent IFI16 −/− cell clones. Scale bars, 20 μm.
Figure 4
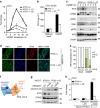
Figure 4. cGAS is required for the innate immune response to DNA in HaCaT keratinocytes.
(a) Immunoblot analysis of wild-type (WT) and cGAS −/− HaCaT cells, mock transfected or transfected with 1 μg ml−1 HT DNA for 6 h. (be) qRT-PCR analysis of cGAS +/+ and cGAS −/− HaCaT cells that were mock transfected or transfected with 1 μg ml−1 HT DNA for 6 h. mRNA levels were normalized to β-actin mRNA levels and mock transfections. IFNβ (b), CCL5 (c), ISG56 (d) and IL6 (e) mRNA levels are shown. (f) qRT-PCR analysis CCL5 mRNA from cGAS +/+ and cGAS −/− HaCaT cells infected with MVA (MOI=5) for 6 h. (g) HEK293T cells were transfected with a firefly luciferase reporter construct under the control of the IFN-β promoter, a Renilla luciferase transfection control, 10 ng STING-Flag plasmid, 1 ng cGAS-Flag and 35 or 70 ng HA-IFI16 expression plasmids, as indicated. Firefly luciferase activity was measured 24 h post transfection, and normalized to Renilla luciferase activity. (h) HEK293T cells were transfected with a firefly luciferase reporter construct under the control of the IFNβ promoter, Renilla luciferase transfection control and 10 ng STING-Flag expression plasmid. In addition, 1 or 5 ng cGAS or TRIF expression constructs were co-expressed with 35 ng HA-IFI16 plasmid or empty vector, as indicated. Relative Firefly luciferase activity was quantified 24 h post transfection. Data are representative of at least three independent experiments, and presented as mean values of triplicate samples. Error bars indicate s.d. *P<0.05, **P<0.01, ***P<0.001 Student's t-test.
Figure 5
Figure 5. IFI16 interacts with cGAS but does not affect cGAMP production.
(a) IFI16 +/+ or IFI16 −/− HaCaT cells were stimulated with 5 μg ml−1 HT DNA for the times indicated, and IFI16 was immunoprecipitated from cell lysates. Lysates and immunoprecipitates (IP) were analysed by SDS–PAGE and western blotting. (b) HEK293T cells were transfected with constructs for the expression of cGAS-FLAG and HA-IFI16, either wild-type (wt) or DNA-binding mutant (m4), as indicated. 24 h post transfection, cells were subjected to lysis and immunoprecipitation using FLAG antibody. Immunoprecipitates were washed, and treated with benzonase where indicated. Lysates and immunoprecipitates (IP) were analysed by SDS–PAGE and western blotting. (c) Multiple reaction monitoring transitions for cGAMP and cyclic di-AMP, used for the quantification of endogenous cGAMP and internal standard cyclic di-AMP. m/z, mass/charge ratio of fragment ions. (d) Standard curve for synthetic cGAMP spiked into cell lysates before sample preparation and liquid chromatography and mass spectrometry (LC-MS) analysis. (e) IFI16 +/+ and IFI16 −/− HaCaT cells were treated with 1 μg ml−1 70mer oligonucleotide or HT DNA for 8 h, followed by lysis in methanol, spike-in of c-di-AMP and sample preparation. cGAMP levels were determined by LC-MS, and normalized to c-di-AMP levels to account for losses in sample preparation and injection. Data are representative of at least four experiments; values are shown as mean of triplicate samples, with error bars representing s.d. (f) Total and extracted ion chromatogram of cGAMP and cyclic di-AMP in representative samples from (e), showing IFI16 +/+ and IFI16 −/− cells treated with HT DNA for 8 h. AA, integral peak area; RT, retention time.
Figure 6
Figure 6. IFI16 is required for cGAMP-induced STING activation.
(a) IFI16 +/+ and IFI16 −/− HaCaT cells were transfected with 20 μg ml−1 synthetic cGAMP, and CCL5 mRNA induction was analysed by qRT-PCR at the time points indicated, and normalized to β-actin mRNA. (b) IFI16 +/+ and IFI16 −/− HaCaT cells were infused with 15 μM cGAMP by digitonin-mediated permeabilization, and CCL5 protein in supernatants was quantified by ELISA 24 h post stimulation. (c) HaCaT cells were permeabilized with digitonin and infused with 15 μM cGAMP for 2, 4 or 6 h. Phosphorylation of STING, of IRF3 at Ser396 (pIRF3) and TBK1 at Ser172 (pTBK1) was analysed by SDS–PAGE and western blotting. (d) HaCaT cells were transfected with 20 μg ml−1 cGAMP for 4 h, and the translocation of endogenous IRF3 was observed by confocal microscopy. Cells were stained for IRF3 (green), IFI16 (red) and DNA (DAPI, blue). Scale bar, 20 μm. (e) Cells as in d were scored for predominantly cytosolic (C), predominantly nuclear (N) and evenly distributed nuclear and cytosolic (N+C) localization of IRF3. At least 200 cells were counted per sample. (f) Schematic representation of the co-culture of HaCaT cells with cGAS-expressing HEK293T cells. Endogenously produced cGAMP can diffuse through gap junctions from the cGAS-expressing producer HEK293T cells to HaCaT cells, where it can bind STING to induce an innate immune response. (g,h) HEK293T cells were transiently transfected with a cGAS-FLAG expression construct or empty vector (EV) for 6 h, then co-cultured with IFI16 +/+ or IFI16 −/− HaCaT cells for 18 h. (g) Immunoblot analysis of cGAS-FLAG, IFI16 and STING protein expression in the co-culture. (h) qRT-PCR analysis of CCL5 mRNA expression in IFI16 +/+ or IFI16 −/− HaCaT cells grown in monoculture (−) or co-cultured with HEK293T cells expressing cGAS-FLAG or empty vector (EV). Data show means of triplicate samples with s.d. Shown are representatives of at least two independent experiments each in two IFI16 −/− cell clones.
Figure 7
Figure 7. IFI16 acts on STING to promote its activation by cyclic di-nucleotides.
(a) IFI16 +/+ or IFI16 −/− HaCaT cells were permeabilized with digitonin and infused with 15 μM cGAMP or its non-hydrolysable analogue cGAM(PS)2 for 6 h. CCL5 mRNA expression was analysed by qRT-PCR. (b) Cells were permeabilized and infused with 15 μM cGAMP or cGAM(PS)2 for 4 h, and lysates were analysed by western blotting for phosphorylation of STING, TBK1 at Ser172 (pTBK1) and IRF3 at Ser396 (pIRF3). (c) Cells were transfected with 100 μg ml−1 cyclic di-AMP for 6 h, and IFN-β mRNA levels were quantified by qRT-PCR. (d) STING was immunoprecipitated from HaCaT cells transfected with 5 μg ml−1 HT DNA for the times indicated. Lysates and immunoprecipitates (IP) were analysed by SDS–PAGE and western blotting. (e) HEK293T cells were transfected with a firefly luciferase reporter construct under the control of the IFNβ promoter, a Renilla luciferase transfection control, 2 ng STING-FLAG plasmid and 150 ng empty vector (EV) or IFI16 expression constructs as indicated: full-length IFI16 (fl), the IFI16 HINb domain (HINb), or the IFI16 pyrin domain (PYD). Firefly luciferase activity was measured 24 h post transfection, and normalized to Renilla luciferase activity. Data are representative of at least two independent experiments. qRT-PCR and luciferase data are expressed as means of triplicate samples; error bars represent s.d. *P<0.05, **P<0.01, ***P<0.001 Student's t-test.

Similar articles

Cited by

References

    1. Nestle F. O., Di Meglio P., Qin J.-Z. & Nickoloff B. J. Skin immune sentinels in health and disease. Nat. Rev. Immunol. 9, 679–691 (2009). - PMC - PubMed
    1. Sparrer K. M. J. & Gack M. U. Intracellular detection of viral nucleic acids. Curr. Opin. Microbiol. 26, 1–9 (2015). - PMC - PubMed
    1. Sun L., Wu J., Du F., Chen X. & Chen Z. J. Cyclic GMP-AMP synthase is a cytosolic DNA sensor that activates the type I interferon pathway. Science 339, 786–791 (2013). - PMC - PubMed
    1. Li X.-D. et al.. Pivotal roles of cGAS-cGAMP signaling in antiviral defense and immune adjuvant effects. Science 341, 1390–1394 (2013). - PMC - PubMed
    1. Zhang X. et al.. Cyclic GMP-AMP containing mixed phosphodiester linkages is an endogenous high-affinity ligand for STING. Mol Cell 51, 226–235 (2013). - PMC - PubMed

Publication types

MeSH terms