. 2017 Mar;23(3):291-300.
doi: 10.1038/nm.4285. Epub 2017 Feb 13.

Molecular definition of a metastatic lung cancer state reveals a targetable CD109-Janus kinase-Stat axis

Affiliations

Molecular definition of a metastatic lung cancer state reveals a targetable CD109-Janus kinase-Stat axis

Chen-Hua Chuang et al. Nat Med. 2017 Mar.

Abstract

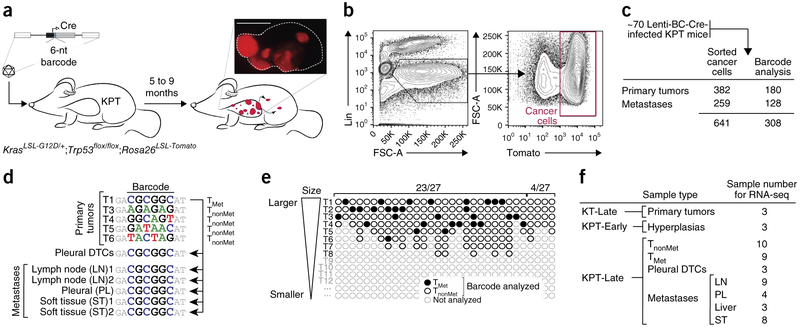
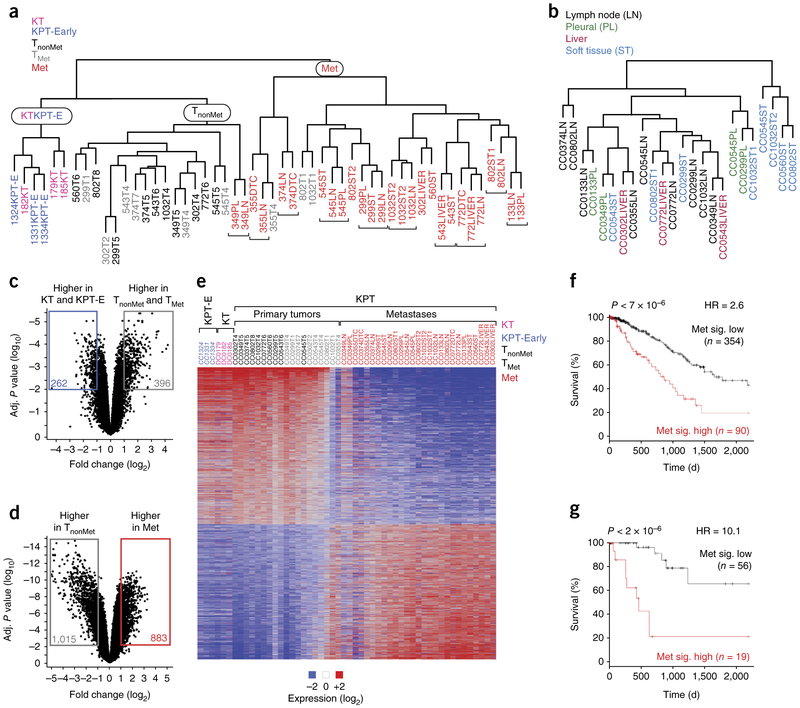
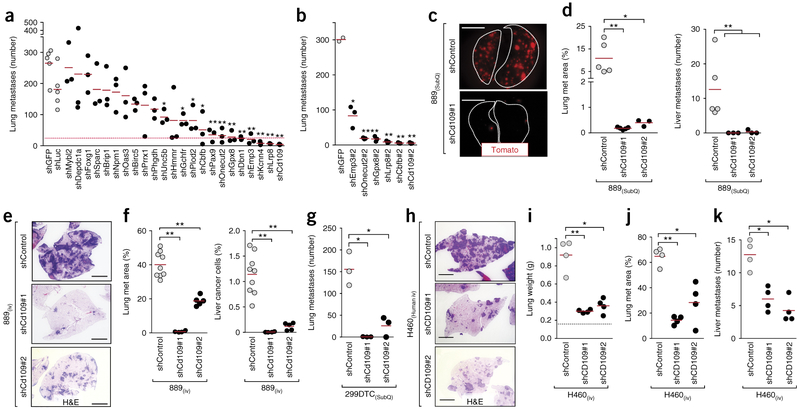
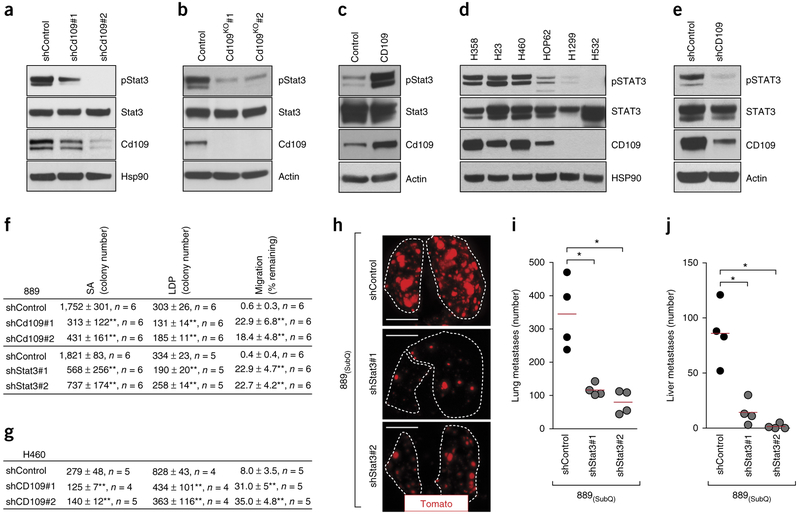
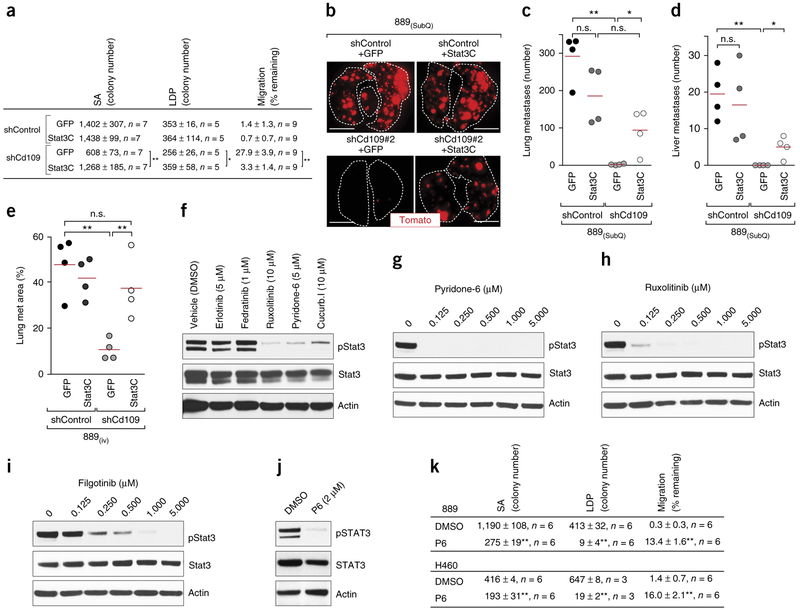
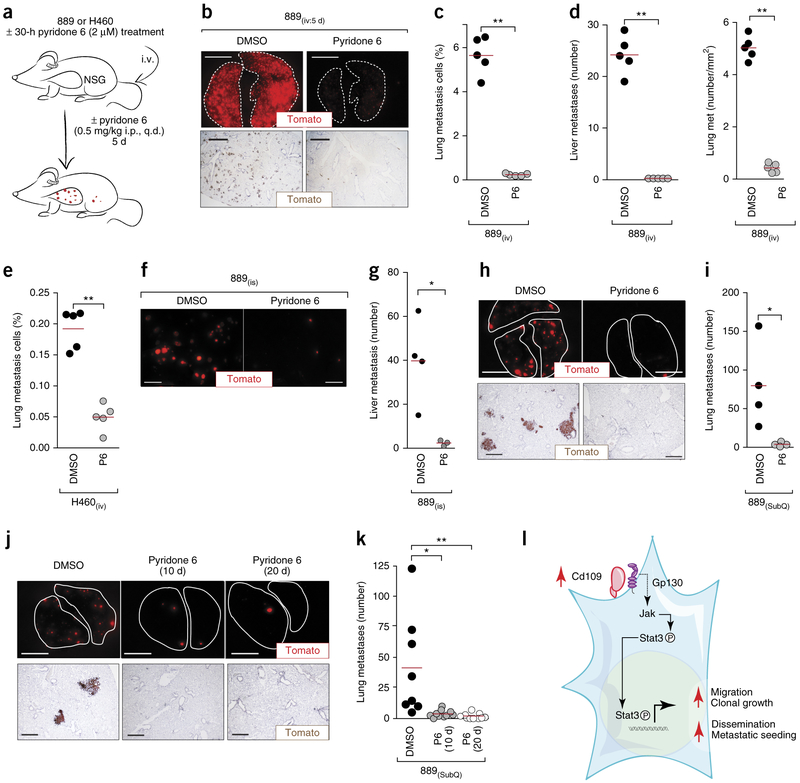
Lung cancer is the leading cause of cancer deaths worldwide, with the majority of mortality resulting from metastatic spread. However, the molecular mechanism by which cancer cells acquire the ability to disseminate from primary tumors, seed distant organs, and grow into tissue-destructive metastases remains incompletely understood. We combined tumor barcoding in a mouse model of human lung adenocarcinoma with unbiased genomic approaches to identify a transcriptional program that confers metastatic ability and predicts patient survival. Small-scale in vivo screening identified several genes, including Cd109, that encode novel pro-metastatic factors. We uncovered signaling mediated by Janus kinases (Jaks) and the transcription factor Stat3 as a critical, pharmacologically targetable effector of CD109-driven lung cancer metastasis. In summary, by coupling the systematic genomic analysis of purified cancer cells in distinct malignant states from mouse models with extensive human validation, we uncovered several key regulators of metastatic ability, including an actionable pro-metastatic CD109-Jak-Stat3 axis.


Figures

Figure 1
Figure 1
Design, barcode analysis, and isolation of samples for gene expression profiling from different stages of metastatic progression. (a) Tumor initiation in KrasLSL-G12D/+;Trp53flox/flox;Rosa26LSL-Tomato (KPT) mice with a pool of barcoded Cre-expressing lentiviral vectors (Lenti-BC-Cre). Lung tumors were uniquely barcoded and stably expressed a fluorescent marker. Scale bar, 5 mm. (b) Representative plots showing sequential gating on dissociated tumor cells to allow FACS-based isolation of purified cancer cells. FSC-A, forward scatter. (c) Numbers of tumors from which cancer cells were isolated and on which barcode amplification and sequencing were performed. (d) Example of barcode analysis of primary tumors (T), disseminated tumor cells from the pleural cavity (DTCs), and metastases from a single mouse that identifies nonmetastatic primary tumors (TnonMet) and a metastatic primary tumor (TMet). (e) Depiction of 31 TMet (black-filled circles) and 149 TnonMet (black-open circles) tumors analyzed from 31 mice with metastatic lesions. Each mouse had many more tumors than we analyzed (light gray open circles). In 27 of 31 mice, we identified one or more TMet tumors. In 23 of 27 mice with metastases, all of the metastases were from a single TMet tumor. In four mice, we identified metastases with two unique barcodes and also found both TMet tumors (mice with two black filled-in circles). (f) Samples for RNA-seq-based gene expression analysis. KT-Late samples are tumors from KrasLSL-G12D/+;Rosa26LSL-Tomato (KT) mice 6–7 months after tumor initiation. KPT-Early (KPT-E) samples are neoplastic cells from KPT mice 10 weeks after tumor initiation. LN, lymph node; PL, pleura; ST, soft tissue.
Figure 2
Figure 2
Lung tumors undergo stepwise changes in gene expression programs during metastatic progression. (a) Clustering analysis of all samples identified three major groups: one with only KT and KPT-E samples, one with all TnonMet samples, and one with almost all (>90%) metastases. Adjacent clonally related metastases are indicated with brackets. (b) Clustering of metastases samples after the gene expression differences that drive clustering of clonally related metastases are removed. (c,d) Robust and conserved changes in gene expression between KT and KPT-E versus primary tumor samples (TnonMet and TMet) (c) and between TnonMet and Met samples (d). The number of genes with >2-fold difference and an adjusted P < 0.01 between groups is indicated. (e) Heat map of genes that are differentially expressed (fold change > 2, adjusted P < 0.01) between TnonMet and Met samples. These samples were not clustered on the basis of their gene expression but rather were arranged by group. For all primary tumors, we dissociated the entire tumor before FACS-based purification of the Tomato+ cancer cells (as opposed to only isolating cells from one part of the tumor). Therefore, the gene expression profile is an average of the entire tumor. Two clonally related metastases 349LN and 349PL were unlike the other metastases. (f,g) Outcome of patients with lung adenocarcinoma after stratification based on a gene expression signature generated by comparing TnonMet to Met samples (Met sig.). Analysis of 444 unselected patients (f) and 75 patients with KRAS-mutant tumors (g) from TCGA. P values, hazard ratios (HR), and number of patients in each group are indicated.
Figure 3
Figure 3
In vivo functional screening identifies CD109 as a driver of metastatic ability. (a,b) Effect of stable knockdown of the expression of each candidate gene on metastatic ability (a) and confirmation with a second shRNA specific for six genes of interest (b). The dashed pink line represents a 90% reduction in metastatic ability relative to that of control shGFP-expressing and shLuciferase (shLuc)-expressing tumors. The number of metastases in mice with subcutaneous tumors of each genotype is shown. Each dot represents a mouse, and the bar denotes the mean. *P < 0.05 and **P < 0.01. (c) Representative images, taken on a fluorescence dissecting scope, of the lungs from mice with shControl- or shCd109-expressing subcutaneous (SubQ) tumors. Lung lobes are outlined with a white dashed lines. Scale bars, 5 mm. (d) Lung metastasis area (left) and liver metastases number (right) in mice with SubQ tumors expressing shControl or shCd109. Each dot represents a mouse, and the bar denotes the mean. *P < 0.05 and **P < 0.01. (e) Representative lung histology 12 d after intravenous (i.v.) transplantation of 889 cells expressing a control shRNA or either of two shRNAs specific for Cd109. H&E, hematoxylin and eosin. Scale bars, 2 mm. (f) Lung metastasis area quantified by histology (left) and quantification of micrometastatic cancers in the liver by flow cytometry (right). Each dot represents a mouse, and the bar denotes the mean. **P < 0.001. (g) Lung metastasis area in mice with shControl- or shCd109-expressing SubQ tumors generated from a second mouse lung adenocarcinoma cell line (299DTC). Each dot represents a mouse, and the bar denotes the mean. *P < 0.01. (h) Representative lung histology 28 d after i.v. transplantation of shControl- or shCD109-expressing H460 human lung cancer cells. Scale bars, 2 mm. (ik) Lung weight (i), lung metastasis area (j), and number of liver metastases (k) after i.v. transplantation of shControl- or shCD109-expressing H460 cells. Normal lung weight is indicated by a dashed line (i). Each dot represents a mouse, and the bar denotes the mean. *P < 0.01 and **P < 0.001. All P values were calculated by an unpaired Student’s t-test.
Figure 4
Figure 4
CD109 regulates Stat3 activity to drive malignant cellular phenotypes and metastatic ability. (a,b) Representative western blot analysis (of n = 2) for Tyr705 phosphorylation of Stat3 (pStat3) in shControl- or shCD109-expressing 889 cells (a) or in parental 889 cells (control) or 889 cells in which Cd109 was knocked out (KO) (b). Hsp90 and actin were used as loading controls. (c) Representative western blot analysis (of n = 2) for pStat3 on a mouse embryonic fibroblast cell line stably expressing Cd109. Actin was used as a loading control. (d) Representative western blot analysis (of n = 2) for pSTAT3 and CD109 on a panel of human lung adenocarcinoma cell lines. HSP90 was used as a loading control. (e) Representative western blot analysis for (of n = 2) pSTAT3 and CD109 on human H460 cells without (control) or with CD109 knockdown. Actin was used as a loading control. (f) Clonal growth and migration of 889 cells without (control) or with either Cd109 knockdown or Stat3 knockdown. Clonal growth was assessed in anchorage-independent conditions in soft agar (SA) and in tissue culture low-density-plating (LDP) conditions. Migration was assessed using a scratch assay, and the percentage of gap remaining after 16 h is indicated. Data from two independent experiments are presented as mean ± s.d. The n value per group is indicated. **P < 0.001. (g) Clonal growth and migration of H460 cells without (control) or with CD109 knockdown. Data from two independent experiments are presented as mean ± s.d. The n value per group is indicated. **P < 0.001. (h) Representative fluorescence images showing the lung metastases from mice with SubQ tumors in which Stat3 was knocked down or not (control). Lung lobes are outlined with a white dotted line. Scale bars, 5 mm. (i,j) Number of lung (i) and liver (j) metastases in mice without (control) or with Stat3 knockdown in the SubQ tumors. Each dot represents a mouse, and the bar denotes the mean. *P < 0.01. All P values were calculated by unpaired Student’s t-test.
Figure 5
Figure 5
Jak–Stat3 signaling is a critical pro-metastatic effector of Cd109. (a) Clonal growth and migration of shControl- or shCd109-expressing 889 cells without (GFP) or with expression of hyper-activatable Stat3 (Stat3C). Data from two independent experiments are presented as mean ± s.d. The n value per group is indicated. *P < 0.01 and **P < 0.001. (b) Representative fluorescence images of the lungs from mice with subcutaneous (SubQ) tumors from the indicated cell lines. Scale bars, 5 mm. (c,d) Numbers of lung (c) and liver (d) metastases from SubQ tumors. Each dot represents a mouse, and the bar denotes the mean. *P < 0.05 and **P < 0.01. (e) Lung metastasis area, as quantified by histology, in mice after intravenous (i.v.) transplantation of the indicated cell lines. Each dot represents a mouse, and the bar denotes the mean. *P < 0.05 and **P < 0.01; n.s., not significant. (f) Representative western blot analysis (of n = 2) for pStat3 in 3T3-Cd109 cells that were treated with DMSO (vehicle control), an epidermal growth factor receptor inhibitor (erlotinib), a Jak2 inhibitor (fedratinib) or the broadly acting Jak kinase inhibitors ruxolitinib, pyridone 6 and cucurbitacin I. Actin was used as a loading control. (gi) Western blot analyses for pStat3 in 889 cells that were treated with a titration of pyridone 6 (g), ruxolitinib (h) or filgotinib (i). Actin was used as a loading control. (j) Representative western blot analysis (of n = 2) for pSTAT3 in human H460 cells that were treated with 2 μM pyridone 6 (P6). Actin was used as a loading control. (k) Clonal growth and migration ability of 889 and H460 cells that were treated with 2 μM pyridone 6. Data from two independent experiments are presented as mean ± s.e.m. **P < 0.001. All P values were calculated by an unpaired Student’s t-test.
Figure 6
Figure 6
Pharmacological inhibition of Jak–Stat signaling inhibits metastatic ability of lung adenocarcinoma cells. (a) Outline of in vivo Jak kinase inhibitor (pyridone 6) treatments. Immunodeficient NOD–Scid–Il2rg-deficient (NSG) mice were injected intravenously (i.v.) with mouse 889 or human H460 cells ± pyridone 6 pretreatment. Mice were treated daily with pyridone 6 or vehicle (DMSO), administered intraperitoneally (i.p.). (b) Representative fluorescence (top) and immunohistochemistry (bottom) images of Tomato expression in the lungs of NSG mice 5 d after i.v. transplantation of 889 cells. Scale bars, 5 mm (top) and 1 mm (bottom). (c) Quantification of cells in lung metastases by flow cytometry. **P < 0.001. (d) Quantification of Tomato+ micro-metastases by direct fluorescence imaging and histology in liver (left) and lung (right) of recipient mice. **P < 0.001. (e) Quantification of cells in the lung 5 d after i.v. transplantation of human H460 cells by flow cytometry. (f) Representative fluorescence images of liver metastases 12 d after intrasplenic (i.s.) transplantation of 889 cells. Scale bars, 2 mm. (g) Quantification of liver metastases by direct counting. *P < 0.01. (h) Representative fluorescence (top) and histology (bottom) images of the lungs from mice with SubQ 889 tumors after treatment with or without pyridone 6. Lung lobes are outlined with a dashed line. Scale bars, 5 mm (top) and 500 μm (bottom). (i) Quantification of lung metastases by direct counting. *P < 0.05. (j) Representative fluorescence (top) and histology (bottom) images of the lungs from mice in which SubQ tumors were removed at day 10 and metastases were assessed at day 20, with Jak kinase inhibition for either the first 10 d or the entire 20 d. Lung lobes are outlined with a dashed line. Scale bars, 5 mm (top) and 500 μm (bottom). (k) Quantification of metastases by direct counting. *P < 0.05 and **P < 0.01. (I) Model of the Cd109-driven metastatic state. In all plots, each dot represents a mouse, and the bar denotes the mean. All P values were calculated by an unpaired Student’s t-test.

Comment in

Similar articles

Cited by

References

    1. Nguyen DX, Bos PD & Massagué J Metastasis: from dissemination to organ-specific colonization. Nat. Rev. Cancer 9, 274–284 (2009). - PubMed
    1. Massagué J & Obenauf AC Metastatic colonization by circulating tumor cells. Nature 529, 298–306 (2016). - PMC - PubMed
    1. Winslow MM et al. Suppression of lung adenocarcinoma progression by Nkx2-1. Nature 473, 101–104 (2011). - PMC - PubMed
    1. Bos PD et al. Genes that mediate breast cancer metastasis to the brain. Nature 459, 1005–1009 (2009). - PMC - PubMed
    1. Nguyen DX et al. WNT–TCF signaling through LEF1 and HOXB9 mediates lung adenocarcinoma metastasis. Cell 138, 51–62 (2009). - PMC - PubMed

MeSH terms