. 2017 Jan 19;18(1):4.
doi: 10.1186/s13059-016-1137-3.

Transcriptomic signatures differentiate survival from fatal outcomes in humans infected with Ebola virus

Affiliations

Transcriptomic signatures differentiate survival from fatal outcomes in humans infected with Ebola virus

Xuan Liu et al. Genome Biol. .

Abstract

Background: In 2014, Western Africa experienced an unanticipated explosion of Ebola virus infections. What distinguishes fatal from non-fatal outcomes remains largely unknown, yet is key to optimising personalised treatment strategies. We used transcriptome data for peripheral blood taken from infected and convalescent recovering patients to identify early stage host factors that are associated with acute illness and those that differentiate patient survival from fatality.

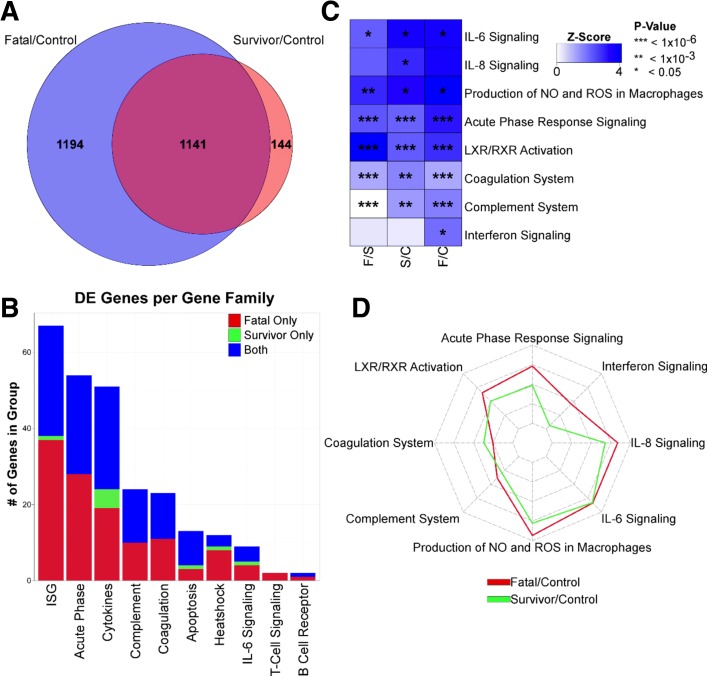
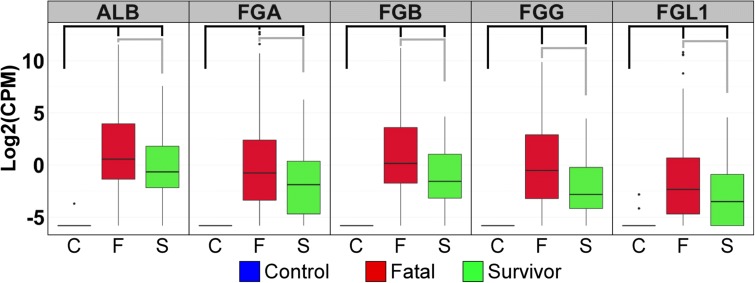
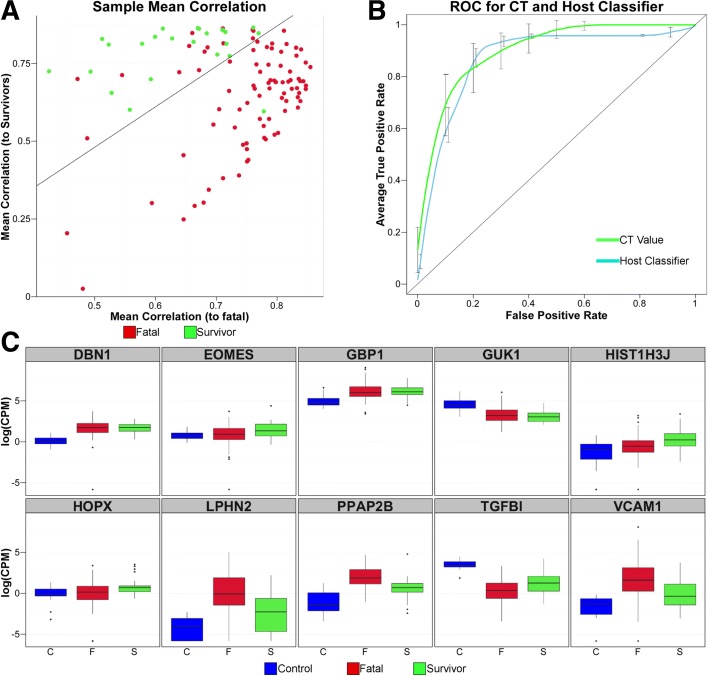
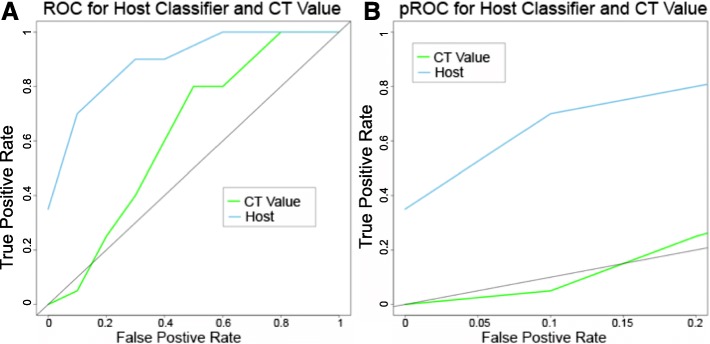
Results: The data demonstrate that individuals who succumbed to the disease show stronger upregulation of interferon signalling and acute phase responses compared to survivors during the acute phase of infection. Particularly notable is the strong upregulation of albumin and fibrinogen genes, which suggest significant liver pathology. Cell subtype prediction using messenger RNA expression patterns indicated that NK-cell populations increase in patients who survive infection. By selecting genes whose expression properties discriminated between fatal cases and survivors, we identify a small panel of responding genes that act as strong predictors of patient outcome, independent of viral load.

Conclusions: Transcriptomic analysis of the host response to pathogen infection using blood samples taken during an outbreak situation can provide multiple levels of information on both disease state and mechanisms of pathogenesis. Host biomarkers were identified that provide high predictive value under conditions where other predictors, such as viral load, are poor prognostic indicators. The data suggested that rapid analysis of the host response to infection in an outbreak situation can provide valuable information to guide an understanding of disease outcome and mechanisms of disease.


Figures

Fig. 1
Fig. 1
The sample selection criteria based on correlation value to within group expression. A mean correlation within the acute fatal (a) and acute survivors (b) was used to determine samples with evidence of unreliable sequencing. A cut-off value of 0.8 was used (dashed line) and samples that fell below this within-group mean correlation were removed from analysis. This led to selection of 88 acute fatal samples and 24 acute survivors
Fig. 2
Fig. 2
Host transcriptional responses in acute EBOV infection. a Venn diagram representing genes that are differentially expressed from control to fatal (blue) and control to survivor (red). Shared genes are shown in magenta. b Histogram illustrating genes increased in abundance in different functional groups. Genes significantly increased in abundance in fatal only (red), survival only (green) or in both (blue) are shown. c Heatmap of pathway upregulation intensity calculated by Ingenuity Pathway Analysis (IPA) for acute-fatal to convalescent control (F/C), acute-survivor to convalescent control (S/C) and acute-fatal to acute-survivor (F/S). Stars within boxes represent calculated p value significance of increased abundance (* < 0.05, ** < 10–3, *** < 10–6). d Spider plot of the z scores from the IPA. Increased abundance in fatal to control is in red, survival to control in green
Fig. 3
Fig. 3
Coagulation associated mRNAs accumulate in the blood of EBOV-infected patients. Box and whisker plots illustrate the expression of the top acute phase genes that are differentially expressed between controls (blue), fatal (red), and survivors (green) based on log2 fold change. From left to right, the graphs illustrate mRNA expression for albumin (ALB), fibrinogen alpha (FGA), fibrinogen beta (FGB), fibrinogen gamma (FGG) and fibrinogen gamma-like 1 (FGL1). Black brackets indicate significance between control and survivor or fatal levels and grey brackets indicate significance level between survivors and those who will succumb to disease. All brackets represent a log2(fold change) > 2 and FDR < 5 %
Fig. 4
Fig. 4
Comparison of the convalescent survivors to healthy controls. The healthy controls comprised a group of healthy volunteers in British Colombia and were found in GEO under GSE53655. a The top fold change differentially expressed genes when comparing convalescence survivors (blue) to acute infections and when comparing acute survivor (green) to acute fatal (red). Healthy controls are shown (purple). The healthy controls show no significant expression of these genes similar to the convalescent survivors. b The comparison of the two control groups as a PCA plot of their overall expression values after normalisation using edgeR. The healthy controls are indicated in blue and the convalescent survivors in red. c The results of the gene set enrichment analysis comparing the convalescent survivors to the healthy controls. Genes significantly upregulated are in red and downregulated in blue. Through a Fisher’s exact test, no group of genes had a significant enrichment when comparing the two groups (p cutoff of 0.05)
Fig. 5
Fig. 5
Differentially abundant cell types present in human blood samples. a Relative abundance of specific T cell types with acute-fatal on the left of the heatmap and acute-survivor on the right as predicted by DCQ compared to convalescent survivors. Within the heatmap, darker blue represents a decrease in the abundance of a given cell type and darker red represents an increase in the abundance of a given cell type. The colour bar on the left is showing if the given cell type is significantly differentially abundant (greater than or less than 0 with a p value < 0.05) in acute-survivors only (green), acute-fatal only (red) or both (blue). b Similar heatmap for dendritic cell types and (c) is for natural killer cell types. Loss of circulating monocytes characterises fatal EVD. d Box and whisker plots depicting frequencies of peripheral blood monocytes in fatal EVD patients (black), EVD survivors (blue), malaria patients (brown) and other febrile patients (green) as shown by FACS. Horizontal bars represent median values and the edge of the boxes represent 10–90 percentiles. Statistical analysis was performed via non-parametric Kruskal–Wallis test followed by Dunn’s post-test. ns non-significant, *p ≤ 0.05. e Correlation analysis indicating positive correlation between frequency of CD14+ monocytes and the Ct values. Non-parametric Spearman’s rank correlation analysis was performed. The line indicates a linear regression
Fig. 6
Fig. 6
Identification and testing of a small set of host mRNAs whose expression predicts survival during acute EBOV infection. a Mean correlation plots where each sample is represented. Survivors in green, fatal in red. Line indicates prediction inflection point. Individuals above the line would be predicted to be survivors using these mRNAs, while individuals below would be predicted to succumb to the disease. b ROC comparing prediction of survival using EBOV PCR Ct value (green) and host mRNA expression classifier (blue). The error bars represent SD of the average true positive rate. c Box and whisker plots illustrating expression changes in log2(CPM) for the ten genes in the Host Classifier in control (blue), fatal (red) and survivors (green)
Fig. 7
Fig. 7
Validation of classifier in an independent dataset. The ability of the host-based classifier to predict outcome was tested in an independent dataset where the Ct values all lay between 20 and 22. a ROC showing the host-based classifier (blue) in the independent dataset compared to the Ct value (green). The line represents the line y = x which shows where the ROC falls if the predictions are equal to random selection. b pROC showing the comparison for the host classifier (blue) and Ct value (green) with a false positive rate up to 0.2. In the validation dataset, the host classifier was able to predict better than the Ct value

Similar articles

  • Different features of Vδ2 T and NK cells in fatal and non-fatal human Ebola infections.
    Cimini E, Viola D, Cabeza-Cabrerizo M, Romanelli A, Tumino N, Sacchi A, Bordoni V, Casetti R, Turchi F, Martini F, Bore JA, Koundouno FR, Duraffour S, Michel J, Holm T, Zekeng EG, Cowley L, Garcia Dorival I, Doerrbecker J, Hetzelt N, Baum JHJ, Portmann J, Wölfel R, Gabriel M, Miranda O, Díaz G, Díaz JE, Fleites YA, Piñeiro CA, Castro CM, Koivogui L, Magassouba N, Diallo B, Ruibal P, Oestereich L, Wozniak DM, Lüdtke A, Becker-Ziaja B, Capobianchi MR, Ippolito G, Carroll MW, Günther S, Di Caro A, Muñoz-Fontela C, Agrati C. Cimini E, et al. PLoS Negl Trop Dis. 2017 May 30;11(5):e0005645. doi: 10.1371/journal.pntd.0005645. eCollection 2017 May. PLoS Negl Trop Dis. 2017. PMID: 28558022 Free PMC article.
  • Infection with the Makona variant results in a delayed and distinct host immune response compared to previous Ebola virus variants.
    Versteeg K, Menicucci AR, Woolsey C, Mire CE, Geisbert JB, Cross RW, Agans KN, Jeske D, Messaoudi I, Geisbert TW. Versteeg K, et al. Sci Rep. 2017 Aug 29;7(1):9730. doi: 10.1038/s41598-017-09963-y. Sci Rep. 2017. PMID: 28852031 Free PMC article.
  • Single-Cell Profiling of Ebola Virus Disease In Vivo Reveals Viral and Host Dynamics.
    Kotliar D, Lin AE, Logue J, Hughes TK, Khoury NM, Raju SS, Wadsworth MH 2nd, Chen H, Kurtz JR, Dighero-Kemp B, Bjornson ZB, Mukherjee N, Sellers BA, Tran N, Bauer MR, Adams GC, Adams R, Rinn JL, Melé M, Schaffner SF, Nolan GP, Barnes KG, Hensley LE, McIlwain DR, Shalek AK, Sabeti PC, Bennett RS. Kotliar D, et al. Cell. 2020 Nov 25;183(5):1383-1401.e19. doi: 10.1016/j.cell.2020.10.002. Epub 2020 Nov 6. Cell. 2020. PMID: 33159858 Free PMC article.
  • Host Factors Involved in Ebola Virus Replication.
    Rasmussen AL. Rasmussen AL. Curr Top Microbiol Immunol. 2018;419:113-150. doi: 10.1007/82_2017_27. Curr Top Microbiol Immunol. 2018. PMID: 28710692 Review.
  • Host Factors in Ebola Infection.
    Rasmussen AL. Rasmussen AL. Annu Rev Genomics Hum Genet. 2016 Aug 31;17:333-51. doi: 10.1146/annurev-genom-083115-022446. Epub 2016 May 4. Annu Rev Genomics Hum Genet. 2016. PMID: 27147086 Review.

Cited by

References

    1. Carroll MW, Matthews DA, Hiscox JA, Elmore MJ, Pollakis G, Rambaut A, et al. Temporal and spatial analysis of the 2014-2015 Ebola virus outbreak in West Africa. Nature. 2015;524:97–101. doi: 10.1038/nature14594. - DOI - PMC - PubMed
    1. Crowe SJ, Maenner MJ, Kuah S, Erickson BR, Coffee M, Knust B, et al. Prognostic indicators for Ebola patient survival. Emerg Infect Dis. 2016;22:217–23. doi: 10.3201/eid2202.151250. - DOI - PMC - PubMed
    1. Uyeki TM, Mehta AK, Davey RT, Jr, Liddell AM, Wolf T, Vetter P, et al. Clinical management of Ebola virus disease in the United States and Europe. N Engl J Med. 2016;374:636–46. doi: 10.1056/NEJMoa1504874. - DOI - PMC - PubMed
    1. Trad MA, Naughton W, Yeung A, Mazlin L, O'sullivan M, Gilroy N, Fisher DA, Stuart RL. Ebola virus disease: an update on current prevention and management strategies. J Clin Virol. 2017;86:5-13. doi:10.1016/j.jcv.2016.11.005. Epub 2016 Nov 11. - PubMed
    1. Shah T, Greig J, van der Plas LM, Achar J, Caleo G, Squire JS, et al. Inpatient signs and symptoms and factors associated with death in children aged 5 years and younger admitted to two Ebola management centres in Sierra Leone, 2014: a retrospective cohort study. Lancet Glob Health. 2016;4:e495–501. doi: 10.1016/S2214-109X(16)30097-3. - DOI - PubMed

Publication types

MeSH terms