. 2016 Dec 15:6:37433.
doi: 10.1038/srep37433.

Hepatitis C Virus Infection of Cultured Human Hepatoma Cells Causes Apoptosis and Pyroptosis in Both Infected and Bystander Cells

Affiliations

Hepatitis C Virus Infection of Cultured Human Hepatoma Cells Causes Apoptosis and Pyroptosis in Both Infected and Bystander Cells

H M Kofahi et al. Sci Rep. .

Abstract

Individuals infected with hepatitis C virus (HCV) are at high risk of developing progressive liver disease, including cirrhosis and hepatocellular carcinoma (HCC). How HCV infection causes liver destruction has been of significant interest for many years, and apoptosis has been proposed as one operative mechanism. In this study, we employed a tissue culture-adapted strain of HCV (JFH1T) to test effects of HCV infection on induction of programmed cell death (PCD) in Huh-7.5 cells. We found that HCV infection reduced the proliferation rate and induced caspase-3-mediated apoptosis in the infected cell population. However, in addition to apoptosis, we also observed infected cells undergoing caspase-1-mediated pyroptosis, which was induced by NLRP3 inflammasome activation. By co-culturing HCV-infected Huh-7.5 cells with an HCV-non-permissive cell line, we also demonstrated induction of both apoptosis and pyroptosis in uninfected cells. Bystander apoptosis, but not bystander pyroptosis, required cell-cell contact between infected and bystander cells. In summary, these findings provide new information on mechanisms of cell death in response to HCV infection. The observation that both apoptosis and pyroptosis can be induced in bystander cells extends our understanding of HCV-induced pathogenesis in the liver.


Figures

Figure 1
Figure 1. Cell viability and cell cycle analysis in the context of HCV infection.
(a) Huh-7.5 cells were infected with JFH1T at MOI of 1, 2 or 4. Three days p.i. the total viability of the cells was tested by MTT assay. This data is representative of three independent experiments. (b) Infected or uninfected Huh-7.5 cells were labelled with CFSE stain and CFSE intensity was measured 4 days p.i. The data is presented as the mean percentage of CFSE intensity compared to the maximum intensity measured immediately after infection. The data shown is the average from three independent experiments with error bars indicating SD. (c) Huh-7.5 cells were infected at MOIs of 1 or 2, then incubated for 4 days in a complete medium containing either 20 μM Z-VAD-FMK or an equivalent volume of DMSO. Cell viability was measured on day 4 p.i. by MTT assay. Data shown is representative of two independent experiments in which each sample was tested in triplicate. The data is presented as the percentage of the viability compared to the uninfected control. (d) Infected or uninfected Huh-7.5 cells were harvested 72 or 96 hrs post-infection. Huh-7.5 cells incubated for 48 hrs in complete media containing 50 ng/ml of actinomycin D were used as a positive control. Harvested cells were permeabilized and stained with PI, then cell cycle analysis was performed and the percentage of hypodiploid cells was determined. The data is presented as the mean percentage of the hypodiploid cells from four independent experiments +/−SD., p < 0.05 indicated by an asterisk (Student’s t-test).
Figure 2
Figure 2. Analysis of apoptosis in HCV-infected cells.
Huh-7.5 cells were infected at MOI = 1 and harvested on day 4 post-infection. The harvested cells were stained for cleaved caspase-3 (a) or cleaved PARP (b). In (c) infected cells were cultured in medium containing 100 μM Z-DEVD-FMK or an equivalent volume of DMSO for 4 days, then harvested and stained with PI. Cell cycle analysis was used to determine the number of hypodiploid cells. Data presented in A, B & C are the mean of three independent experiments +/−SD. Data shown in C is the percentage of hypodiploid cells compared to the untreated control. p < 0.05 indicated by an asterisk (Student’s t-test). (d) EM images of control or infected Huh-7.5 cells showing apoptotic features such as plasma membrane blebbing indicated by the blue arrow. The red arrow indicates cellular debris from a cell that had undergone lysis.
Figure 3
Figure 3. Analysis of pyroptosis in the context of HCV infection.
Huh-7.5 cells were infected at MOI = 1 or uninfected. (a) Culture fluids were collected four days p.i. and LDH activity was measured. Each bar represents the mean absorbance value from three independent experiments (each measured in triplicate) +/−SD. (b) On day 4 p.i., cells were harvested and stained with FAM-YVAD-FMK FLICA, then analysed by flow cytometry to detect cells containing active caspase-1. Six independent experiments were performed and each bar represents the mean percentage of active caspase-1-positive cells +/−SD. (c) Infected or uninfected Huh-7.5 cells were incubated in complete medium containing 100 μM Z-WEHD-FMK or an equivalent volume of DMSO. The cells were harvested on day 4 p.i. and stained with PI. Cell cycle analysis was used to determine the percentage of hypodiploid cells (Sub-G1) in each of the populations. Results shown represent two independent experiments. (d) Infected or uninfected Huh-7.5 cells were incubated in complete medium containing 0.1 μM MCC950. On day 4 p.i., cells were harvested and stained with PI. Cell cycle analysis was performed to determine the percentage of hypodiploid cells in each of the populations. The data is presented as the mean percentage of hypodiploid cells compared to the infected untreated control. Bars represent the mean of three independent experiments +/−SD. *Indicates p < 0.05 and **indicates p < 0.005 (Student’s t-test).
Figure 4
Figure 4. Measurement of bystander apoptosis/pyroptosis.
Huh-7.5 cell infected at MOI = 1 or uninfected were co-cultured with either S29 or 293 T cells at a ratio of 5:1. The S29 or 293 T cells were transfected with a GFP-expressing plasmid before the start of the co-culture. On day 4 p.i., cells were harvested and stained with antibodies specific for either cleaved caspase-3 (a) or cleaved PARP (b), or active caspase-1-specific FAM-YVAD-FMK FLICA (c), then analysed by flow cytometry. S29 cells or 293 T cells were identified in the analysis by gating on the GFP positive population. The results are shown as the percentage of cleaved caspase-3, cleaved PARP or active caspase-1-positive cells among the S29 or the 293 T cell populations. Mean +/−SD is shown from at least three independent experiments. *Indicates p < 0.05 and **indicates p < 0.005 (Student’s t-test).
Figure 5
Figure 5. Analysis of contact dependence.
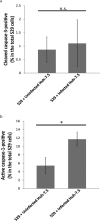
Infected or uninfected Huh-7.5 cells were co-cultured with S29 cells in a transwell plate at a ratio of 5:1. Four days p.i., S29 cells were harvested and stained with either cleaved caspase-3 antibody (a) or FAM-YVAD-FMK FLICA for active caspase-1 (b). The results are represented as the mean percentage +/−SD of cleaved-caspase-3-positive, or active caspase-1-positive cells among the total S29 cells from three independent experiments. n.s.: Not significant, p < 0.05 indicated by an asterisk (Student’s t-test).
Figure 6
Figure 6. Proposed model for HCV-induced programmed cell death.
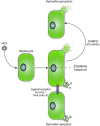
Schematic representation of the proposed model for the induction of the multiple forms of PCD in response to HCV infection. HCV infection induces at least two forms of programmed cell death in the infected cells: apoptosis and pyroptosis. Apoptosis is also induced in the neighbouring uninfected cells (bystander apoptosis) in a cell-cell contact-dependent manner, presumably by an interaction between a death ligand expressed on the surface of infected cell and a death receptor expressed on the surface of the bystander cell. The induction of bystander pyroptosis is cell-cell contact independent and is mediated by an as yet undetermined soluble factor.

Similar articles

Cited by

References

    1. Mohd Hanafiah K., Groeger J., Flaxman A. D. & Wiersma S. T. Global epidemiology of hepatitis C virus infection: new estimates of age-specific antibody to HCV seroprevalence. Hepatology 57, 1333–1342, doi: 10.1002/hep.26141 (2013). - DOI - PubMed
    1. Freeman A. J. et al.. Estimating progression to cirrhosis in chronic hepatitis C virus infection. Hepatology 34, 809–816, doi: 10.1053/jhep.2001.27831 (2001). - DOI - PubMed
    1. Marcellin P. Hepatitis C: the clinical spectrum of the disease. Journal of hepatology 31 Suppl 1, 9–16 (1999). - PubMed
    1. Schleich K., Krammer P. H. & Lavrik I. N. The chains of death: a new view on caspase-8 activation at the DISC. Cell cycle 12, 193–194, doi: 10.4161/cc.23464 (2013). - DOI - PMC - PubMed
    1. Elmore S. Apoptosis: a review of programmed cell death. Toxicologic pathology 35, 495–516, doi: 10.1080/01926230701320337 (2007). - DOI - PMC - PubMed

Publication types

MeSH terms