

Oxidized arachidonic and adrenic PEs navigate cells to ferroptosis
- PMID: 27842066
- PMCID: PMC5506843
- DOI: 10.1038/nchembio.2238
Oxidized arachidonic and adrenic PEs navigate cells to ferroptosis
Abstract
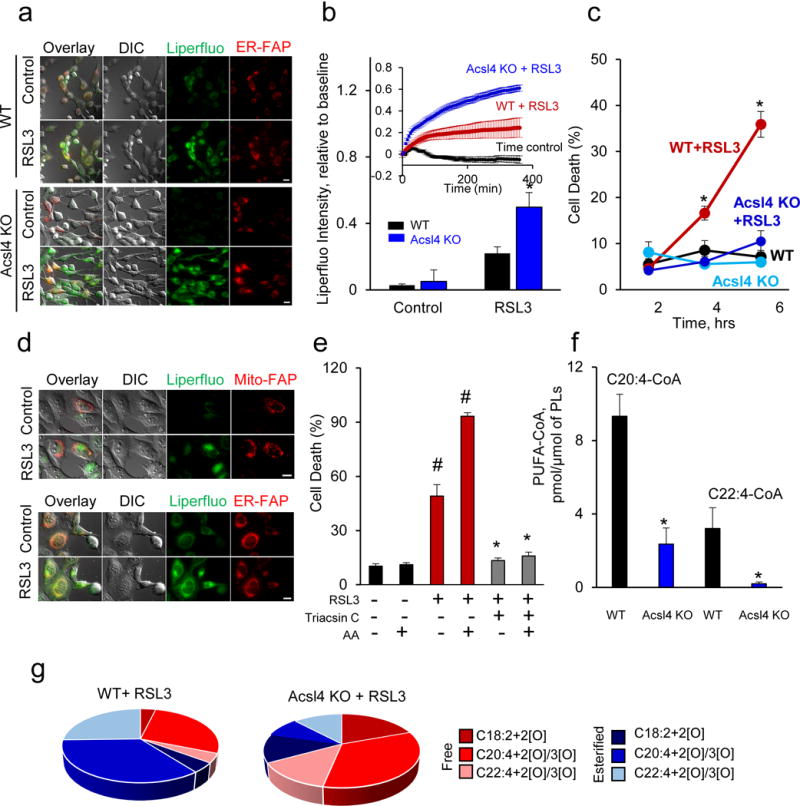
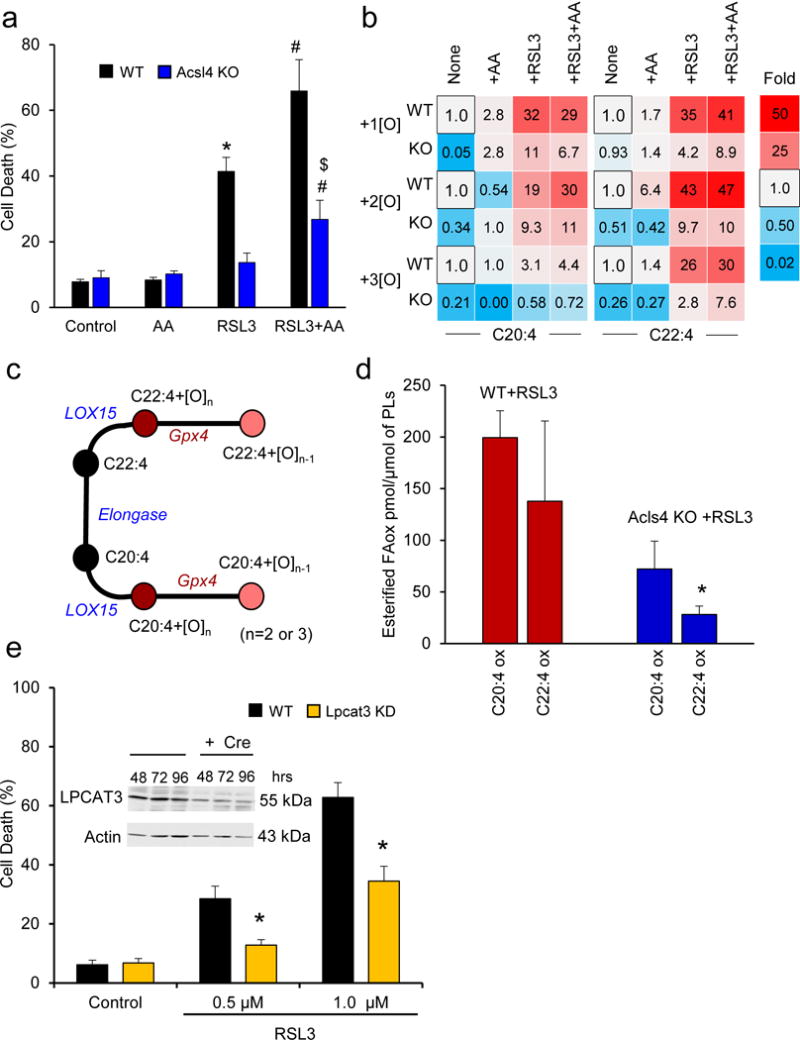
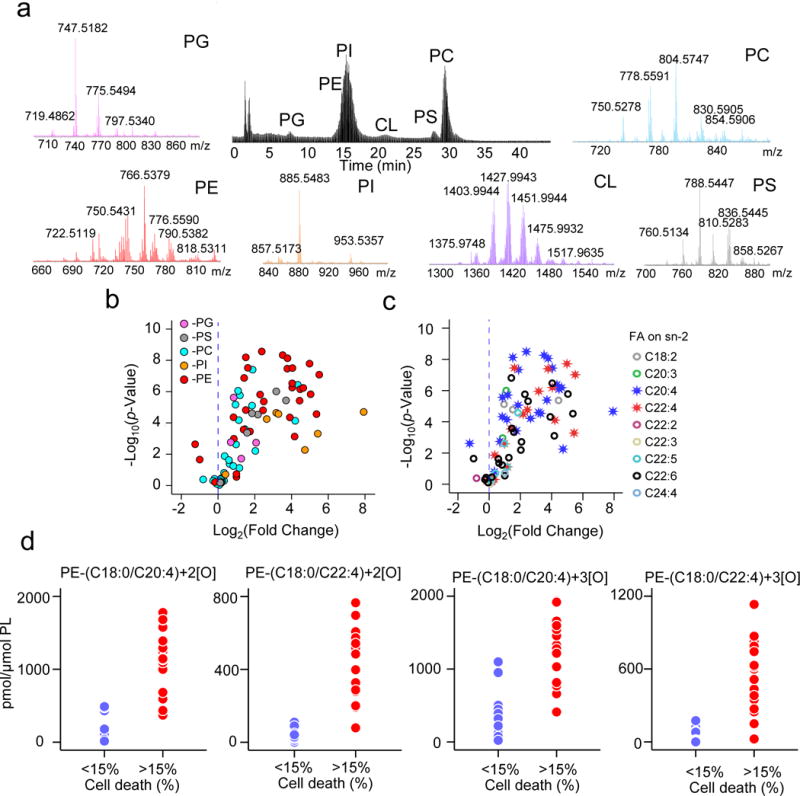
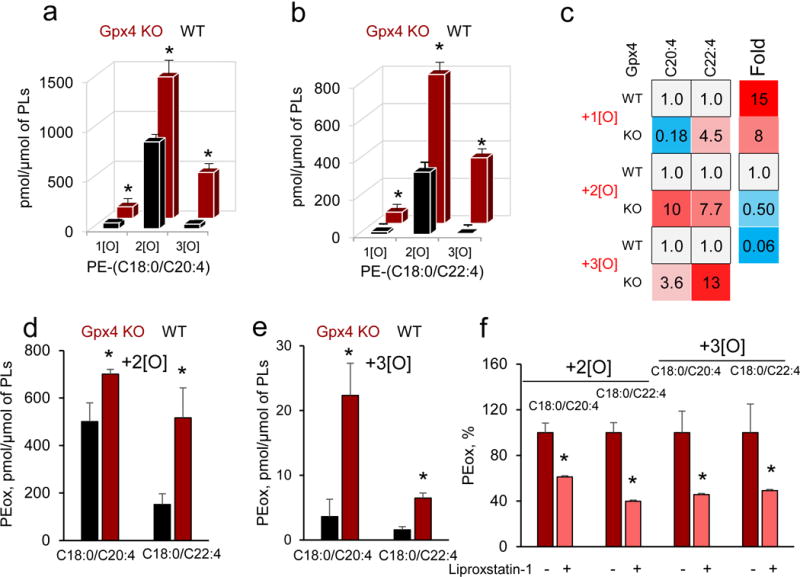
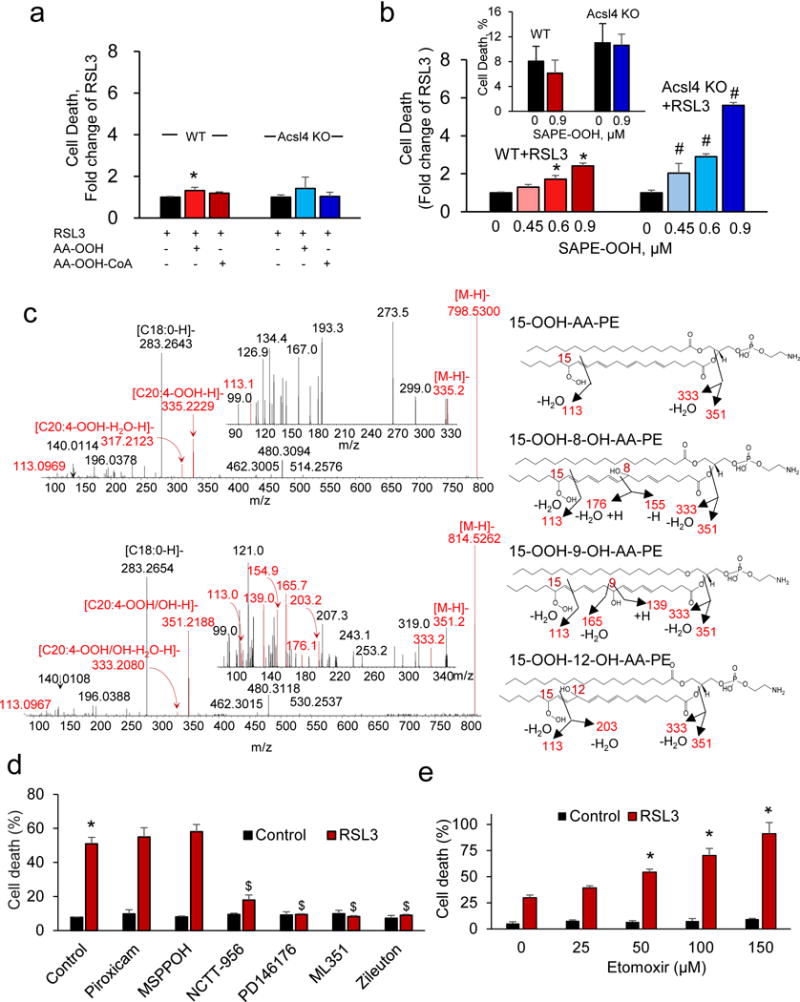
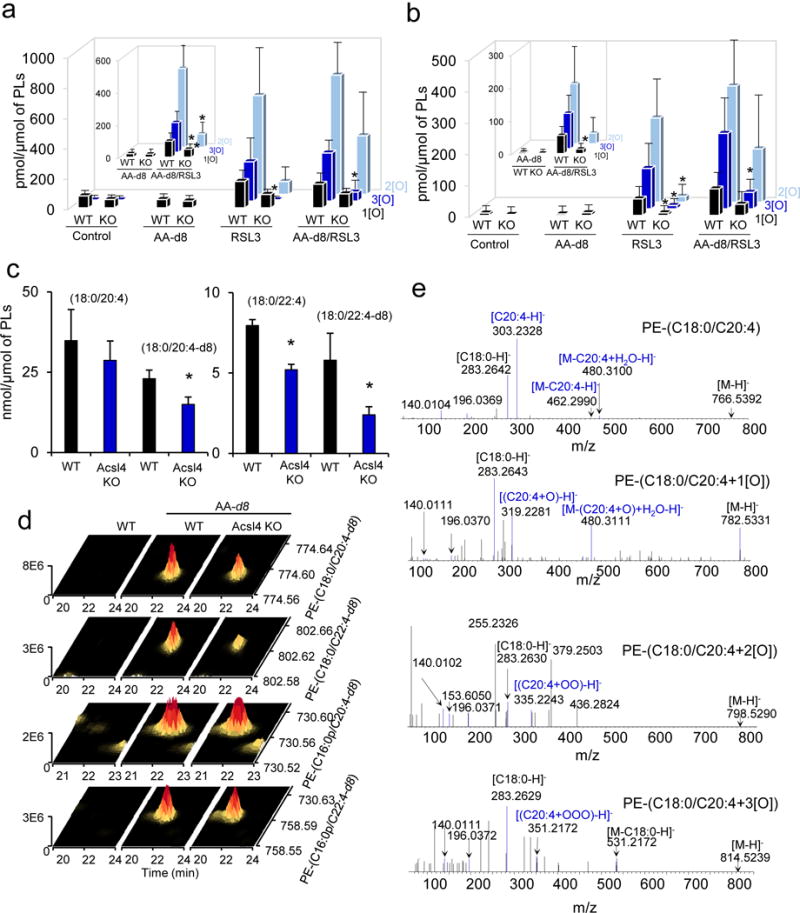
Enigmatic lipid peroxidation products have been claimed as the proximate executioners of ferroptosis-a specialized death program triggered by insufficiency of glutathione peroxidase 4 (GPX4). Using quantitative redox lipidomics, reverse genetics, bioinformatics and systems biology, we discovered that ferroptosis involves a highly organized oxygenation center, wherein oxidation in endoplasmic-reticulum-associated compartments occurs on only one class of phospholipids (phosphatidylethanolamines (PEs)) and is specific toward two fatty acyls-arachidonoyl (AA) and adrenoyl (AdA). Suppression of AA or AdA esterification into PE by genetic or pharmacological inhibition of acyl-CoA synthase 4 (ACSL4) acts as a specific antiferroptotic rescue pathway. Lipoxygenase (LOX) generates doubly and triply-oxygenated (15-hydroperoxy)-diacylated PE species, which act as death signals, and tocopherols and tocotrienols (vitamin E) suppress LOX and protect against ferroptosis, suggesting a homeostatic physiological role for vitamin E. This oxidative PE death pathway may also represent a target for drug discovery.
Conflict of interest statement
The authors declare no competing financial interests.
Figures
Similar articles
-
Strikingly High Activity of 15-Lipoxygenase Towards Di-Polyunsaturated Arachidonoyl/Adrenoyl-Phosphatidylethanolamines Generates Peroxidation Signals of Ferroptotic Cell Death.Angew Chem Int Ed Engl. 2024 Feb 26;63(9):e202314710. doi: 10.1002/anie.202314710. Epub 2024 Jan 17. Angew Chem Int Ed Engl. 2024. PMID: 38230815
-
Redox Epiphospholipidome in Programmed Cell Death Signaling: Catalytic Mechanisms and Regulation.Front Endocrinol (Lausanne). 2021 Feb 19;11:628079. doi: 10.3389/fendo.2020.628079. eCollection 2020. Front Endocrinol (Lausanne). 2021. PMID: 33679610 Free PMC article. Review.
-
Long-chain acyl-CoA synthetase 4 participates in the formation of highly unsaturated fatty acid-containing phospholipids in murine macrophages.Biochim Biophys Acta Mol Cell Biol Lipids. 2019 Nov;1864(11):1606-1618. doi: 10.1016/j.bbalip.2019.07.013. Epub 2019 Jul 31. Biochim Biophys Acta Mol Cell Biol Lipids. 2019. PMID: 31376475
-
ACSL4 dictates ferroptosis sensitivity by shaping cellular lipid composition.Nat Chem Biol. 2017 Jan;13(1):91-98. doi: 10.1038/nchembio.2239. Epub 2016 Nov 14. Nat Chem Biol. 2017. PMID: 27842070 Free PMC article.
-
Acyl-CoA synthase ACSL4: an essential target in ferroptosis and fatty acid metabolism.Chin Med J (Engl). 2023 Nov 5;136(21):2521-2537. doi: 10.1097/CM9.0000000000002533. Chin Med J (Engl). 2023. PMID: 37442770 Free PMC article. Review.
Cited by
-
Revisiting Tumors and the Cardiovascular System: Mechanistic Intersections and Divergences in Ferroptosis.Oxid Med Cell Longev. 2020 Aug 17;2020:9738143. doi: 10.1155/2020/9738143. eCollection 2020. Oxid Med Cell Longev. 2020. PMID: 32908642 Free PMC article. Review.
-
Ferroptosis: A New Promising Target for Ovarian Cancer Therapy.Int J Med Sci. 2022 Oct 17;19(13):1847-1855. doi: 10.7150/ijms.76480. eCollection 2022. Int J Med Sci. 2022. PMID: 36438923 Free PMC article. Review.
-
Helicobacter pylori CagA-mediated ether lipid biosynthesis promotes ferroptosis susceptibility in gastric cancer.Exp Mol Med. 2024 Feb;56(2):441-452. doi: 10.1038/s12276-024-01167-5. Epub 2024 Feb 21. Exp Mol Med. 2024. PMID: 38383581 Free PMC article.
-
Ferroptosis: a novel mechanism of cell death in ophthalmic conditions.Front Immunol. 2024 Jun 27;15:1440309. doi: 10.3389/fimmu.2024.1440309. eCollection 2024. Front Immunol. 2024. PMID: 38994366 Free PMC article. Review.
-
Deeper insight into ferroptosis: association with Alzheimer's, Parkinson's disease, and brain tumors and their possible treatment by nanomaterials induced ferroptosis.Redox Rep. 2023 Dec;28(1):2269331. doi: 10.1080/13510002.2023.2269331. Epub 2023 Nov 27. Redox Rep. 2023. PMID: 38010378 Free PMC article. Review.
References
Reference for Online Methods
-
- Szent-Gyorgyi C, et al. Fluorogen-activating single-chain antibodies for imaging cell surface proteins. Nat Biotechnol. 2008;26:235–40. - PubMed
-
- Tardi PG, Mukherjee JJ, Choy PC. The quantitation of long-chain acyl-CoA in mammalian tissue. Lipids. 1992;27:65–7. - PubMed
-
- Sun D, Cree MG, Wolfe RR. Quantification of the concentration and 13C tracer enrichment of long-chain fatty acyl-coenzyme A in muscle by liquid chromatography/mass spectrometry. Anal Biochem. 2006;349:87–95. - PubMed
MeSH terms
Substances
Grants and funding
- R01 ES020693/ES/NIEHS NIH HHS/United States
- R35 CA209896/CA/NCI NIH HHS/United States
- U19 AI068021/AI/NIAID NIH HHS/United States
- R01 HL097376/HL/NHLBI NIH HHS/United States
- R37 NS061817/NS/NINDS NIH HHS/United States
- R01 NS076511/NS/NINDS NIH HHS/United States
- P01 HL114453/HL/NHLBI NIH HHS/United States
- R01 HL096376/HL/NHLBI NIH HHS/United States
- R01 HL081784/HL/NHLBI NIH HHS/United States
- R01 HL098174/HL/NHLBI NIH HHS/United States
- R01 NS084604/NS/NINDS NIH HHS/United States
- R01 NS061817/NS/NINDS NIH HHS/United States
- P41 GM103712/GM/NIGMS NIH HHS/United States
LinkOut - more resources
Full Text Sources
Other Literature Sources
Research Materials
