

Direct interrogation of the role of H3K9 in metazoan heterochromatin function
- PMID: 27566777
- PMCID: PMC5024684
- DOI: 10.1101/gad.286278.116
Direct interrogation of the role of H3K9 in metazoan heterochromatin function
Abstract
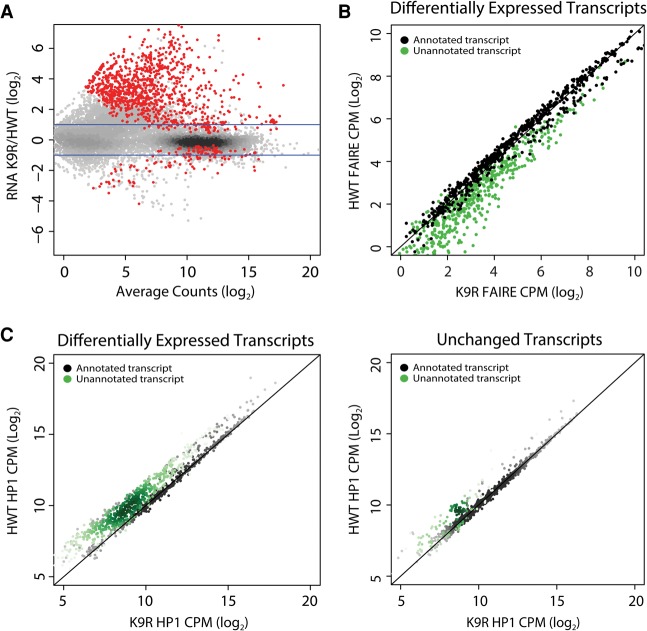
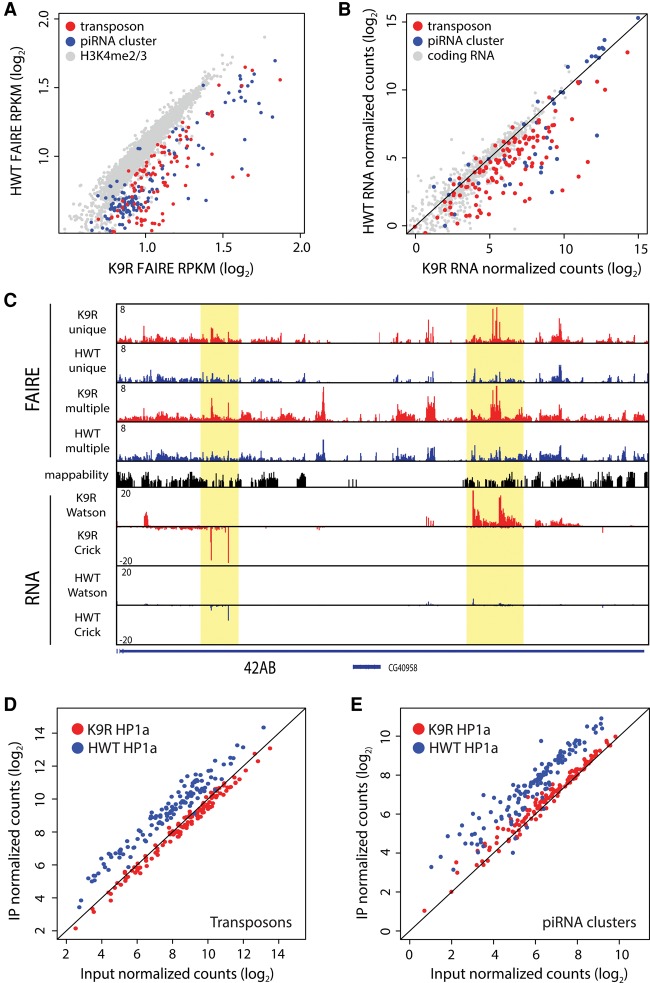
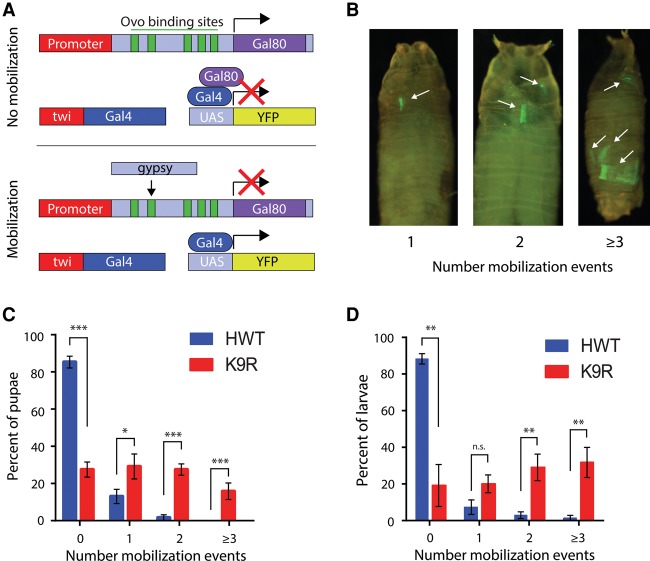
A defining feature of heterochromatin is methylation of Lys9 of histone H3 (H3K9me), a binding site for heterochromatin protein 1 (HP1). Although H3K9 methyltransferases and HP1 are necessary for proper heterochromatin structure, the specific contribution of H3K9 to heterochromatin function and animal development is unknown. Using our recently developed platform to engineer histone genes in Drosophila, we generated H3K9R mutant flies, separating the functions of H3K9 and nonhistone substrates of H3K9 methyltransferases. Nucleosome occupancy and HP1a binding at pericentromeric heterochromatin are markedly decreased in H3K9R mutants. Despite these changes in chromosome architecture, a small percentage of H3K9R mutants complete development. Consistent with this result, expression of most protein-coding genes, including those within heterochromatin, is similar between H3K9R and controls. In contrast, H3K9R mutants exhibit increased open chromatin and transcription from piRNA clusters and transposons, resulting in transposon mobilization. Hence, transposon silencing is a major developmental function of H3K9.
Keywords: Drosophila; H3K9; genomics; heterochromatin; heterochromatin protein 1 (HP1); transposon.
© 2016 Penke et al.; Published by Cold Spring Harbor Laboratory Press.
Figures
Similar articles
-
HP1a recruitment to promoters is independent of H3K9 methylation in Drosophila melanogaster.PLoS Genet. 2012;8(11):e1003061. doi: 10.1371/journal.pgen.1003061. Epub 2012 Nov 15. PLoS Genet. 2012. PMID: 23166515 Free PMC article.
-
Epigenetic regulation of the Drosophila chromosome 4 by the histone H3K9 methyltransferase dSETDB1.Proc Natl Acad Sci U S A. 2007 Jul 31;104(31):12691-6. doi: 10.1073/pnas.0705534104. Epub 2007 Jul 25. Proc Natl Acad Sci U S A. 2007. PMID: 17652514 Free PMC article.
-
Inheritance of H3K9 methylation regulates genome architecture in Drosophila early embryos.EMBO J. 2024 Jul;43(13):2685-2714. doi: 10.1038/s44318-024-00127-z. Epub 2024 Jun 3. EMBO J. 2024. PMID: 38831123 Free PMC article.
-
HP1c casts light on dark matter.Cell Cycle. 2011 Feb 15;10(4):625-30. doi: 10.4161/cc.10.4.14796. Epub 2011 Feb 15. Cell Cycle. 2011. PMID: 21301224 Review.
-
Establishment of H3K9-methylated heterochromatin and its functions in tissue differentiation and maintenance.Nat Rev Mol Cell Biol. 2022 Sep;23(9):623-640. doi: 10.1038/s41580-022-00483-w. Epub 2022 May 13. Nat Rev Mol Cell Biol. 2022. PMID: 35562425 Free PMC article. Review.
Cited by
-
Epigenetic inheritance and gene expression regulation in early Drosophila embryos.EMBO Rep. 2024 Oct;25(10):4131-4152. doi: 10.1038/s44319-024-00245-z. Epub 2024 Sep 16. EMBO Rep. 2024. PMID: 39285248 Free PMC article. Review.
-
Direct assessment of histone function using histone replacement.Trends Biochem Sci. 2023 Jan;48(1):53-70. doi: 10.1016/j.tibs.2022.06.010. Epub 2022 Jul 16. Trends Biochem Sci. 2023. PMID: 35853806 Free PMC article. Review.
-
Writing, erasing and reading histone lysine methylations.Exp Mol Med. 2017 Apr 28;49(4):e324. doi: 10.1038/emm.2017.11. Exp Mol Med. 2017. PMID: 28450737 Free PMC article. Review.
-
Chromatin organization changes during the establishment and maintenance of the postmitotic state.Epigenetics Chromatin. 2017 Nov 10;10(1):53. doi: 10.1186/s13072-017-0159-8. Epigenetics Chromatin. 2017. PMID: 29126440 Free PMC article.
-
Conserved chromatin and repetitive patterns reveal slow genome evolution in frogs.Nat Commun. 2024 Jan 17;15(1):579. doi: 10.1038/s41467-023-43012-9. Nat Commun. 2024. PMID: 38233380 Free PMC article.
References
-
- Ahmad K, Henikoff S. 2002. The histone variant H3.3 marks active chromatin by replication-independent nucleosome assembly. Mol Cell 9: 1191–1200. - PubMed
-
- Bannister AJ, Zegerman P, Partridge JF, Miska EA, Thomas JO, Allshire RC, Kouzarides T. 2001. Selective recognition of methylated lysine 9 on histone H3 by the HP1 chromo domain. Nature 410: 120–124. - PubMed
-
- Bernard P, Maure JF, Partridge JF, Genier S, Javerzat JP, Allshire RC. 2001. Requirement of heterochromatin for cohesion at centromeres. Science 294: 2539–2542. - PubMed
-
- Biggar KK, Li SS-C. 2014. Non-histone protein methylation as a regulator of cellular signalling and function. Nat Rev Mol Cell Biol 16: 5–17. - PubMed
MeSH terms
Substances
Grants and funding
LinkOut - more resources
Full Text Sources
Other Literature Sources
Molecular Biology Databases
Research Materials