

GSDMD membrane pore formation constitutes the mechanism of pyroptotic cell death
- PMID: 27418190
- PMCID: PMC5010048
- DOI: 10.15252/embj.201694696
GSDMD membrane pore formation constitutes the mechanism of pyroptotic cell death
Abstract
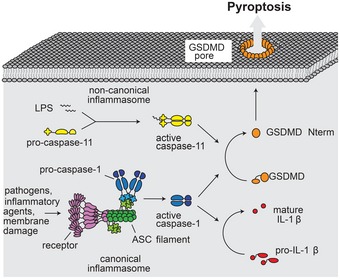
Pyroptosis is a lytic type of cell death that is initiated by inflammatory caspases. These caspases are activated within multi-protein inflammasome complexes that assemble in response to pathogens and endogenous danger signals. Pyroptotic cell death has been proposed to proceed via the formation of a plasma membrane pore, but the underlying molecular mechanism has remained unclear. Recently, gasdermin D (GSDMD), a member of the ill-characterized gasdermin protein family, was identified as a caspase substrate and an essential mediator of pyroptosis. GSDMD is thus a candidate for pyroptotic pore formation. Here, we characterize GSDMD function in live cells and in vitro We show that the N-terminal fragment of caspase-1-cleaved GSDMD rapidly targets the membrane fraction of macrophages and that it induces the formation of a plasma membrane pore. In vitro, the N-terminal fragment of caspase-1-cleaved recombinant GSDMD tightly binds liposomes and forms large permeability pores. Visualization of liposome-inserted GSDMD at nanometer resolution by cryo-electron and atomic force microscopy shows circular pores with variable ring diameters around 20 nm. Overall, these data demonstrate that GSDMD is the direct and final executor of pyroptotic cell death.
Keywords: atomic force microscopy; cell death; gasdermin; inflammasomes; inflammation; pyroptosis.
© 2016 The Authors. Published under the terms of the CC BY NC ND 4.0 license.
Figures
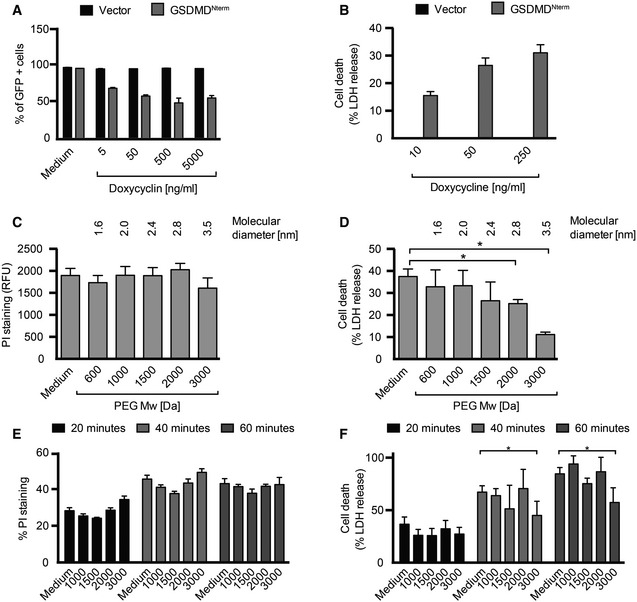
- A
Cell viability as assessed by GFP expression in HEK293T cells transfected with the pRetroX TetOne3G‐eGFP plasmid only (vector) or pRetroX TetOne3G‐eGFP harboring the N‐terminal fragment of GSDMD. Cells were treated with the indicated concentrations of doxycycline 24 h post‐transfection, and the percentage of GFP‐positive cells was determined 16 h later by flow cytometry.
- B
LDH release from HEK293T cells transfected with the pRetroX TetOne3G‐eGFP plasmid only (vector) or pRetroX TetOne3G‐eGFP harboring the N‐terminal fragment of GSDMD. At 24 h post‐transfection, cells were treated with the indicated concentrations of doxycycline for 8 h and the percentage of LDH release was determined. Graphs show mean and s.d. of quadruplicate wells.
- C, D
PI staining of and LDH release from HEK293T cells transfected with pRetroX TetOne3G‐eGFP harboring the N‐terminal fragment of GSDMD in the presence of osmoprotectants. At 24 h post‐transfection, PEGs of the indicated molecular weights were added to a final concentration of 30 mM, cells were treated with 250 ng ml−1 doxycycline for 8 h, and the level of PI staining (C) or LDH release (D) was determined.
- E, F
PI staining of and LDH release from LPS‐primed primary BMDMs infected with log‐phase S. typhimurium for the indicated time points in the presence of PEGs of the indicated molecular weight (numbers on the x‐axis, 30 mM final concentration).
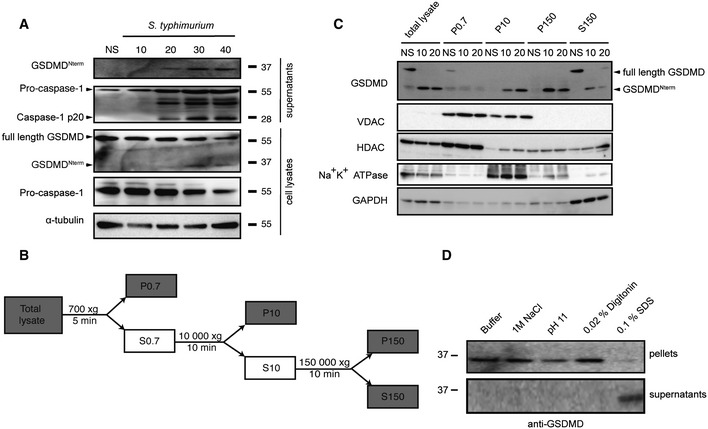
Immunoblot analysis of cleaved GSDMD in culture supernatants and full‐length GSDMD, cleaved GSDMD and α‐tubulin in the cell lysates of immortalized LPS‐primed WT macrophages left uninfected (NS) or infected for 10–40 min with log‐phase S. typhimurium (MOI = 50).
Schematic representation of the subcellular fractionation shown in (C).
Fractionation and immunoblot analysis for GSDMD, Na+K+ ATPase, VDAC (voltage‐dependent anion channel), HDAC1 (histone deacetylase 1), and GAPDH (glycerinaldehyd‐3‐phosphate dehydrogenase) of WT macrophages infected for 10 and 20 min with log‐phase S. typhimurium (MOI = 50). Fractionation was carried out as described in the Materials and Methods section, and equivalent amount of protein was loaded per lane.
Extraction of cleaved GSDMD from isolated membranes of WT macrophages infected for 10 min with log‐phase S. typhimurium (MOI = 50). Extraction was carried in variable conditions as described in the Materials and Methods section.
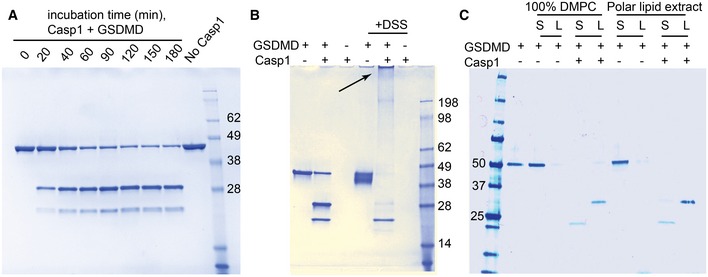
Human GSDMD at a concentration of 2 μM was incubated at room temperature with 5 nM caspase‐1. The protein was cleaved in a time‐dependent manner into two bands of 31 kDa (
GSDMD Nterm) and 22 kDa (GSDMDCterm).Cross‐linking experiment of full‐length and cleaved GSDMD. GSDMD at a concentration of 2 μM was incubated at room temperature with 5 nM caspase‐1. After enzymatic cleavage, GSDMDNterm is highly cross‐linked by DSS, resulting in the gel‐impenetrating species highlighted by the arrow. GSDMDCterm is not cross‐linked.
GSDMD at a concentration of 1 μM was incubated at room temperature with 5 nM caspase‐1 and liposomes composed of 4 mM DMPC or polar lipid extract derived from E. coli. After 2 h, the lipid fraction (L) was separated from the supernatant (S) by ultracentrifugation at 4°C for 1 h at 120,000 g.
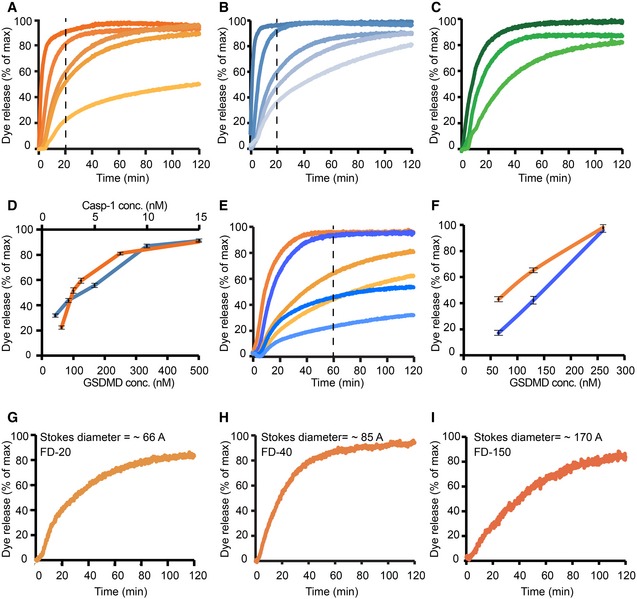
- A–I
Dye release time courses from liposomes as a percentage of maximal release. (A) Five different reactions, where 5 nM caspase‐1 and 400 μM 6‐carboxyfluorescein‐loaded liposomes prepared with E. coli polar lipids were incubated with GSDMD concentrations of (nM): 520, 260, 130, 100, 65 (colored dark to light orange). The time point of 20 min is highlighted by a vertical dashed line. (B) Five different reactions, where 130 nM of GSDMD and 400 μM 6‐carboxyfluorescein‐loaded liposomes prepared with E. coli extract polar lipid, were incubated with caspase‐1 concentration of (nM): 15, 8, 5, 2.5, 1.2 (colored dark to light blue). The time point of 20 min is highlighted by a vertical dashed line. (C) Three different reactions, where 5 nM caspase‐1 and 400 μM 6‐carboxyfluorescein‐loaded liposomes prepared with porcine brain total lipid extract, were incubated with GSDMD concentrations of (nM): 520, 260, 100 (colored dark to light green). (D) Dye release at 20‐min reaction as a function of GSDMD (dark orange) and caspase‐1 (dark blue) concentrations. Error bars for three independent experiments are shown. (E) Two different sets of reactions, where wild‐type GSDMD (dark to light orange) and the mutant GSDMDI104N (dark to light blue) were independently incubated at the concentrations of 260, 130, and 65 nM with 5 nM caspase‐1 and 400 μM 6‐carboxyfluorescein‐loaded liposomes. The time point of 60 min is highlighted by a vertical dashed line. (F) Dye release at 60 min of reaction as a function of GSDMD wild‐type (dark orange) and GSDMDI104N (dark blue) concentration. Error bars for three independent experiments are shown. (G–I) Dye release from 400 μM liposomes loaded with the 6‐carboxyfluorescein derivates FD‐20, FD‐40, and FD‐150, with variable Stokes diameters, as indicated. 130 nM of GSDMD and 5 nM caspase‐1 were incubated with the liposomes. For each experiment, a representative from three independent experiments is shown. The corresponding raw data are shown in Appendix Figure S5.
- A–C
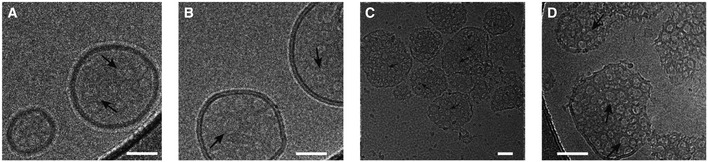
Cryo‐electron micrographs of GSDMDNterm pores in E. coli polar lipid liposomes. The micrographs were acquired at protein/lipid molar ratios of 1/1,000, 1/500, and 1/100, respectively. Black arrows indicate ring‐shaped structures corresponding to oligomeric GSDMDNterm pore forms. Scale bars = 80 nm.
- D
Proteoliposome with protein/lipid molar ratio of 1/100 at higher magnification. Black arrows indicate ring‐shaped structures corresponding to oligomeric GSDMDNterm pore forms. Scale bar = 80 nm.
- A
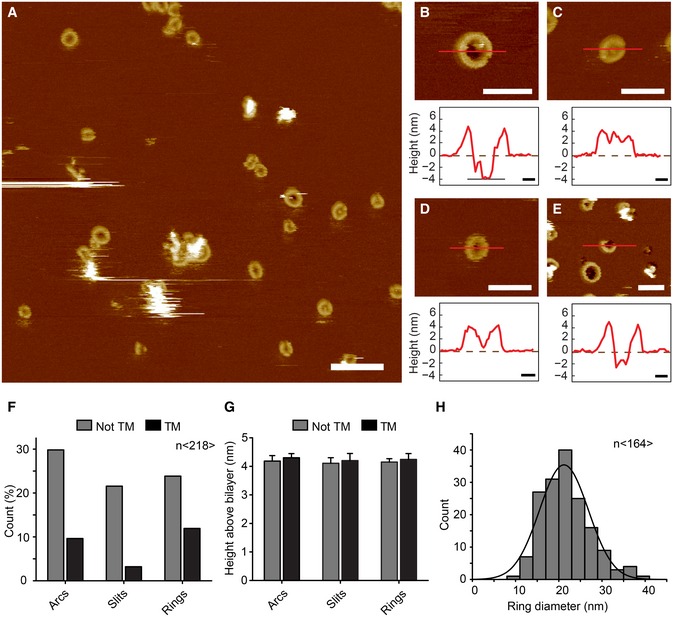
AFM topograph of GSDMDNterm bound to lipid membranes of E. coli polar lipids. Overview topograph showing arc‐, slit‐, and ring‐like GSDMD oligomers. Scale bar corresponds to 100 nm.
- B–E
High‐resolution AFM topographs and height profiles of GSDMDNterm oligomers (red curves). Height profiles were measured along the red lines in the topographs. Dashed zero lines (0 nm) indicate the surface of the lipid membrane; heights of < −4 nm indicate that the oligomers formed transmembrane pores. Topographs were taken in buffer solution (150 NaCl, 20 mM Hepes, pH 7.8) at room temperature. The experiment was reproduced at least three times using independent liposome and GSDMD preparations. Scale bars of topographs correspond to 50 nm and of height profiles 10 nm. The full color range of the AFM topographs corresponds to a vertical scale (height) of 20 nm.
- F–H
Analysis of GSDMDNterm oligomers bound to lipid membranes of E. coli polar lipids. (F) GSDMDNterm oligomers assembled into arcs, slits, and rings leading to transmembrane (TM) pores or not transmembrane aggregate (n = 218). (G) Height of GSDMDNterm oligomers protruding from the lipid membrane. Bars represent mean, and error bars represent s.e.m. (n = 218). (H) Distribution of the diameters of rings formed by GSDMDNterm oligomers. The average distribution was 21.2 ± 5.6 nm (n = 164; average ± s.d.), and the bin size was 3 nm.
Comment in
-
Pore formation by GSDMD is the effector mechanism of pyroptosis.EMBO J. 2016 Oct 17;35(20):2167-2169. doi: 10.15252/embj.201695415. Epub 2016 Aug 29. EMBO J. 2016. PMID: 27572465 Free PMC article.
Similar articles
-
Live-cell visualization of gasdermin D-driven pyroptotic cell death.J Biol Chem. 2017 Sep 1;292(35):14649-14658. doi: 10.1074/jbc.M117.797217. Epub 2017 Jul 18. J Biol Chem. 2017. PMID: 28726636 Free PMC article.
-
Cleavage of GSDMD by inflammatory caspases determines pyroptotic cell death.Nature. 2015 Oct 29;526(7575):660-5. doi: 10.1038/nature15514. Epub 2015 Sep 16. Nature. 2015. PMID: 26375003
-
An Apoptotic Caspase Network Safeguards Cell Death Induction in Pyroptotic Macrophages.Cell Rep. 2020 Jul 28;32(4):107959. doi: 10.1016/j.celrep.2020.107959. Cell Rep. 2020. PMID: 32726624 Free PMC article.
-
No longer married to inflammasome signaling: the diverse interacting pathways leading to pyroptotic cell death.Biochem J. 2022 May 27;479(10):1083-1102. doi: 10.1042/BCJ20210711. Biochem J. 2022. PMID: 35608339 Free PMC article. Review.
-
Structural Insight of Gasdermin Family Driving Pyroptotic Cell Death.Adv Exp Med Biol. 2019;1172:189-205. doi: 10.1007/978-981-13-9367-9_9. Adv Exp Med Biol. 2019. PMID: 31628657 Review.
Cited by
-
The multifaceted roles of NLRP3-modulating proteins in virus infection.Front Immunol. 2022 Aug 30;13:987453. doi: 10.3389/fimmu.2022.987453. eCollection 2022. Front Immunol. 2022. PMID: 36110852 Free PMC article. Review.
-
Cellular Mechanisms of NETosis.Annu Rev Cell Dev Biol. 2020 Oct 6;36:191-218. doi: 10.1146/annurev-cellbio-020520-111016. Epub 2020 Jul 14. Annu Rev Cell Dev Biol. 2020. PMID: 32663035 Free PMC article. Review.
-
Pyroptosis inhibiting nanobodies block Gasdermin D pore formation.Nat Commun. 2023 Dec 1;14(1):7923. doi: 10.1038/s41467-023-43707-z. Nat Commun. 2023. PMID: 38040708 Free PMC article.
-
ATP-Binding and Hydrolysis in Inflammasome Activation.Molecules. 2020 Oct 7;25(19):4572. doi: 10.3390/molecules25194572. Molecules. 2020. PMID: 33036374 Free PMC article. Review.
-
Gasdermin D membrane pores orchestrate IL-1α secretion from necrotic macrophages after NFS-rich silica exposure.Arch Toxicol. 2023 Apr;97(4):1001-1015. doi: 10.1007/s00204-023-03463-x. Epub 2023 Feb 25. Arch Toxicol. 2023. PMID: 36840754 Free PMC article.
References
-
- Broz P (2015) Immunology: caspase target drives pyroptosis. Nature 526: 642–643 - PubMed
MeSH terms
Substances
LinkOut - more resources
Full Text Sources
Other Literature Sources
Molecular Biology Databases
Research Materials
