. 2016 Aug;22(8):897-905.
doi: 10.1038/nm.4126. Epub 2016 Jul 4.

Loss of fibronectin from the aged stem cell niche affects the regenerative capacity of skeletal muscle in mice

Affiliations

Loss of fibronectin from the aged stem cell niche affects the regenerative capacity of skeletal muscle in mice

Laura Lukjanenko et al. Nat Med. 2016 Aug.

Abstract

Age-related changes in the niche have long been postulated to impair the function of somatic stem cells. Here we demonstrate that the aged stem cell niche in skeletal muscle contains substantially reduced levels of fibronectin (FN), leading to detrimental consequences for the function and maintenance of muscle stem cells (MuSCs). Deletion of the gene encoding FN from young regenerating muscles replicates the aging phenotype and leads to a loss of MuSC numbers. By using an extracellular matrix (ECM) library screen and pathway profiling, we characterize FN as a preferred adhesion substrate for MuSCs and demonstrate that integrin-mediated signaling through focal adhesion kinase and the p38 mitogen-activated protein kinase pathway is strongly de-regulated in MuSCs from aged mice because of insufficient attachment to the niche. Reconstitution of FN levels in the aged niche remobilizes stem cells and restores youth-like muscle regeneration. Taken together, we identify the loss of stem cell adhesion to FN in the niche ECM as a previously unknown aging mechanism.


Figures

Figure 1
Figure 1
Aging affects FN levels during skeletal muscle regeneration. (ad) Gene set enrichment analysis for KEGG-derived JAK–STAT (a), MAPK (b), cell cycle (c) and ECM–receptor interaction (d) pathways of freshly isolated young versus aged MuSCs at 3 d.p.i. Nominal P values and false discovery rate (FDR) Q values are reported. FC Y/A, fold change young/aged. (e) Detection of ECM proteins in young and aged muscles under uninjured (uninj.) conditions or at 3, 7 and 14 d.p.i. RFU, relative fluorescence units; ECM-1, extracellular matrix protein 1; MEPE, matrix extracellular phosphoglycoprotein. Data represent means. (f) Changes (Δ) of the RFU signal shown in e relative to the uninjured condition in young and aged muscles. Data represent means. (g) RFU signal for FN in young and aged muscles. (h) FN expression by different cell populations in young and aged muscles at 3 d.p.i. (i) qPCR for FN expression in muscles of control (Ctrl) or iFN-KO mice at 5 d.p.i. (j) Number of Pax7+ MuSCs per unit area in control and iFN–KO mice at 5 d.p.i. Unless otherwise specified, data are means + s.e.m. In a–d, n = 6 mice for young and n = 5 for aged. In e–g, n = 8 mice for young, aged uninj. and aged at 3 d.p.i.; n = 5 for aged at 7 d.p.i.; and n = 7 for aged at 14 d.p.i. In h, n = 5 mice for young and n = 6 for aged. In i,j, n = 3 mice per group for Ctrl and iFN–KO. ***P < 0.001, **P < 0.01, *P < 0.05; by one-way analysis of variance (ANOVA) followed by Bonferroni post hoc test (g) or by Student's t-test (h–j).
Figure 2
Figure 2
Fibronectin is a preferred adhesion substrate for mouse and human muscle progenitors. (a) Graphical overview of the experiment. (b,c) Quantification of the adhesion of mouse MuSC-derived myoblasts (b) and human myoblasts (c) on ECM hydrogel arrays 3 h, 6 h and 24 h after seeding. The total number of cells adhering to the array was set to 100%. Shades of green or blue color indicate changes in adherence. Asterisks indicate conditions containing FN. Values are means from n = 3 ECM hydrogel arrays per time point from independent experiments.
Figure 3
Figure 3
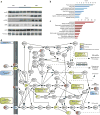
MuSC aging pathways are modulated by fibronectin. (a) Representative western blot analysis for the ERK and p38 MAP kinases from myoblasts grown on collagen I (COL), FN or laminin (LAM) for 72 h. Actin and a Ponceau-stained dominant band at the same molecular weight are shown as loading controls. (b,c) Gene Ontology analysis of statistically differentially regulated genes in microarray data from cells grown on FN versus those grown on Col for 72 h (n = 3 microarrays per condition). Graphs represent counts of up- (b) or downregulated (c) genes that are annotated to the indicated terms. (d) Mapping of proteins and genes that are differentially affected by FN to the KEGG adhesion–signaling system and its associated pathways. Light green indicates factors that are affected by FN at the proteomic level (phosphorylation), red denotes factors whose expression is changed at the transcript level, and blue indicates changes to factors at both levels.
Figure 4
Figure 4
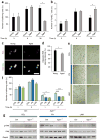
Impaired FN-mediated adhesion signaling in aged MuSCs. (a) Adhesion of freshly isolated young and aged MuSCs 3 h, 6 h and 36 h after seeding on Col. (b) Quantification of freshly isolated TUNEL+ apoptotic young and aged MuSCs at 3 h, 6 h and 36 h following adherence. (c,d) Representative images (c) and quantification (d) of freshly isolated MuSCs from young and aged mice that were seeded on Col and were subsequently stained for FAK. Scale bar, 25 μm. (e) Representative images of crystal violet–stained β1-integrin-knockout (Itgb1−/−) (right) and wild-type (Ctrl) (left) cells that were grown on Col (top), FN (middle) and LAM (bottom) 2 h after plating. Scale bar, 20 μm. (f) Adhesion capacity of Itgb1−/− and Ctrl cells on Col, FN and LAM at 1 h and 2 h following plating. (g) Representative western blots for FAK and phospho-FAK (pFAK) from Itgb1−/− and Ctrl cells that were grown for 72 h on Col, FN or LAM. Gapdh is shown as a loading control. Throughout, data are means + s.e.m. In a,b,d, n = 3 mice per group. In e,f, n = 4 independent cell culture replicates with n = 1 low-magnification image recorded per condition. In g, n = 3 myoblast lysates per condition, each from a different mouse. ***P < 0.001, *P < 0.05; by two-way ANOVA followed by Bonferroni post hoc test (a,b,f) or by Student's t-test (d).
Figure 5
Figure 5
Exposure to FN rescues adhesion signaling in aged MSCs. (a) Adhesion of freshly isolated aged MuSCs on Col, FN and LAM at 3 h, 6 h and 36 h after seeding. (b) Quantification of freshly isolated TUNEL+ aged MuSCs 36 h after isolation and plating on Col or FN. (c) Proliferation of freshly isolated aged MuSCs grown on Col or FN for 96 h. (d) Percentage reduction in numbers of MuSCs that were seeded on Col (left) or FN (right) for 36 h and then exposed to a FAK inhibitor or to vehicle (control). (e) Representative images of MuSCs showing differential FAK subcellular localization after growth on Col (top) or FN (bottom). Scale bar, 2.5 μm. (f) Cumulative probability of the ratio of nuclear FAK over total FAK in young and aged MuSCs that were plated on Col or FN for 6 h. Empirical cumulative distribution functions were built on the basis of n = 3 mice per condition. Kolmogorov– Smirnov distance (D) in young MuSCs on FN (young FN) versus aged MuSCs on FN (aged FN), aged FN versus aged MuSCS on Col (aged COL), and young MuSCs on Col (young COL) versus aged COL are 0.13, 0.12 and 0.21, respectively, and ***P values are 1.05 × 10⁻⁶, 5.17 × 10⁻⁶ and 1.55 × 10⁻¹⁴, respectively. (g) Percentage increase in numbers of adhering MuSCs seeded on either Col or FN for 36 h and exposed to either the p38 inhibitor or vehicle. Throughout, bars represent means + s.e.m. For all experiments, unless otherwise noted, n = 3 mice. In e,f, n ≥ 60 cells were analyzed per mouse, n = 3 mice per condition. Unless otherwise noted, ***P < 0.001, **P < 0.01, *P < 0.05 versus vehicle-treated cells or as indicated; by two-way ANOVA followed by Bonferroni post hoc test (a,d,g) or by Student's t-test (b,c).
Figure 6
Figure 6
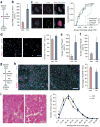
Fibronectin treatment restores the regenerative capacity of aged muscles. (a) Experimental protocol used for bf. (b) Quantification of FAK levels in Pax7+ MuSCs in tissue sections of vehicle (Veh)- or FN-treated muscles. (c) Representative images of nuclear (yellow arrowheads) (top) or cytosolic (white arrowheads) (bottom) FAK puncta in Pax7+ cells (left) and quantification of the cumulative probability of the ratio (per cell) of nuclear FAK puncta/total FAK puncta. Kolmogorov– Smirnov distance (D) in aged FN versus aged COL, and in young COL versus aged COL, are 0.725 and 0.7, respectively. ***P values are 1.48 × 10⁻⁹ and 6.15 × 10⁻⁹, respectively. (d) Representative images of Pax7 and Ki67 staining in tissue sections from vehicle- (left) or FN-treated (middle) mice, and quantification of Ki67+ cells within the Pax7+ cell population (Pax7+Ki67+) (right). (e,f) Quantification of Pax7+MyoD+ (e) and Pax7MyoD+ (f) cells per unit area in muscles of vehicle- or FN-treated muscles. (g) Experimental protocol used for h,i. (h) Representative images of muscle sections stained for developmental myosin heavy chain (devMHC) and laminin in vehicle- (left) or FN-treated (middle) aged mice, and quantification of the percentage of devMHC+ fibers in muscles after the indicated treatments (right). (i) Representative H&E-stained images of muscle cross-sections from vehicle- (left) or FN-treated (middle) mice and quantification of fiber size on the basis of laminin staining (right). Throughout, bars and data points represent means + s.e.m. and ± s.e.m., respectively. Mice used were n = 3 (e, FN; f, FN; i) or n = 4 (be, Veh; f, Veh; h) per condition. In c, n = 10 cells were analyzed per mouse. In d,h,i, quantification was performed on stitched images covering the entire cross section of the tibialis anterior muscle of each mouse. **P < 0.01, *P < 0.05; by Student's t-test (b,df,h,i). Scale bars, 5 μm (c), 25 μm (d) and 100 μm (h,i).

Comment in

Similar articles

Cited by

References

    1. Bentzinger CF, Wang YX, Dumont NA, Rudnicki MA. Cellular dynamics in the muscle satellite cell niche. EMBO Rep. 2013;14:1062–1072. - PMC - PubMed
    1. Gilbert PM, et al. Substrate elasticity regulates skeletal muscle stem cell self-renewal in culture. Science. 2010;329:1078–1081. - PMC - PubMed
    1. Lv H, et al. Mechanism of regulation of stem cell differentiation by matrix stiffness. Stem Cell Res Ther. 2015;6:103. - PMC - PubMed
    1. Bonaldo P, et al. Collagen VI deficiency induces early onset myopathy in the mouse: an animal model for Bethlem myopathy. Hum Mol Genet. 1998;7:2135–2140. - PubMed
    1. Bentzinger CF, et al. Fibronectin regulates Wnt7a signaling and satellite cell expansion. Cell Stem Cell. 2013;12:75–87. - PMC - PubMed

Publication types

Substances