. 2016 Jul 28;166(3):567-581.
doi: 10.1016/j.cell.2016.05.074. Epub 2016 Jun 30.

Mitotic Checkpoint Regulators Control Insulin Signaling and Metabolic Homeostasis

Affiliations

Mitotic Checkpoint Regulators Control Insulin Signaling and Metabolic Homeostasis

Eunhee Choi et al. Cell. .

Abstract

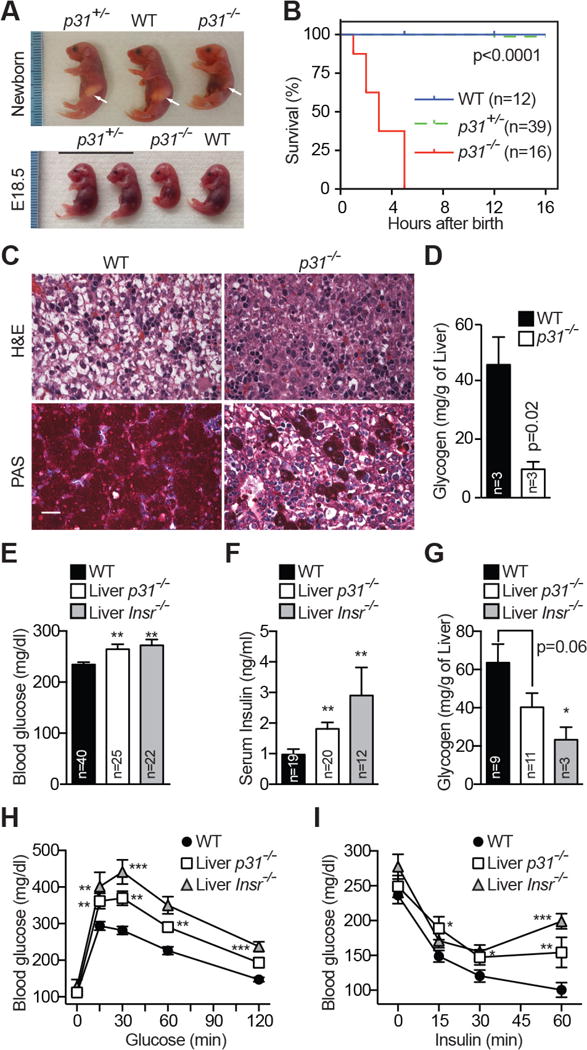
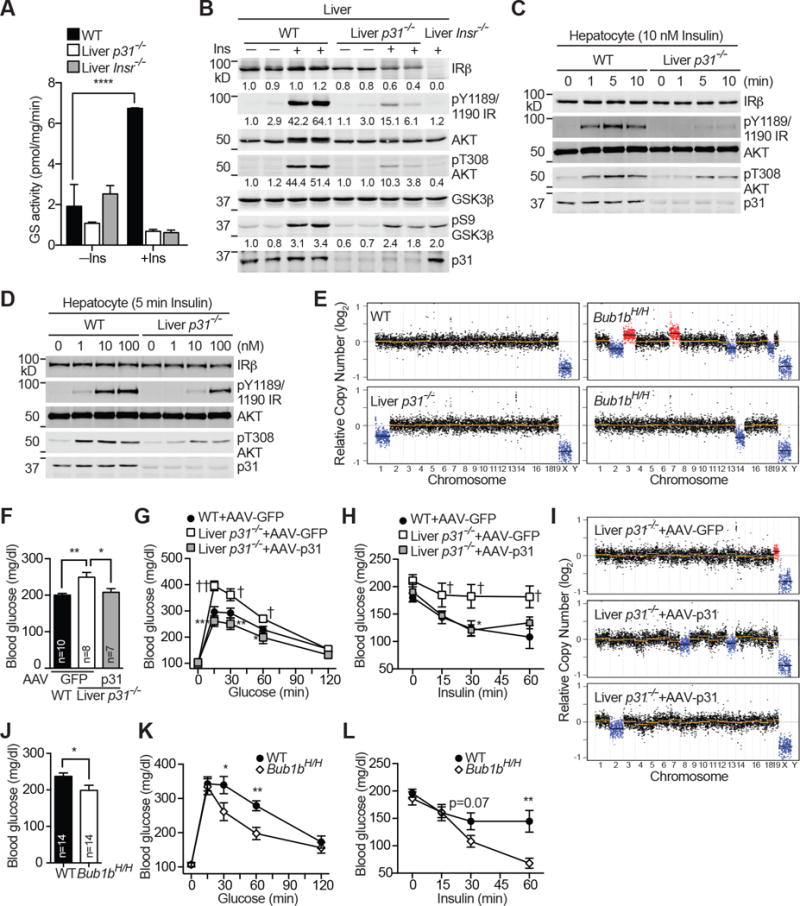
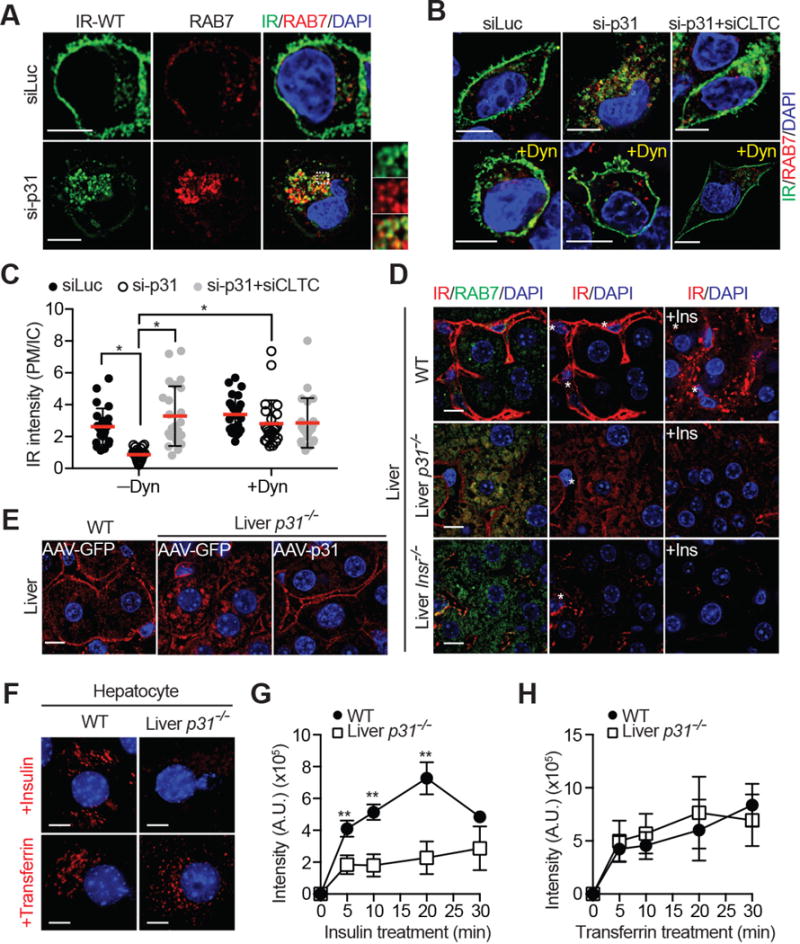
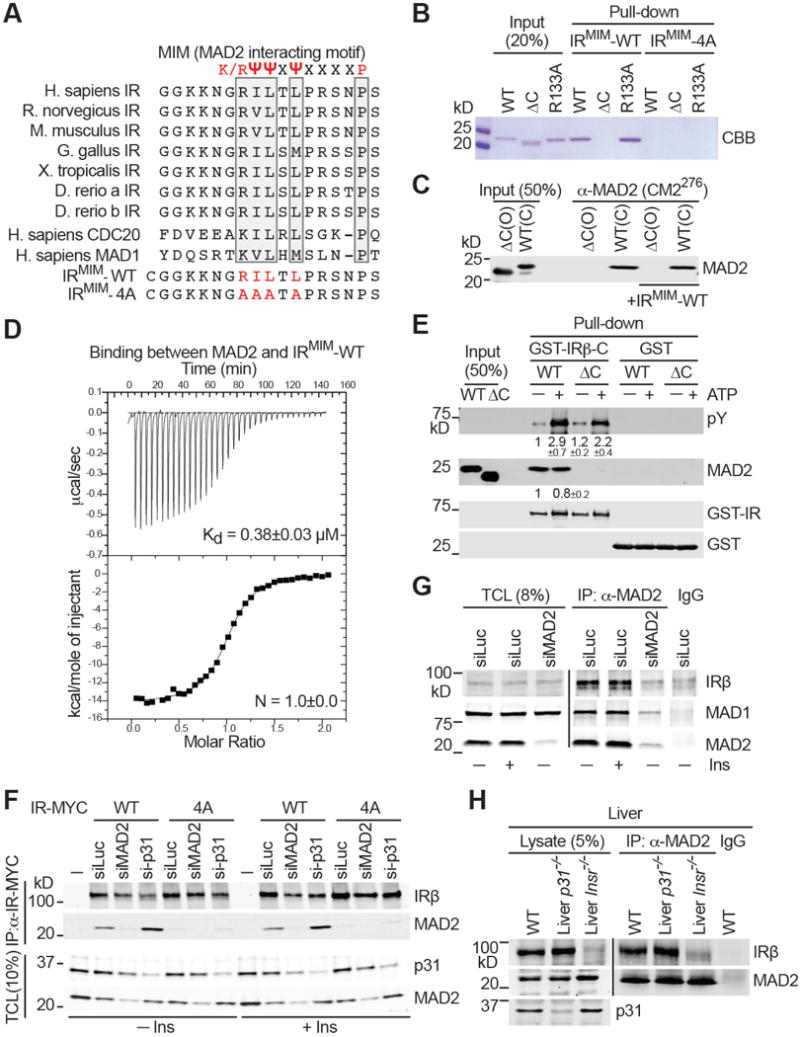
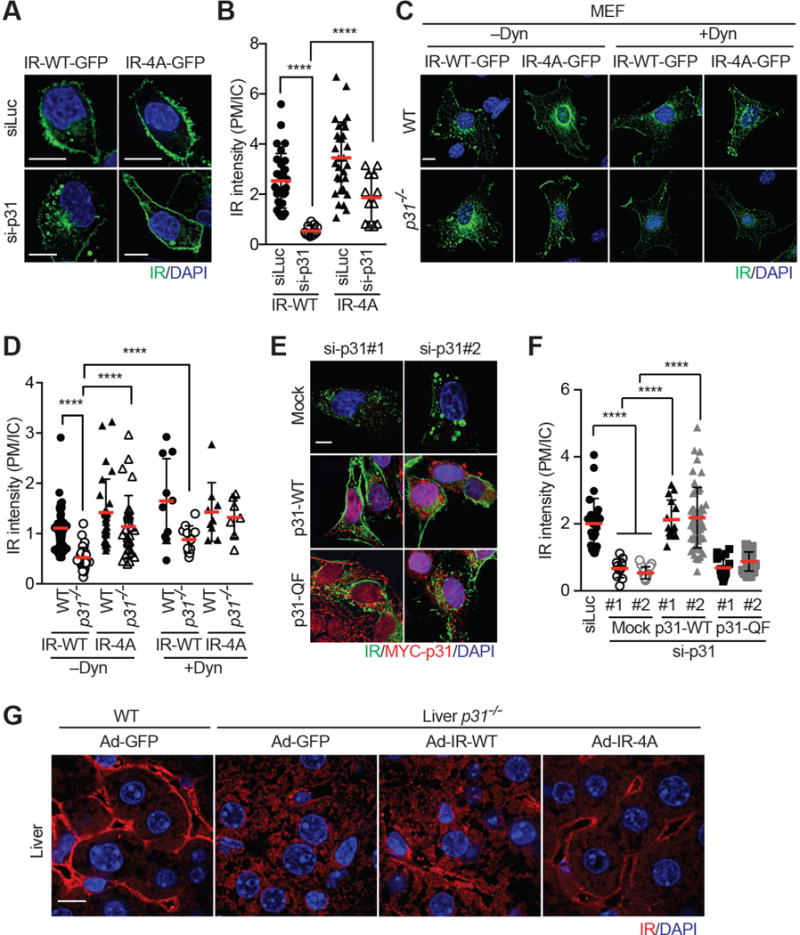
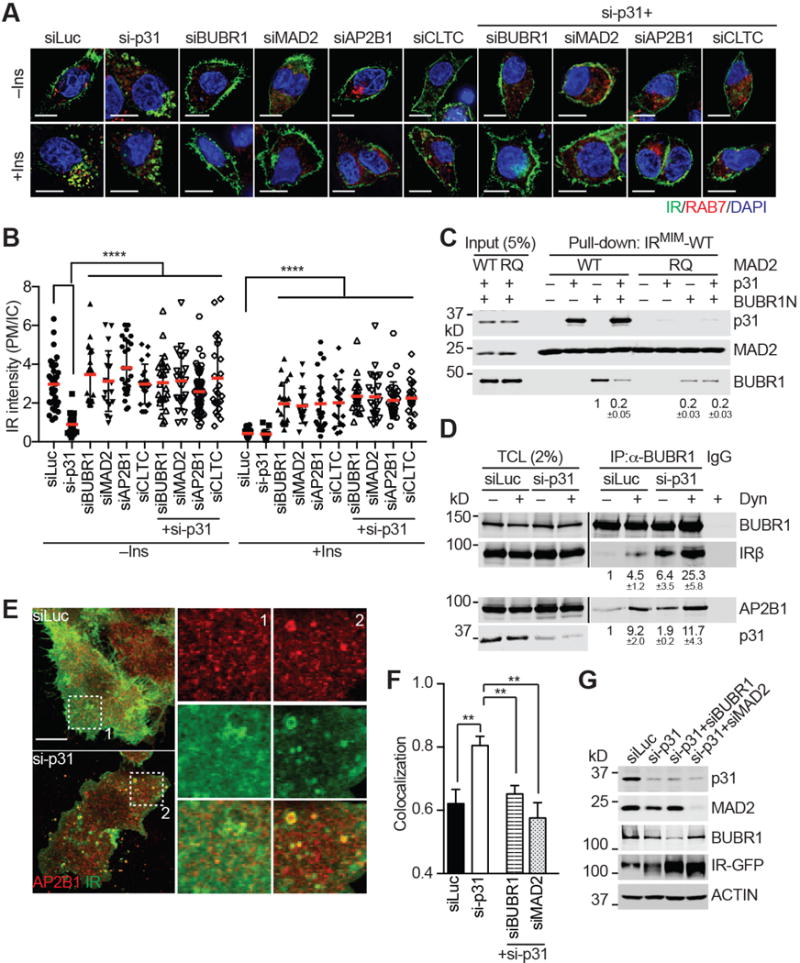
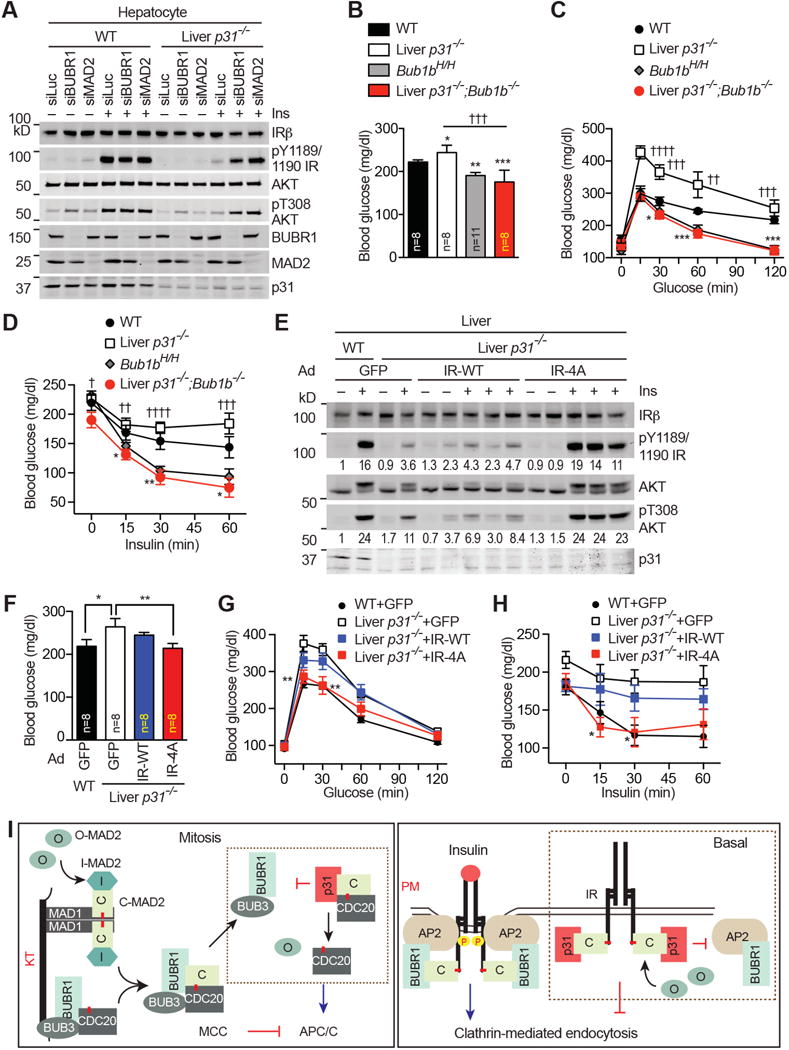
Insulin signaling regulates many facets of animal physiology. Its dysregulation causes diabetes and other metabolic disorders. The spindle checkpoint proteins MAD2 and BUBR1 prevent precocious chromosome segregation and suppress aneuploidy. The MAD2 inhibitory protein p31(comet) promotes checkpoint inactivation and timely chromosome segregation. Here, we show that whole-body p31(comet) knockout mice die soon after birth and have reduced hepatic glycogen. Liver-specific ablation of p31(comet) causes insulin resistance, hyperinsulinemia, glucose intolerance, and hyperglycemia and diminishes the plasma membrane localization of the insulin receptor (IR) in hepatocytes. MAD2 directly binds to IR and facilitates BUBR1-dependent recruitment of the clathrin adaptor AP2 to IR. p31(comet) blocks the MAD2-BUBR1 interaction and prevents spontaneous clathrin-mediated IR endocytosis. BUBR1 deficiency enhances insulin sensitivity in mice. BUBR1 depletion in hepatocytes or the expression of MAD2-binding-deficient IR suppresses the metabolic phenotypes of p31(comet) ablation. Our findings establish a major IR regulatory mechanism and link guardians of chromosome stability to nutrient metabolism.


Figures

Figure 1
Figure 1. Whole-body and Liver-specific Ablation of p31comet Reveals Its Role in Metabolism
(A) Wild-type (WT), p31+/−, and p31−/− littermate at E18.5 and birth. Arrows indicate milk spots. (B) Survival curves of WT, p31+/−, and p31−/− neonates. (C) Hematoxylin and eosin (H&E) staining and periodic acid-Schiff (PAS) staining (magenta) of livers from WT and p31−/− newborns. Scale bar, 100 μm. (D) Liver glycogen levels of WT and p31−/− newborns. (E) Fed blood glucose levels of WT, liver-p31−/−, and liver-Insr−/− mice. Mean ± SEM. *p<0.05, **p<0.01, ***p<0.0001 versus WT; Mean ± SEM (E–I). (F) Serum insulin concentrations of WT, liver-p31−/−, and liver-Insr−/− mice. (G) Liver glycogen levels of WT, liver-p31−/−, and liver-Insr−/− mice. (H) Glucose tolerance test in 2-month-old male mice. WT, n=21; liver-p31−/−, n=16; liver-Insr−/−, n=9. (I) Insulin tolerance test in 2-month-old male mice. WT, n=16; liver-p31−/−, n=9; liver-Insr−/−, n=12.
Figure 2
Figure 2. p31comet Ablation Causes Insulin Resistance whereas Bub1b Insufficiency Enhances Insulin Sensitivity
(A) Glycogen synthase activity of WT, liver-p31−/−, and liver-Insr−/− hepatocytes treated without (–) or with (+) insulin (Ins). Mean ± SD (n = 4 independent experiments). B) Immunoblots of whole liver lysates of WT, liver-p31−/−, and liver-Insr−/− mice treated without (−) or with (+) insulin (Ins). Each lane contains lysate from an individual mouse. The relative band intensities are quantified and shown below. (C & D) Insulin signaling in primary WT and liver-p31−/− hepatocytes treated with 10 nM insulin for the indicated times (C) or increasing concentrations of insulin for 5 min (D). Cell lysates were blotted with the indicated antibodies. (E) Segmentation plots of euploid (WT) and aneuploid hepatocytes from liver-p31−/− and Bub1bH/H mice. (F–H) Fed blood glucose levels (F), glucose tolerance test (G), insulin tolerance test (H) of WT and liver-p31−/− mice injected with AAV-GFP or AAV-p31. WT (AAV-GFP), n=10; liver-p31−/− (AAV-GFP), n=8; liver-p31−/− (AAV-p31), n=7; mean ± SEM. *p<0.05, **p<0.01, ***p<0.001 versus liver-p31−/− (AAV-GFP); p†<0.05, ††p<0.01 versus WT (AAV-GFP). (I) Segmentation plots of aneuploid cells from liver-p31−/− mice injected with AAV-GFP or AAV-p31. (J–L) Fed blood glucose levels (J), glucose tolerance test (K), insulin tolerance test (L) of WT and Bub1bH/H mice. For GTT and ITT, at least 12 mice in each group were analyzed. Mean ± SEM. *p<0.05, **p<0.01.
Figure 3
Figure 3. p31comet Suppresses Spontaneous IR Endocytosis in the Absence of Insulin
(A & B) HepG2 cells stably expressing IR-WT-GFP were transfected with the indicated siRNAs, serum starved, treated without or with 80 μM dynasore (Dyn), and stained with anti-GFP (IR; green) and anti-RAB7 (red) antibodies and DAPI (blue). Scale bars, 10 μm. (C) Quantification of the ratios of PM and IC IR-GFP signals of cells in (B) (mean ± SD; *p<0.0001). (D) Liver sections of WT, liver-p31−/−, and liver-Insr−/− mice injected with PBS or insulin (+Ins) were stained with anti-IR (red) and anti-RAB7 (green) antibodies and DAPI (blue). Scale bars, 10 μm. Asterisks indicate sinusoids. (E) Liver sections of WT and liver-p31−/− mice injected with AAV-GFP or AAV-p31 were stained with anti-IR (red) antibodies and DAPI (blue). Scale bars, 10 μm. (F) Representative images of endocytosis assays with Cy3-insulin and Alexa 568-transferrin in WT and liver-p31−/− hepatocytes at 20 min. The insulin and transferrin signals are shown in red. The DAPI signals are shown in blue. Scale bar, 10 μm. (G and H) Endocytosis of insulin (G) and transferrin (H) in WT and liver-p31−/− hepatocytes. The intensities of internalized fluorescent signals at the indicated times were quantified (mean ± SD; n=3 independent experiments with >70 cells analyzed at each time point).
Figure 4
Figure 4. MAD2 Binds to a Canonical MIM in the C-terminal Tail of IR
(A) Sequence alignment of the C-terminal tail of IR proteins and human CDC20 and MAD1, with the conserved residues in the MAD2-interacting motif (MIM) boxed. The MIM consensus is shown on top. Sequences of IRMIM-WT and IRMIM-4A peptides are also shown. (B) Beads coupled to IRMIM-WT or IRMIM-4A were incubated with the indicated MAD2 proteins. Input and proteins bound to beads were analyzed by SDS-PAGE and stained with Coomassie (CBB). (C) Beads coupled to a C-MAD2-specific antibody were incubated with the indicated MAD2 proteins in the presence or absence of IRMIM-WT. Input and beads-bound proteins were detected with the anti-MAD2 antibody. (D) ITC analysis of binding between MAD2 and IRMIM-WT, with the Kd and binding stoichiometry (N) indicated. (E) GST pull-down assays with recombinant GST-IRβ-C and MAD2. Input and beads-bound proteins were blotted with the indicated antibodies. The relative intensities of pY and MAD2 (mean ± SEM; n=3 independent experiments) are shown below. (F) 293FT cells were co-transfected with IR-WT-MYC or IR-4A-MYC constructs and the indicated siRNAs, serum starved, and treated without (−) or with (+) 100 nM insulin (Ins) for 20 min. The total cell lysate (TCL) and anti-MYC IP were blotted with the indicated antibodies. (G) HepG2 cells were transfected with siLuc or siMAD2, serum starved, and treated without (−) or with (+) 100 nM insulin (Ins) for 20 min. TCL, anti-MAD2 IP, and IgG IP were blotted with the indicated antibodies. (H) Total liver lysates from WT, liver-p31−/−, and liver-Insr−/− mice, and anti-MAD2 and IgG IP from these lysates were blotted with the indicated antibodies.
Figure 5
Figure 5. p31comet Suppresses Spontaneous IR Endocytosis through Counteracting the IR–MAD2 Interaction
(A) HepG2 cells stably expressing IR-WT-GFP or IR-4A-GFP were transfected with siLuc or sip31, serum starved, and stained with anti-GFP (IR; green) antibody and DAPI (blue). Scale bars, 10 μm. (B) Quantification of the ratios of PM and IC IR-GFP signal intensities in (A) (mean ± SD; ****p<0.0001). (C) WT and p31−/− MEFs were infected with IR-WT-GFP or IR-4A-GFP retroviruses, serum starved, treated without or with dynasore (Dyn), and stained with anti-GFP (IR; green) antibody and DAPI (blue). Scale bar, 10 μm. (D) Quantification of the ratios of PM and IC IR-GFP signal intensities in (C) (mean ± SD; ****p<0.0001). (E) IR-GFP-expressing HepG2 cells were co-transfected with the indicated siRNAs and plasmids, and stained with anti-GFP (IR; green) and anti-MYC (p31comet; red) antibodies, and DAPI (blue). Scale bar, 10 μm. (F) Quantification of the ratios of PM and IC IR-GFP signal intensities in (E) (mean ± SD; ****p<0.0001). (G) Liver sections of WT and liver-p31−/− mice injected with Ad-GFP, Ad-IR-WT, or Ad-IR-4A were stained with anti-IR (red) antibody and DAPI (blue). Scale bars, 10 μm.
Figure 6
Figure 6. p31comet Prevents MAD2- and BUBR1-dependent IR Endocytosis through Blocking AP2 Recruitment
(A) IR-GFP-expressing HepG2 cells were transfected with the indicated siRNAs, treated without or with 100 nM insulin (Ins) for 5 min, and stained with DAPI (blue) and anti-GFP (IR; green) and anti-RAB7 (red) antibodies. Scale bars, 10 μm. (B) Quantification of the ratios of PM and IC IR-GFP signal intensities in (A) (mean ± SD; ****p<0.0001). (C) The indicated proteins were incubated for 1 hr and added to beads coupled to the IRMIM-WT peptide. Proteins bound to beads were blotted with the indicated antibodies. The relative BUBR1 intensities (mean ± SEM; n=3 independent experiments) are shown below. (D) 293T cells were transfected with plasmids encoding MYC-BUBR1, AP2B1, and IR, and treated with or without dynasore (Dyn). The total cell lysates (TCL), anti-MYC IP, and IgG IP were blotted with the indicated antibodies. The relative intensities of IRβ and AP2B1 (mean ± SEM; n=3 independent experiments) are shown below. (E) HepG2 cells stably expressing IR-WT-GFP were transfected with the indicated siRNAs, and stained with anti-GFP (IR; green) and anti-AP2B1 (red) antibodies. Two boxed regions (1 and 2) were magnified and shown. Scale bar, 10 μm. (F) Quantification of the Manders’ coefficients of IR and AP2B1 co-localization in (E) (mean ± SEM; siLuc, n=16; si-p31, n=26; si-p31/siBUBR1, n=12; si-p31/siMAD2, n=11; **p<0.005). (G) Western blot analysis of cell lysates in (E and F).
Figure 7
Figure 7. The p31comet–MAD2–BUBR1 Module Controls Insulin Signaling
(A) Hepatocytes from WT and liver-p31−/− mice were transfected with siRNAs, serum starved, and then treated with 10 nM insulin (Ins) for 5 min. Cell lysates were blotted with the indicated antibodies. (B–D) Fed blood glucose levels (B), glucose tolerance test (C), and insulin tolerance test (D) of WT, liver-p31−/−, Bub1bH/H, and liver-p31−/−;Bub1b−/− mice. At least 8 mice in each group were analyzed. Mean ± SEM. *p<0.05, **p<0.01, ***p<0.001, ****p<0.0001 versus WT; p†<0.05, ††p<0.01, †††p<0.001, ††††p<0.0001 versus liver-p31−/−;Bub1b−/−. (E) Immunoblots of whole liver lysates of WT and liver-p31−/− mice injected with Ad-GFP, Ad IR-WT or Ad-IR-4A, and treated without or with insulin (Ins). Each lane contains lysate from an individual mouse. The relative band intensities were quantified below. (F–H) Fed blood glucose levels (F), glucose tolerance test (G), and insulin tolerance test (H) of WT and liver-p31−/− mice injected with Ad-GFP, Ad-IR-WT, or Ad-IR-4A. At least 8 mice in each group were analyzed. Mean ± SEM. *p<0.05, **p<0.01 versus liver-p31−/− (Ad-GFP). (I) Left and right panels depict the roles of the p31comet-MAD2-BUBR1 module in mitosis and insulin signaling, respectively. The red lines in MAD1, CDC20, and IR indicate the MAD2-interacting motif (MIM).

Comment in

Similar articles

Cited by

References

    1. Baker DJ, Dawlaty MM, Wijshake T, Jeganathan KB, Malureanu L, van Ree JH, Crespo-Diaz R, Reyes S, Seaburg L, Shapiro V, et al. Increased expression of BubR1 protects against aneuploidy and cancer and extends healthy lifespan. Nat Cell Biol. 2013;15:96–102. - PMC - PubMed
    1. Baker DJ, Jeganathan KB, Cameron JD, Thompson M, Juneja S, Kopecka A, Kumar R, Jenkins RB, de Groen PC, Roche P, et al. BubR1 insufficiency causes early onset of aging-associated phenotypes and infertility in mice. Nat Genet. 2004;36:744–749. - PubMed
    1. Biddinger SB, Hernandez-Ono A, Rask-Madsen C, Haas JT, Aleman JO, Suzuki R, Scapa EF, Agarwal C, Carey MC, Stephanopoulos G, et al. Hepatic insulin resistance is sufficient to produce dyslipidemia and susceptibility to atherosclerosis. Cell Metab. 2008;7:125–134. - PMC - PubMed
    1. Bluher M, Kahn BB, Kahn CR. Extended longevity in mice lacking the insulin receptor in adipose tissue. Science. 2003;299:572–574. - PubMed
    1. Boucher J, Kleinridders A, Kahn CR. Insulin receptor signaling in normal and insulin-resistant states. Cold Spring Harb Perspect Biol. 2014;6:a009191. - PMC - PubMed

Publication types

MeSH terms