. 2016 Jun 10:7:11815.
doi: 10.1038/ncomms11815.

Circulating tumour DNA profiling reveals heterogeneity of EGFR inhibitor resistance mechanisms in lung cancer patients

Affiliations

Circulating tumour DNA profiling reveals heterogeneity of EGFR inhibitor resistance mechanisms in lung cancer patients

Jacob J Chabon et al. Nat Commun. .

Erratum in

Abstract

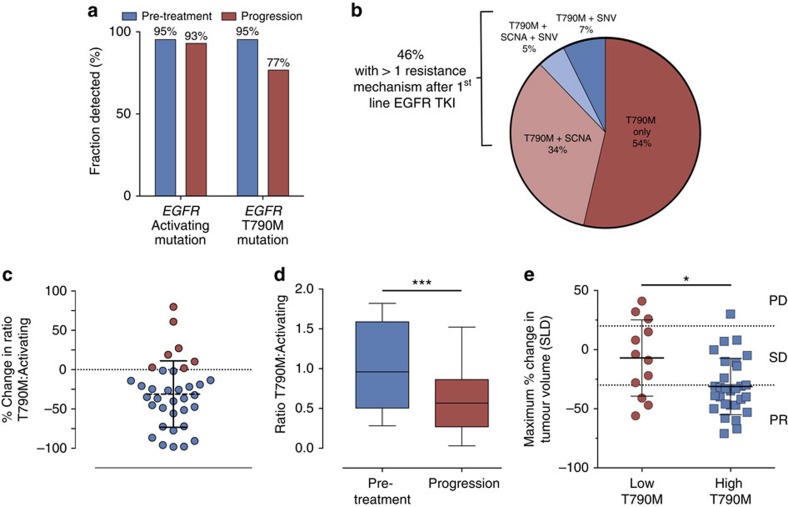
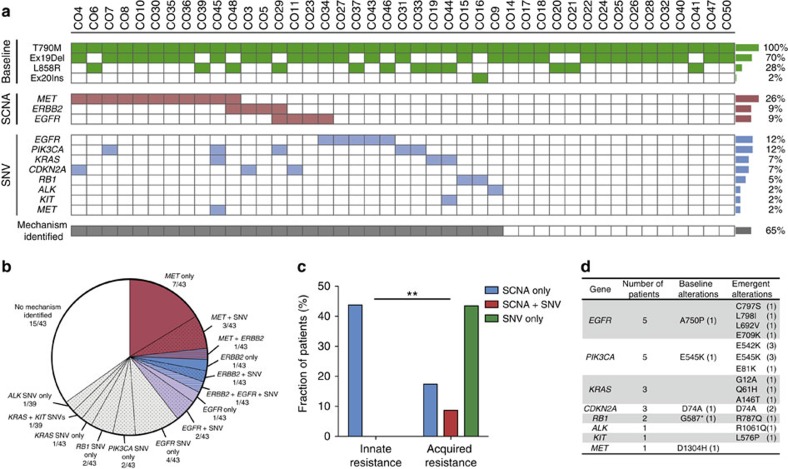
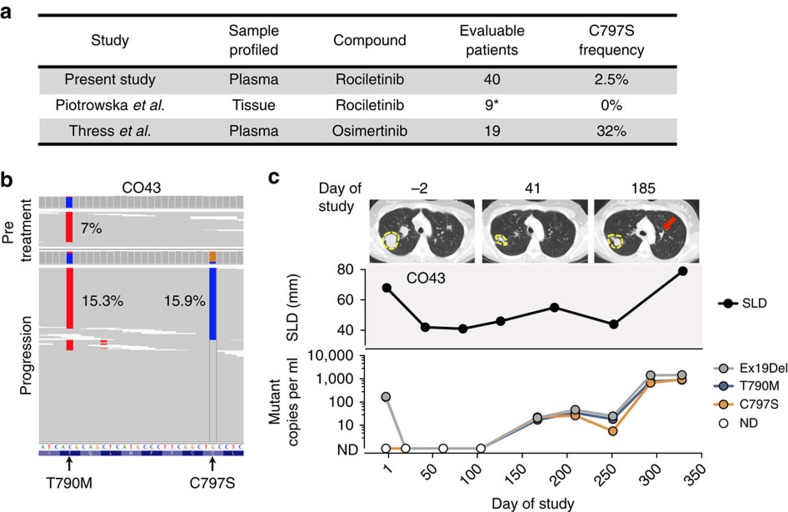
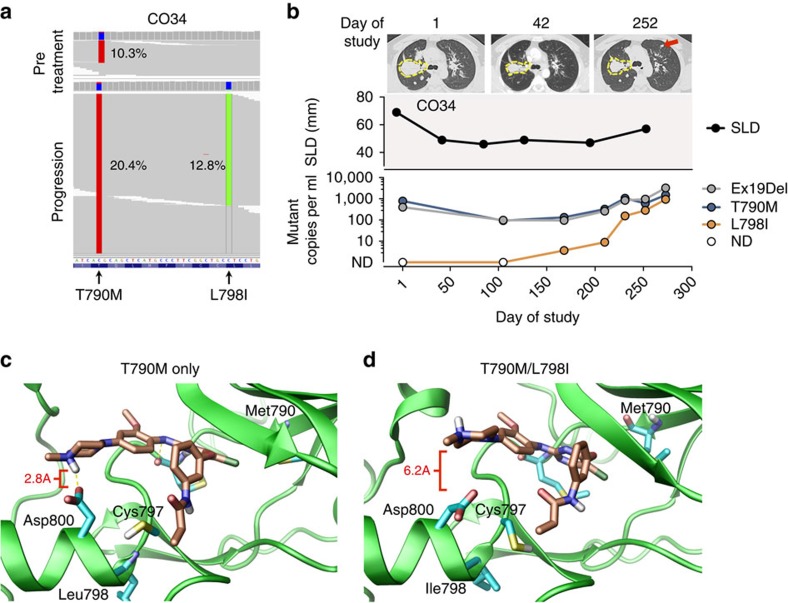
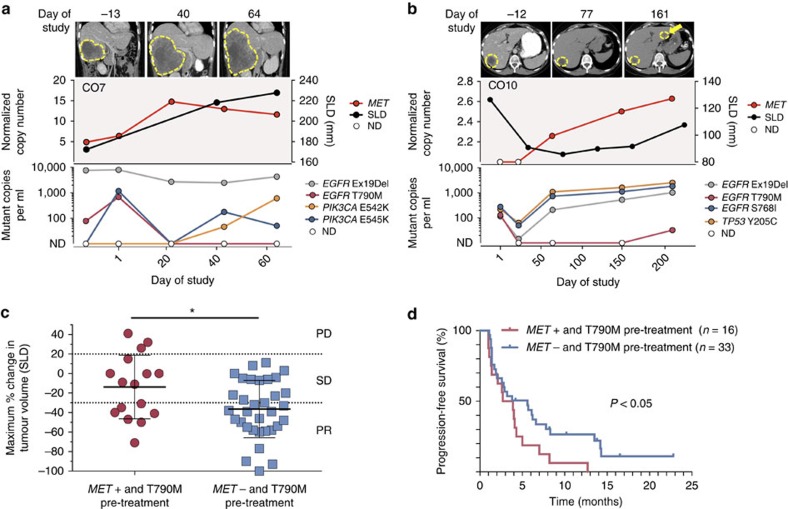
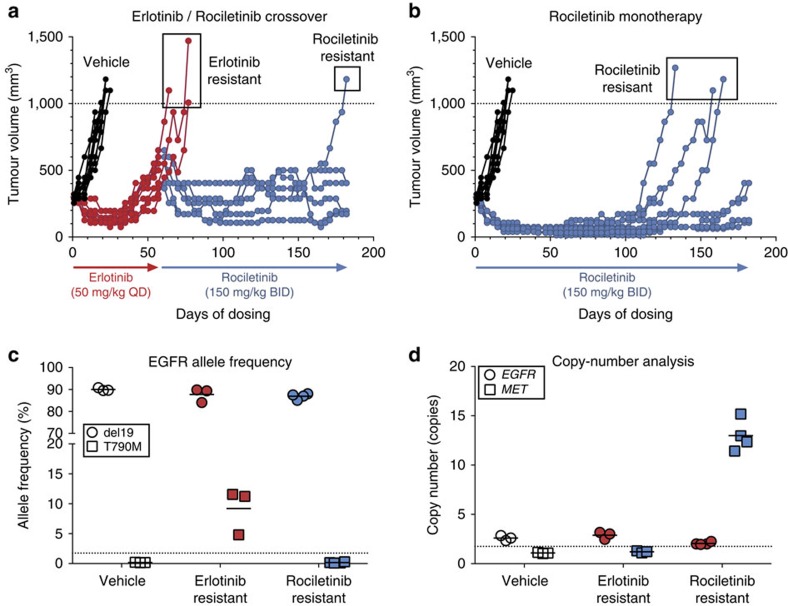
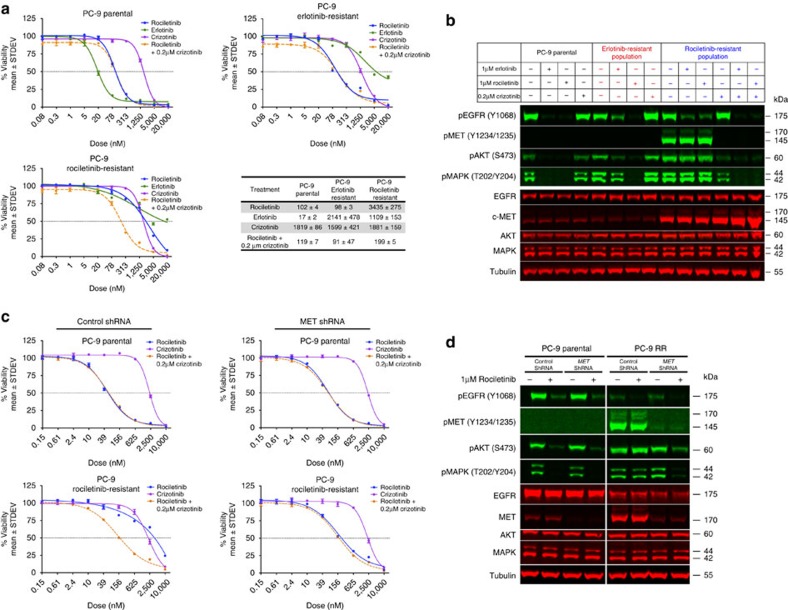
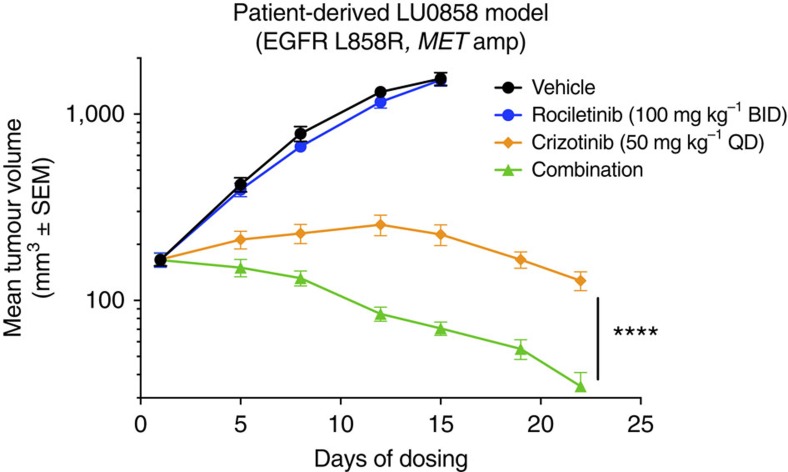
Circulating tumour DNA (ctDNA) analysis facilitates studies of tumour heterogeneity. Here we employ CAPP-Seq ctDNA analysis to study resistance mechanisms in 43 non-small cell lung cancer (NSCLC) patients treated with the third-generation epidermal growth factor receptor (EGFR) inhibitor rociletinib. We observe multiple resistance mechanisms in 46% of patients after treatment with first-line inhibitors, indicating frequent intra-patient heterogeneity. Rociletinib resistance recurrently involves MET, EGFR, PIK3CA, ERRB2, KRAS and RB1. We describe a novel EGFR L798I mutation and find that EGFR C797S, which arises in ∼33% of patients after osimertinib treatment, occurs in <3% after rociletinib. Increased MET copy number is the most frequent rociletinib resistance mechanism in this cohort and patients with multiple pre-existing mechanisms (T790M and MET) experience inferior responses. Similarly, rociletinib-resistant xenografts develop MET amplification that can be overcome with the MET inhibitor crizotinib. These results underscore the importance of tumour heterogeneity in NSCLC and the utility of ctDNA-based resistance mechanism assessment.


Conflict of interest statement

A.M.N., A.A.A. and M.D. are co-inventors on patent applications, ‘An analytical platform for patient-specific profiling of circulating neoplastic DNA' 14/209,807 and, ‘Practical Methods for Patient-Specific Tumour Markers for Disease Monitoring of Cancer' PCT/US2015/049838, related to CAPP-Seq. A.M.N., A.A.A. and M.D. are consultants for Roche Molecular Diagnostics. A.D.S., C.A.K., H.J.H. and T.C.H. are employees of Clovis Oncology. C.A.K. has ownership interest in Clovis Oncology. Z.P. has received speakers bureau honoraria from Clovis Oncology. H.A.W. has received commercial research grants from Clovis Oncology. L.V.S. and J.W.N. are consultants for Clovis Oncology. The remaining authors declare no competing financial interests.

Figures

Figure 1
Figure 1. Heterogeneity of resistance mechanisms and EGFR mutation dynamics in response to EGFR TKIs.
(a) Detection of EGFR-activating and T790M resistance mutations in pre-treatment and progression plasma samples from rociletinib-treated patients (n=43) using CAPP-Seq. (b) Summary of putative resistance mechanisms to first- and second-generation EGFR TKIs present in the pre-rociletinib plasma sample of patients with T790M mutations (n=41). (c) The percent change in the relative ratio of T790M to activating mutation alleles in progression plasma samples compared with pre-treatment samples from rociletinib-treated patients. Patients in whom the ratio decreased (n=28) are coloured blue and patients in whom the ratio increased (n=7) are coloured red. Only patients in whom both activating and T790M mutations were detectable pre-treatment, and activating mutations were detectable at progression are included. (d) Box and Whisker plots depicting the relative ratio of T790M and activating mutation alleles in pre-treatment and progression plasma samples from rociletinib-treated patients. The solid box represents the interquartile range of values and whiskers represent the 10th and 90th percentile values. All patients depicted in c are included. (n=35, ***P<0.0005, Wilcoxon signed-rank test). (e) Comparison of the ratio of T790M to EGFR-activating mutation in pre-treatment plasma samples and the best RECIST response to treatment with rociletinib. Patients with low baseline T790M (n=12, ratio ≤0.5) have significantly less reduction in tumour volume than patients with high baseline T790M (n=29, ratio > 0.5; * P<0.05, Wilcoxon rank-sum test). Only patients in whom both activating and T790M mutations were detectable pre-treatment are included.
Figure 2
Figure 2. Inter- and intra-patient heterogeneity of resistance mechanisms to rociletinib.
(a) Summary of putative resistance mechanisms to rociletinib identified by CAPP-Seq. T790M and EGFR-activating mutations detected in plasma at one or more time points are indicated in green (n=43). Only alterations that were emergent or increased in relative abundance following therapy are shown. Somatic copy-number alteration (SCNA) and single-nucleotide variant (SNV) identification was not feasible in all plasma samples due to low or undetectable ctDNA levels. (b) Summary of putative resistance mechanisms to rociletinib organized by gene. Red, blue and purple signify the presence of a SCNA affecting MET, ERBB2 or EGFR, respectively. Grey signifies the presence of one or more SNVs in patients without SCNAs. Striped shading represents the concurrent presence of multiple SCNA's, black dots represent the presence of one or more SNVs, and solid white indicates patients in whom no mechanism was identified. (c) Comparison of putative resistance mechanisms in patients with innate and acquired resistance to rociletinib. Patients with innate resistance (n=15) were defined as those with progression-free survival (PFS) of less than 3 months, and patients with acquired resistance were defined as those with PFS of greater than 3 months (n=28). The mechanisms identified were significantly different in patients with innate versus acquired resistance (**P<0.005; Fisher's exact test). (d) Baseline and emergent SNVs detected by CAPP-Seq in the plasma of patients treated with rociletinib. Only SNVs that were emergent or increased in relative abundance following therapy are shown. The number of patients with each specific variant is indicated in parentheses.
Figure 3
Figure 3. EGFR C797S is an infrequent mechanism of rociletinib resistance.
(a) The prevalence of EGFR C797S mutations reported in post-treatment tissue biopsies or plasma samples following treatment with the third-generation EGFR TKIs rociletinib and osimertinib. Only patients with detectable EGFR-activating mutations in progression tissue or plasma are considered (*=only patients unique to the Piotrowska et al. study were included). (b) An acquired EGFR C797S mutation was observed in cis with T790M in progression plasma from CO43. The allele fraction of each mutation in pre-treatment and progression plasma is shown. (c) Serial tumor and ctDNA measurements from CO43. Representative CT scans at the time points indicated are provided; the largest target lesion is outlined and the emergence of a new lesion is indicated with an arrow. The upper panel displays the tumor volume represented by the sum of longest diameters (SLD) of target lesions. The lower panel displays alterations in EGFR detected in plasma. ND, not detected.
Figure 4
Figure 4. EGFR L798I mediates rociletinib resistance.
(a) An acquired EGFR L798I mutation was observed in cis with T790M in progression plasma from CO34. The allele fraction of each mutation in pre-treatment and progression plasma is shown. (b) Serial tumour and ctDNA measurements from CO34. Representative CT scans at the time points indicated are provided; the largest target lesion is outlined, and the emergence of a new lesion is indicated with an arrow. The upper panel displays the tumour volume represented by the sum of longest diameters (SLD) of target lesions. The lower panel displays alterations in EGFR detected in plasma. ND, not detected. (c,d) Structural modelling of rociletinib binding to (c) EGFRT790M and (d) EGFRT790M/L798I. The EGFR kinase is shown in a ribbon representation (green) with rociletinib in orange. Hydrogen bonding (yellow dashed lines) between the Asp800 residue in EGFRT790M and the quaternary piperazine NH+ of rociletinib is disrupted in the EGFRT790M/L798I mutant as a result of increased separation (average distance of 2.8A versus 6.2A in EGFRT790M and EGFRT790M/L798I, respectively; red brackets). In the EGFRT790M/L798I mutant the orientation of Cys797 for reactivity with rociletinib is less optimal due to the loss of stabilizing interactions and other subtle angle changes.
Figure 5
Figure 5. MET copy-number gain mediates innate and acquired resistance to rociletinib.
(a,b) Representative vignettes of patients with innate (a) and acquired (b) resistance to rociletinib. The upper panel displays representative CT scans at the time points indicated; lesions are outlined, and the emergence of a new lesion is indicated with an arrow. The middle panel displays the copy number of MET detected in plasma normalized by % ctDNA and the tumour volume represented by the sum of longest diameters (SLD) of target lesions. The lower panel displays SNVs detected in plasma. ND, not detected. (c) Scatter plot showing best RECIST response following rociletinib treatment in patients whose tumours had both T790M mutations and MET copy-number gain detected in tissue or plasma prior to rociletinib treatment (red; n=16) and those with T790M-mutant tumours confirmed negative for MET amplification by FISH (blue; n=33; * P<0.05, Wilcoxon rank-sum test). The mean and standard deviation are indicated with a solid line and whiskers, respectively. (d) Kaplan–Meier plot of progression-free survival of patients with T790M-mutant tumours with (red; n=16) or without (blue; n=33) evidence of MET copy-number gain prior to rociletinib treatment. Progression was defined according to RECIST 1.1 methodology. Patients alive without progression by RECIST 1.1 were censored at their last evaluable radiologic disease assessment date before the data-cutoff date. Small vertical lines represent censored events; statistical significance was assessed using a log-rank (Mantel–Cox) test (P<0.05).
Figure 6
Figure 6. MET amplification arises in xenograft models of acquired resistance to rociletinib.
(a,b) Mice bearing PC-9 NSCLC xenograft tumours (Ex19Del) were treated with the compounds, doses and schedules indicated (n=10 per group). Each line represents an individual animal. On day 60 the erlotinib-treated cohort was split into 2 groups and 3 animals continued on erlotinib while the rest (n=7) were crossed-over to rociletinib. The mean tumour volume in erlotinib monotherapy, erlotinib crossover, and rociletinib monotherapy treated animals was compared using the Wilcoxon rank-sum test. (c,d) Next-generation sequencing was used to assess (c) Ex19Del and T790M allele frequencies and (d) EGFR/MET copy number in the tumours collected at endpoint from mice in the vehicle (n=3), erlotinib resistant (n=3) and rociletinib-resistant (n=4) groups.
Figure 7
Figure 7. The MET inhibitor crizotinib restores rociletinib sensitivity and downstream pathway suppression.
(a) Erlotinib resistant (ER) and rociletinib-resistant (RR) tumour-derived cell lines respond to rociletinib and rociletinib combined with crizotinib, respectively. Cell viability was evaluated in ER and RR tumour-derived cell lines after treatment with erlotinib, rociletinib and/or crizotinib for 72 h. Experiments were performed in triplicate, repeated three times and data are plotted as mean percentage viability±s.d. relative to control. The data summary table reflects these 3 experiments and the values reported are the mean 50% growth inhibition±s.d. (nM). (b) Western blot analysis of PC-9 parental, erlotinib resistant, and rociletinib-resistant cell lines following 1-h incubations with the compounds indicated. (c) PC-9 parental and rociletinib-resistant tumour-derived cell lines were infected with a lentivirus expressing MET-specific or scrambled control shRNAs. Cell viability was evaluated after treatment with rociletinib and/or crizotinib for 72 h. Data are plotted as mean percentage viability±s.d. relative to control. (d) Western blot analysis of PC-9 parental and rociletinib-resistant (RR) cell lines transfected with control or MET shRNA and treated with rociletinib.
Figure 8
Figure 8. The MET inhibitor crizotinib restores rociletinib sensitivity in a patient-derived NSCLC xenograft model of innate rociletinib resistance.
Mice bearing LU0858 NSCLC patient-derived xenograft tumours (L858R mutant and 14-copy MET amplification) were orally administered rociletinib, crizotinib or the combination using the doses and schedules indicated (n=10 per group). The endpoint tumour volumes between the crizotinib and combination groups on day 22 were compared using a paired two tailed student's t-test (n=10; ****P<0.0001).

Comment in

Similar articles

Cited by

References

    1. Paez J. G. et al.. EGFR mutations in lung cancer: correlation with clinical response to gefitinib therapy. Science 304, 1497–1500 (2004). - PubMed
    1. Lynch T. J. et al.. Activating mutations in the epidermal growth factor receptor underlying responsiveness of non–small-cell lung cancer to gefitinib. N. Engl. J. Med. 350, 2129–2139 (2004). - PubMed
    1. Pao W. et al.. EGF receptor gene mutations are common in lung cancers from ‘never smokers' and are associated with sensitivity of tumors to gefitinib and erlotinib. Proc. Natl Acad. Sci. USA 101, 13306–13311 (2004). - PMC - PubMed
    1. Mok T. S. et al.. Gefitinib or carboplatin–paclitaxel in pulmonary adenocarcinoma. N. Engl. J. Med. 361, 947–957 (2009). - PubMed
    1. Maemondo M. et al.. Gefitinib or chemotherapy for non-small-cell lung cancer with mutated EGFR. N. Engl. J. Med. 362, 2380–2388 (2010). - PubMed

Publication types

MeSH terms