

Meta-analysis of studies using statins as a reducer for primary liver cancer risk
- PMID: 27198922
- PMCID: PMC4873806
- DOI: 10.1038/srep26256
Meta-analysis of studies using statins as a reducer for primary liver cancer risk
Abstract
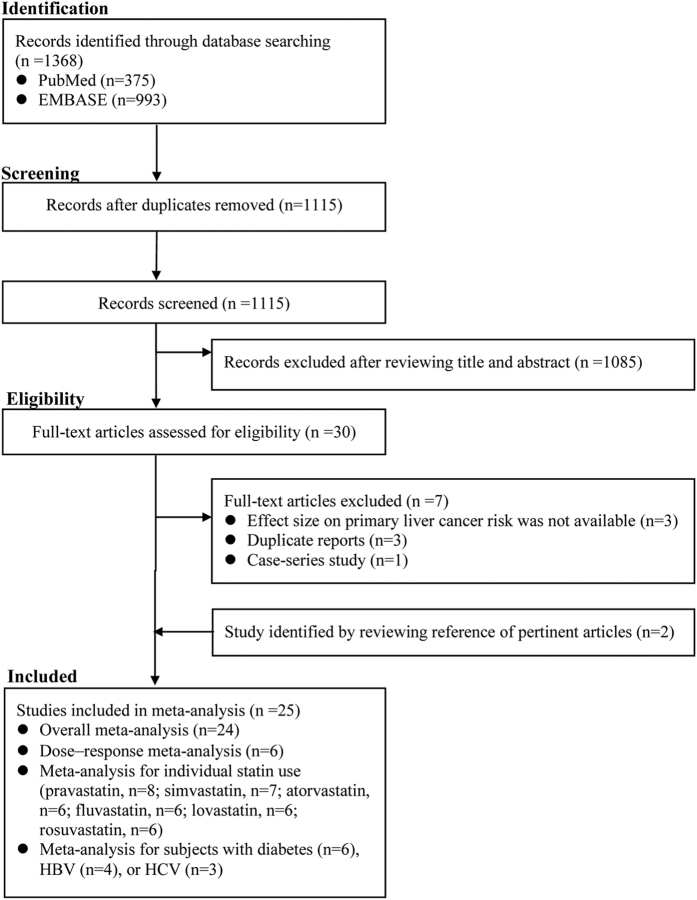
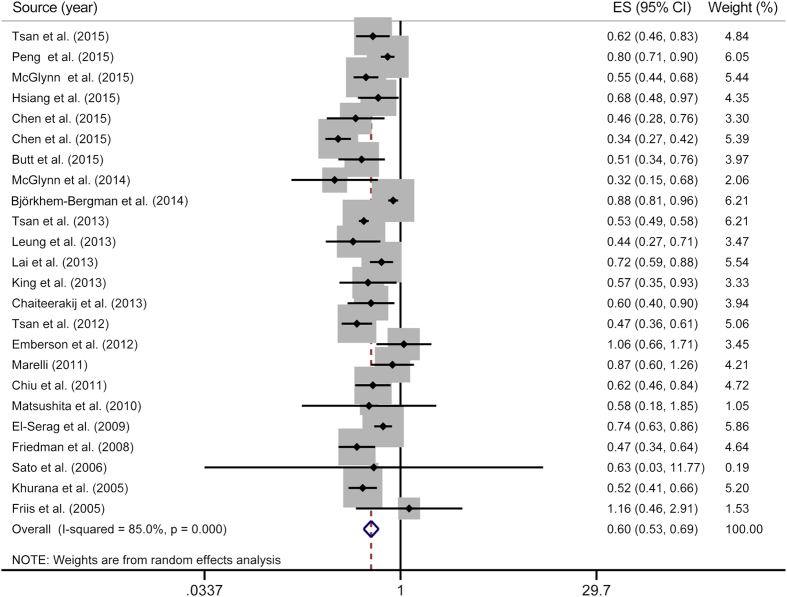
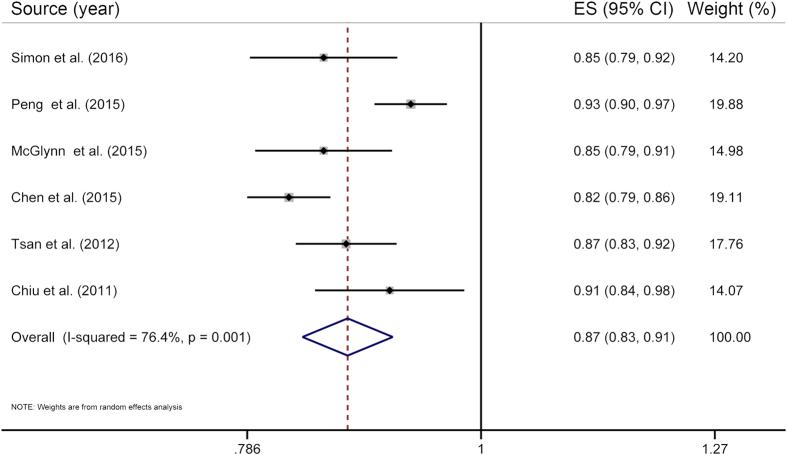
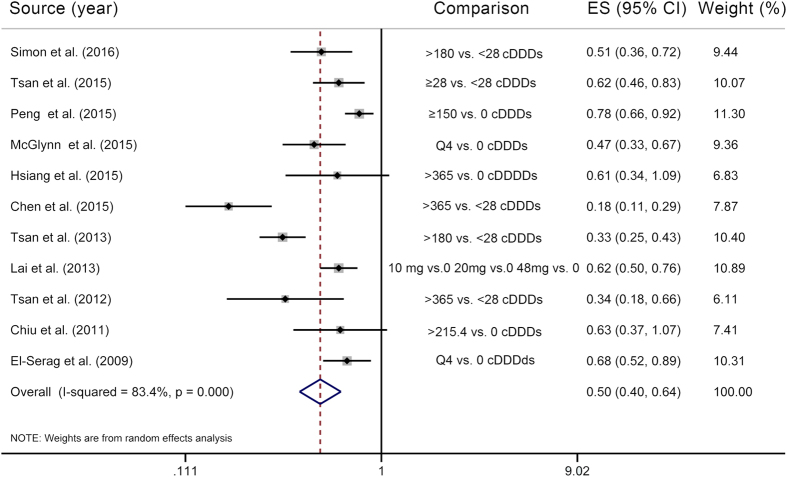
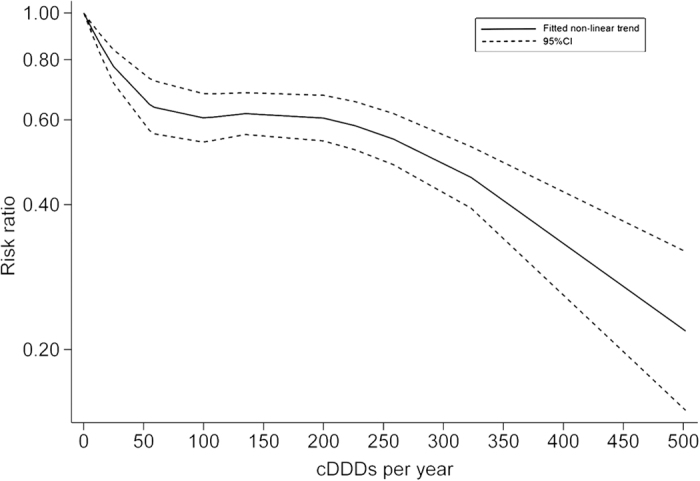
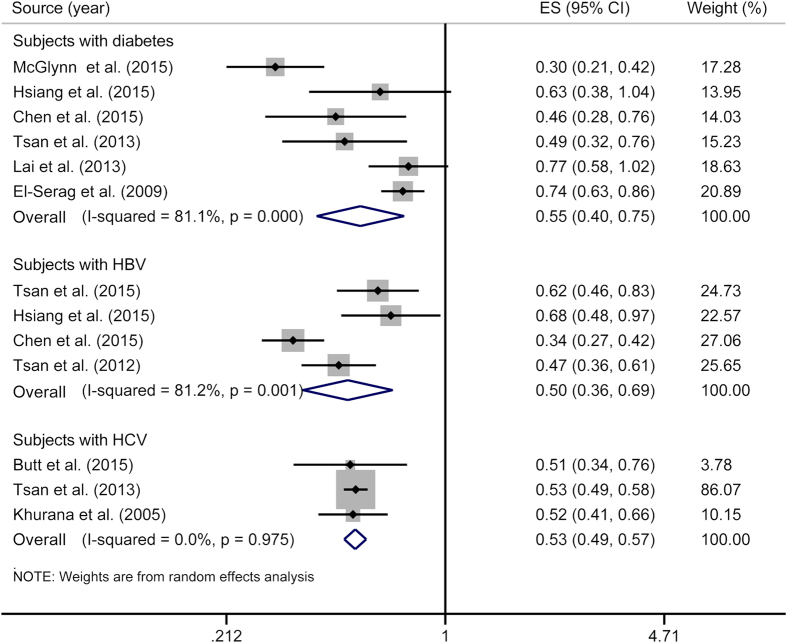
A protective effect of statins on primary liver cancer (PLC) risk has been suggested. However, issues about the dose-response relationship, the protective effect of individual statins, and PLC risk reduction among at-risk populations remain unsolved. Therefore, a meta-analysis was conducted. PubMed and EMBASE were searched for studies providing the risk ratio (RR) on statins and PLC risk. Summary RRs were calculated using a random-effects model. Twenty-five studies were identified. Stain use was significantly associated with a reduced risk of PLC (RR = 0.60, 95% confidence interval (CI) = 0.53-0.69). The summary RR for every additional 50 cumulative defined daily doses per year was 0.87 (95% CI = 0.83-0.91). Evidence of a non-linear dose-response relationship between statins and PLC risk was found (Pnon-linearity < 0.01). All individual statins significantly reduced PLC risk, and the risk reduction was more evident with rosuvastatin. The inverse association between statins and PLC risk remained among populations with common risk factors. Subgroup analyses revealed more significant reduction in PLC risk by statins in high- versus non-high-risk populations (Pinteraction = 0.02). Overall, these findings add to our understanding of the association between statins and PLC risk. Whether statin use is causally associated with a reduced risk of PLC should be further studied.
Figures
Similar articles
-
Reproductive factors, menopausal hormone therapies and primary liver cancer risk: a systematic review and dose-response meta-analysis of observational studies.Hum Reprod Update. 2016 Dec;23(1):126-138. doi: 10.1093/humupd/dmw037. Epub 2016 Sep 21. Hum Reprod Update. 2016. PMID: 27655589 Review.
-
The benefit of statins in chronic hepatitis C patients: a systematic review and meta-analysis.Eur J Gastroenterol Hepatol. 2017 Jul;29(7):759-766. doi: 10.1097/MEG.0000000000000867. Eur J Gastroenterol Hepatol. 2017. PMID: 28240613 Review.
-
Systematic review with network meta-analysis: statins and risk of hepatocellular carcinoma.Oncotarget. 2016 Apr 19;7(16):21753-62. doi: 10.18632/oncotarget.7832. Oncotarget. 2016. PMID: 26943041 Free PMC article. Review.
-
Statins intake and risk of liver cancer: A dose-response meta analysis of prospective cohort studies.Medicine (Baltimore). 2017 Jul;96(27):e7435. doi: 10.1097/MD.0000000000007435. Medicine (Baltimore). 2017. PMID: 28682909 Free PMC article.
-
A Meta-Analysis of Statin Use and Risk of Hepatocellular Carcinoma.Can J Gastroenterol Hepatol. 2022 Mar 20;2022:5389044. doi: 10.1155/2022/5389044. eCollection 2022. Can J Gastroenterol Hepatol. 2022. PMID: 35356132 Free PMC article.
Cited by
-
Statins in Hepatitis B or C Patients Is Associated With Reduced Hepatocellular Carcinoma Risk: A Systematic Review and Meta-Analysis.Turk J Gastroenterol. 2022 Feb;33(2):136-144. doi: 10.5152/tjg.2020.19656. Turk J Gastroenterol. 2022. PMID: 35115293 Free PMC article.
-
Encapsulation of Lovastatin in Zein Nanoparticles Exhibits Enhanced Apoptotic Activity in HepG2 Cells.Int J Mol Sci. 2019 Nov 18;20(22):5788. doi: 10.3390/ijms20225788. Int J Mol Sci. 2019. PMID: 31752085 Free PMC article.
-
The Association between Statins and Liver Cancer Risk in Patients with Heart Failure: A Nationwide Population-Based Cohort Study.Cancers (Basel). 2023 May 29;15(11):2959. doi: 10.3390/cancers15112959. Cancers (Basel). 2023. PMID: 37296921 Free PMC article.
-
Effects of primary hypertension treatment in the oncological outcomes of hepatocellular carcinoma.Ann Transl Med. 2020 Jul;8(14):844. doi: 10.21037/atm.2020.04.40. Ann Transl Med. 2020. PMID: 32793688 Free PMC article. No abstract available.
-
Statin therapy: a potential adjuvant to immunotherapies in hepatocellular carcinoma.Front Pharmacol. 2024 Feb 1;15:1324140. doi: 10.3389/fphar.2024.1324140. eCollection 2024. Front Pharmacol. 2024. PMID: 38362156 Free PMC article. Review.
References
-
- Ferlay J. et al.. Cancer Incidence and Mortality Worldwide: IARC CancerBase No. 11 [Internet]. Lyon, France: International Agency for Research on Cancer. GLOBOCAN 2012 v1.0. (2013) Available at: http://globocan.iarc.fr. (Accessed: 20th January 2014).
Publication types
MeSH terms
Substances
LinkOut - more resources
Full Text Sources
Other Literature Sources
Medical
