. 2016 May 6:6:25658.
doi: 10.1038/srep25658.

Trafficking of Endogenous Immunoglobulins by Endothelial Cells at the Blood-Brain Barrier

Affiliations

Trafficking of Endogenous Immunoglobulins by Endothelial Cells at the Blood-Brain Barrier

Roberto Villaseñor et al. Sci Rep. .

Abstract

The Blood-Brain Barrier (BBB) restricts access of large molecules to the brain. The low endocytic activity of brain endothelial cells (BECs) is believed to limit delivery of immunoglobulins (IgG) to the brain parenchyma. Here, we report that endogenous mouse IgG are localized within intracellular vesicles at steady state in BECs in vivo. Using high-resolution quantitative microscopy, we found a fraction of endocytosed IgG in lysosomes. We observed that loss of pericytes (key components of the BBB) in pdgf-b(ret/ret) mice affects the intracellular distribution of endogenous mouse IgG in BECs. In these mice, endogenous IgG was not detected within lysosomes but instead accumulate at the basement membrane and brain parenchyma. Such IgG accumulation could be due to reduced lysosomal clearance and increased sorting to the abluminal membrane of BECs. Our results suggest that, in addition to low uptake from circulation, IgG lysosomal degradation may be a downstream mechanism by which BECs further restrict IgG access to the brain.


Conflict of interest statement

R.V., L.O., F.G., H.L., P.-O.F. and L.C. are all are under paid employment by the company F. Hoffmann-La Roche. R.V. is a Roche post-doctoral fellow.

Figures
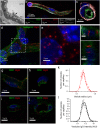
Figure 1
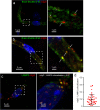
Figure 1. Intracellular localization of endogenous mIgG in brain endothelial cells.
(a) Representative TEM cross-section of a brain cortical microvessel. The arrow points to a non-coated vesicle budding from the luminal membrane, the arrowhead points to a clathrin-coated-vesicle and the asterisk marks an intracellular vesicle. BEC, Brain Endothelial Cell; TJ, Tight Junction; BL, Basal Lamina; Per, Pericyte. (b,c) Representative 3D reconstruction of the NVU showing a BEC (marked by CD31 expression, green), Pericyte (marked by CD13 expression, red) within the Basal Lamina (CollagenIV, grey). The cross-section in the right panel (c) is a single optical section to highlight the vascular lumen. (d–f) Representative 3D reconstruction of a microvessel (marked by CollagenIV, green) with mIgG (red) in punctate structures (d). (e) shows a high magnification 3D reconstruction of the boxed area. Cross-sections in (f) show that vesicles are within the Basal Lamina and not in the parenchymal space. (g–j) Representative single optical sections of mIgG puncta localizing specifically within BECs marked with CD31 in green (g,h) but not in pericytes marked with CD13 in green (i,j). (k,l) Histograms for the radius of mIgG-positive intracellular vesicles (k) and normalized mIgG intensity per vesicle (l) in semi-logarithmic scale. Points show the mean value ± SEM of each size or intensity bin for 30 microvessels from 3 different C57BL/6 mice. The continuous line shows a log-normal fit of the experimental data. In all images, DAPI-stained nuclei are shown in blue.
Figure 2
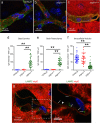
Figure 2. Endogenous mIgG localizes to lysosomes in BECs.
(a,b) Representative 3D reconstruction of the intracellular distribution of the Brain Shuttle sFab (a) or dFab (b) (both in green) and endogenous mIgG (red) within a single brain microvessel. The right panels show high magnification image of the boxed area. Arrows highlight the minimal overlap between mIgG and BS-sFab vesicles in (a) and extensive colocalization between mIgG and BS-dFab in (b). Asterisks show Brain Shuttle-positive vesicles overlapping with faint mIgG vesicles. (c) Representative 3D reconstruction of the intracellular distribution of LAMP2-positive lysosomes (green) and endogenous mIgG (red) within a single brain microvessel. The right panel shows a high magnification image of the boxed area and highlights the colocalization between mIgG and LAMP2-positive lysosomes. In all images, DAPI-stained nuclei are shown in blue. (d) Colocalization of mIgG to LAMP2 expressed as the fraction of the total vesicular mIgG intensity colocalized with LAMP2 vesicles. Points show measurements from individual microvessels. Each symbol corresponds to a different animal. Lines show the mean ± SD for 33 microvessels from 3 different animals.
Figure 3
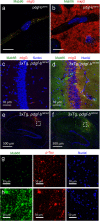
Figure 3. Relocalization of intracellular mIgG to the abluminal membrane in pericyte-deficient mice.
(a–c) Representative maximum projection images of brain microvessels (marked by CollagenIV in green) showing the localization of mIgG (red) in C57BL/6 (a) pdgf-bret/wt (b) and pdgf-bret/ret (c) mice. DAPI-stained nuclei are shown in blue. (d–f) Graphs showing the quantification of mIgG intensity per μm2 of basal lamina (d) mIgG intensity per μm3 of brain parenchyma (e) and number of vesicles per μm3 of microvessel volume (f) in C57BL/6 (blue), pdgf-bret/wt (red), and pdgf-bret/ret mice (green). Points show measurements from individual microvessels. Each symbol corresponds to a different animal. Lines show the mean ± SD for 30 microvessels from 3 different animals for each phenotype. **p < 0.0001 by Fisher’s LSD test. (g) Representative maximum projection of a brain microvessel in pdgf-bret/ret mice showing the localization of mIgG (red) and lysosomes marked by LAMP2 (green). The right panel shows a high magnification of a single optical slice image of the boxed area and highlights the reduced colocalization between LAMP2 and mIgG. Individual mIgG and LAMP2 vesicles are marked with arrowheads and arrows, respectively.
Figure 4
Figure 4. Increase of intracellular and abluminal vesicles in pericyte-deficient mice.
(a) Scheme representing the different vesicle populations identified by TEM in BECs. (b–d) representative TEM cross-sections of brain microvessels in pdgf-bret/wt (left panel), and pdgf-bret/ret mice (right panel) showing coated and non-coated luminal vesicles (b) intracellular vesicles and tubules (c) and abluminal vesicles (d). (e–g) Graphs showing the quantification of the number of vesicles per capillary identified by TEM in pdgf-bret/wt (red), and pdgf-bret/ret mice (green). Points show measurements from individual microvessels. Each symbol corresponds to a different animal. Columns represent the median and error bars the interquartile range for at least 18 microvessels from at least 3 different animals per phenotype. **p < 0.005 by Mann-Whitney U test.
Figure 5
Figure 5. Pericyte depletion results in increased target engagement of an antibody against phosphotau.
(a,b) Representative maximum intensity projections of microcapillaries comparing the intracellular distribution of Mab86 (green) after acute injection and endogenous mIgG (red) in pdgf-bret/wt (a), and pdgf-bret/ret (b) mice. (c,d) High-resolution images of neurons on the hippocampus of 3Tg x pdgf-bret/wt (c) or 3Tg x pdgf-bret/ret (d) mice. In all images, DAPI-stained nuclei are shown in blue. (e,f) Representative low-magnification images of the hippocampus of 3Tg x pdgf-bret/wt (e) or 3Tg x pdgf-bret/ret (f) mice showing phosphotau positive neurons (red) and Mab86 (green). (g,h) High magnification images of the boxed area in 3Tg x pdgf-bret/wt (g) or 3Tg x pdgf-bret/ret (h) mice highlighting the accumulation of Mab86 in phosphotau positive neurons in 3Tg x pdgf-bret/ret mice.

Similar articles

Cited by

References

    1. Wu A. M. & Senter P. D. Arming antibodies: prospects and challenges for immunoconjugates, Nat Biotechnol 23, 1137–1146, 10.1038/nbt1141 (2005). - DOI - PubMed
    1. Adams G. P. & Weiner L. M. Monoclonal antibody therapy of cancer, Nat Biotechnol 23, 1147–1157, 10.1038/nbt1137 (2005). - DOI - PubMed
    1. Pardridge W. M. Drug transport across the blood-brain barrier, J Cereb Blood Flow Metab 32, 1959–1972, 10.1038/jcbfm.2012.126 (2012). - DOI - PMC - PubMed
    1. St-Amour I. et al. Brain bioavailability of human intravenous immunoglobulin and its transport through the murine blood-brain barrier, J Cereb Blood Flow Metab 33, 1983–1992, 10.1038/jcbfm.2013.160 (2013). - DOI - PMC - PubMed
    1. Rubin L. L. & Staddon J. M. The cell biology of the blood-brain barrier, Annu Rev Neurosci 22, 11–28, 10.1146/annurev.neuro.22.1.11 (1999). - DOI - PubMed

Publication types