

Human norovirus hyper-mutation revealed by ultra-deep sequencing
- PMID: 27094861
- PMCID: PMC7172324
- DOI: 10.1016/j.meegid.2016.04.017
Human norovirus hyper-mutation revealed by ultra-deep sequencing
Abstract
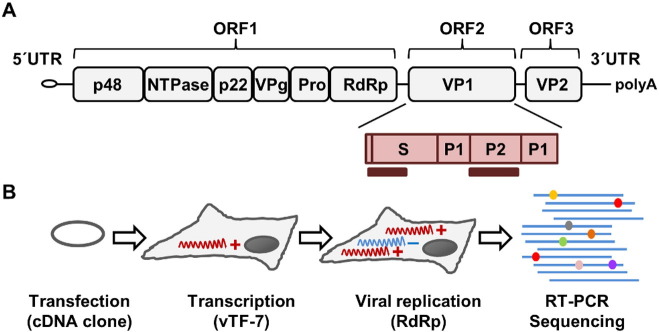
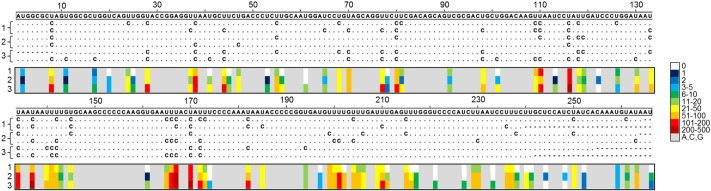
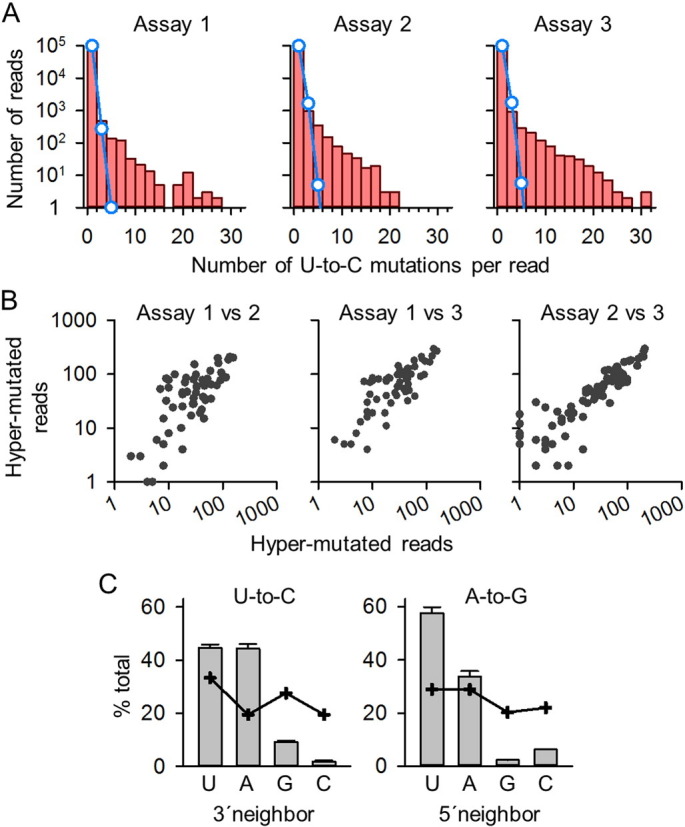
Human noroviruses (NoVs) are a major cause of gastroenteritis worldwide. It is thought that, similar to other RNA viruses, high mutation rates allow NoVs to evolve fast and to undergo rapid immune escape at the population level. However, the rate and spectrum of spontaneous mutations of human NoVs have not been quantified previously. Here, we analyzed the intra-patient diversity of the NoV capsid by carrying out RT-PCR and ultra-deep sequencing with 100,000-fold coverage of 16 stool samples from symptomatic patients. This revealed the presence of low-frequency sequences carrying large numbers of U-to-C or A-to-G base transitions, suggesting a role for hyper-mutation in NoV diversity. To more directly test for hyper-mutation, we performed transfection assays in which the production of mutations was restricted to a single cell infection cycle. This confirmed the presence of sequences with multiple U-to-C/A-to-G transitions, and suggested that hyper-mutation contributed a large fraction of the total NoV spontaneous mutation rate. The type of changes produced and their sequence context are compatible with ADAR-mediated editing of the viral RNA.
Keywords: Hyper-mutation; Next-generation sequencing; Norovirus; RNA virus.
Copyright © 2016 Elsevier B.V. All rights reserved.
Figures
Similar articles
-
A next generation sequencing-based method to study the intra-host genetic diversity of norovirus in patients with acute and chronic infection.BMC Genomics. 2016 Jul 1;17:480. doi: 10.1186/s12864-016-2831-y. BMC Genomics. 2016. PMID: 27363999 Free PMC article.
-
Quantitative and molecular analysis of noroviruses RNA in blood from children hospitalized for acute gastroenteritis in Belém, Brazil.J Clin Virol. 2013 Sep;58(1):31-5. doi: 10.1016/j.jcv.2013.06.043. Epub 2013 Jul 22. J Clin Virol. 2013. PMID: 23886502
-
Detection of human norovirus GIV.1 in China: a case report.J Clin Virol. 2014 Oct;61(2):298-301. doi: 10.1016/j.jcv.2014.08.002. Epub 2014 Aug 11. J Clin Virol. 2014. PMID: 25151627
-
Burden of acute gastroenteritis caused by norovirus in China: A systematic review.J Infect. 2017 Sep;75(3):216-224. doi: 10.1016/j.jinf.2017.06.004. Epub 2017 Jun 17. J Infect. 2017. PMID: 28633888 Review.
-
[Norovirus infections: an overview].Med Sci (Paris). 2010 Jan;26(1):73-8. doi: 10.1051/medsci/201026173. Med Sci (Paris). 2010. PMID: 20132778 Review. French.
Cited by
-
Novel and emerging mutations of SARS-CoV-2: Biomedical implications.Biomed Pharmacother. 2021 Jul;139:111599. doi: 10.1016/j.biopha.2021.111599. Epub 2021 Apr 23. Biomed Pharmacother. 2021. PMID: 33915502 Free PMC article. Review.
-
An unusual diarrheal outbreak in the community in Eastern Thailand caused by Norovirus GII.3[P25].Virol J. 2024 Jan 19;21(1):21. doi: 10.1186/s12985-024-02296-z. Virol J. 2024. PMID: 38243289 Free PMC article.
-
A comprehensive study on cellular RNA editing activity in response to infections with different subtypes of influenza a viruses.BMC Genomics. 2018 Jan 19;19(Suppl 1):925. doi: 10.1186/s12864-017-4330-1. BMC Genomics. 2018. PMID: 29363430 Free PMC article.
-
ADAR Editing in Viruses: An Evolutionary Force to Reckon with.Genome Biol Evol. 2021 Nov 5;13(11):evab240. doi: 10.1093/gbe/evab240. Genome Biol Evol. 2021. PMID: 34694399 Free PMC article. Review.
-
Transmission routes of rare seasonal diseases: the case of norovirus infections.Philos Trans R Soc Lond B Biol Sci. 2019 Jul 8;374(1776):20180267. doi: 10.1098/rstb.2018.0267. Philos Trans R Soc Lond B Biol Sci. 2019. PMID: 31104607 Free PMC article.
References
-
- Bodhidatta L., Abente E., Neesanant P., Nakjarung K., Sirichote P., Bunyarakyothin G., Vithayasai N., Mason C.J. Molecular epidemiology and genotype distribution of noroviruses in children in Thailand from 2004 to 2010: a multi-site study. J. Med. Virol. 2015;87:664–674. - PubMed
-
- Bull R.A., White P.A. Mechanisms of GII.4 norovirus evolution. Trends Microbiol. 2011;19:233–240. - PubMed
-
- Carlsson B., Lindberg A.M., Rodriguez-Diaz J., Hedlund K.O., Persson B., Svensson L. Quasispecies dynamics and molecular evolution of human norovirus capsid P region during chronic infection. J. Gen. Virol. 2009;90:432–441. - PubMed
Publication types
MeSH terms
Substances
LinkOut - more resources
Full Text Sources
Other Literature Sources
Medical
