. 2016 Apr 6;8(333):333ra50.
doi: 10.1126/scitranslmed.aad6100.

Cyclodextrin promotes atherosclerosis regression via macrophage reprogramming

Affiliations

Cyclodextrin promotes atherosclerosis regression via macrophage reprogramming

Sebastian Zimmer et al. Sci Transl Med. .

Abstract

Atherosclerosis is an inflammatory disease linked to elevated blood cholesterol concentrations. Despite ongoing advances in the prevention and treatment of atherosclerosis, cardiovascular disease remains the leading cause of death worldwide. Continuous retention of apolipoprotein B-containing lipoproteins in the subendothelial space causes a local overabundance of free cholesterol. Because cholesterol accumulation and deposition of cholesterol crystals (CCs) trigger a complex inflammatory response, we tested the efficacy of the cyclic oligosaccharide 2-hydroxypropyl-β-cyclodextrin (CD), a compound that increases cholesterol solubility in preventing and reversing atherosclerosis. We showed that CD treatment of murine atherosclerosis reduced atherosclerotic plaque size and CC load and promoted plaque regression even with a continued cholesterol-rich diet. Mechanistically, CD increased oxysterol production in both macrophages and human atherosclerotic plaques and promoted liver X receptor (LXR)-mediated transcriptional reprogramming to improve cholesterol efflux and exert anti-inflammatory effects. In vivo, this CD-mediated LXR agonism was required for the antiatherosclerotic and anti-inflammatory effects of CD as well as for augmented reverse cholesterol transport. Because CD treatment in humans is safe and CD beneficially affects key mechanisms of atherogenesis, it may therefore be used clinically to prevent or treat human atherosclerosis.


Conflict of interest statement

Competing interests: No relevant competing interests.

Figures

Fig. 1
Fig. 1. CD treatment impairs murine atherogenesis
ApoE−/− mice were fed a cholesterol-rich diet for eight weeks and concomitantly treated with 2 g CD/ kg body weight or vehicle control by subcutaneous injection twice a week (n=7–8 per group). (A) Plasma cholesterol levels. (B) Atherosclerotic plaque area relative to total arterial wall area. (C) Plaque CC load shown as ratio of crystal reflection area to plaque area. (D) Representative images of the aortic plaques obtained by confocal laser reflection microscopy. Macrophages stained with anti-CD68 antibodies (red), reflection signal of CCs (white), nuclei stained with Hoechst (blue). Enlarged area (white boxes). Scale bars indicate 500 μm. (E) Plaque cellularity shown as ratio of nuclei to plaque area. (F) Plaque macrophage load shown as ratio of CD68 fluorescence area to total plaque area. (G) Aortic superoxide production determined by L-012 chemiluminescence. Plasma (H) IL-1β, (I) TNF-α and (J) IL-6 levels. Data are shown as mean + s.e.m., Control vs. CD, unpaired two-tailed Student’s t test; ***p < 0.001, **p < 0.01, *p < 0.05, ns = not significant.
Fig. 2
Fig. 2. CD treatment facilitates regression of murine atherosclerosis
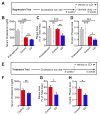
ApoE−/− mice were fed a cholesterol-rich diet for eight weeks to induce advanced atherosclerotic lesions. Then the diet was either changed to a normal chow (AD) or the cholesterol-rich diet was continued (EH) for another four weeks. Mice were simultaneously treated with 2 g CD/ kg body weight or vehicle control twice a week (n=6–8 per group). (B, F) Plasma cholesterol levels. (C, G) Atherosclerotic plaque area relative to total arterial wall area. (D, H) Plaque CC load shown as ratio of crystal reflection area to plaque area. Data are shown as mean + s.e.m., Control vs. CD, unpaired two-tailed Student’s t test; ***p < 0.001, **p < 0.01, *p < 0.05, ns = not significant.
Fig. 3
Fig. 3. CD interacts with and dissolves extra- and intracellular CCs
(A, B) 1 mg CCs were incubated in 0.5 mM rhodamine labeled CD or PBS as control. (A) Representative images obtained by confocal laser reflection microscopy. Scale bar equals 20 μm. (B) Quantification of rhodamine fluorescence on CCs by flow cytometry. (C) 3H-CC were incubated in CD solutions of indicated concentrations overnight shaking at 37°C. Upon filtration through 0.22 μm filter plates radioactivity was determined in the filtrate (filterable/solubilized) and the retentate (crystalline). (D, E) iMacs loaded with 200 μg CC/1×106 cells for 3 h prior to incubation with 1 mM rhodamine labeled CD. (D) Quantification of rhodamine fluorescence by flow cytometry. (E) Representative images obtained by confocal microscopy; rhodamine labeled CD (red), laser reflection signal (green). Scale bars equal 5 μm. (F) Intracellular CC dissolution in BMDMs treated with 10 mM CD or control for indicated times determined by polarization microscopy. Data are shown as mean +/− s.e.m of at least three independent experiments.
Fig. 4
Fig. 4. CD mediates metabolism and efflux of crystal-derived cholesterol
(A) Macrophages loaded with CCs prepared from D6-cholesterol (D6-CC) can reduce the amount of free, crystal-derived D6-cholesterol by three main mechanisms: First, acetyl-CoA acetyltransferase (ACAT1) can catalyze the formation of D6-cholesteryl esters, the storage form of cholesterol which is deposited in lipid droplets. Second, the mitochondrial enzyme 27-hydroxylase (Cyp27A1) can catalyze the formation of D5-27-hydroxycholesterol, which can passively diffuse across cell membranes. Third, D5-27-hydroxycholesterol is a potent activator of LXR transcription factors, which in turn mediate the up-regulation of the cholesterol efflux transporters ABCA1 and ABCG1. (B, C) iMacs loaded with 200 μg D6-CC/1×106 cells for 3 h were treated with 10 mM CD or vehicle control prior to GC-MS-SIM analysis of crystal-derived cholesterol. (B) Percentage of esterified D6-cholesterol in cell and supernatant fractions before CD treatment (control bar) and upon 48 h CD treatment. (C) Efflux of D6-cholesterol into supernatants of D6-CC-loaded macrophages before CD treatment (control bar) and upon 24 h CD treatment. Gene expression of (D) Abca1 and (E) Abcg1, and (F) protein expression of ABCA1 in BMDMs loaded with 100 μg CC/1×106 cells for 3 h followed by incubation with 10 mM CD or medium control for (D, E) 4 h or (F) 24 h. Immunoblot in (F) is representative of three independent experiments and densitometric analysis of all three experiments is provided for 10 mM CD and presented as ABCA1 expression relative to the loading control β-ACTIN. Data are shown as means + s.e.m. of at least three independent experiments. (G) D5-27-hydroxycholesterol in cell and supernatant fractions of iMacs loaded with 200 μg D6-CC/1×106 cells for 3 h prior to 48 h treatment with 10 mM CD or medium control determined by GC-MS-SIM. (H) 27-hydroxycholesterol in cell and supernatant fractions of iMacs upon 48 h treatment with 10 mM CD or medium control. (B, C) Medium vs. CD, unpaired two-tailed Student’s t test; (DF) CC+Control vs. CC+CD, unpaired two-tailed Student’s t test; (G, H) Control vs. CD, unpaired two-tailed Student’s t test; ***p < 0.001, *p < 0.05, ns = not significant.
Fig. 5
Fig. 5. CD induces LXR target gene expression in WT macrophages
(A) BMDMs from WT and LXRα−/−β−/− mice loaded with 100 μg CC/1×106 cells for 3 h and incubated with 10 mM CD for 4 h for microarray analysis. GSEA for LXR target gene sets described in Heinz et al. (30) (Table S1) was performed on gene expression data. (B, C) GSEA results for (B) WT and (C) LXRα−/−β−/− BMDMs presented as volcano plots of normalized enrichment score (NES) and enrichment p-values. Red circles show positively and significantly enriched gene sets (NES>1, p-value<0.05). (DF) Gene expression of (D) Abca1 and (E) Abcg1, and (F) protein expression of ABCA1 in BMDMs from WT and LXRα−/−β−/− mice loaded with 100 μg CC/1×106 cells for 3h followed by incubation with 10 mM CD for (D, E) 4 h or (F) 24 h. The synthetic LXR agonist T0901317 (10 μM) was used as a positive control for ABCA1 protein induction. Immunoblot in (F) is representative of two independent experiments. Data are shown as mean + s.e.m. of two independent experiments. CC+Control vs. CC+CD, unpaired two-tailed Student’s t test; *p < 0.05.
Fig. 6
Fig. 6. CD facilitates RCT in vivo and promotes urinary cholesterol excretion
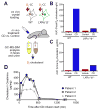
(A) BMDMs from WT or LXRα−/−β−/− mice were loaded with 100 μg D6-CC/1×106 cells and injected into the peritoneum of WT mice. Subsequently, mice were treated subcutaneously with 2 g CD/ kg body weight or vehicle control (n=4 per group). D6-cholesterol content in (B) feces and (C) urine collected every 3 h over 30 h post CD injection. Data is shown as total area under the curve of excreted D6-cholesterol pooled from the mice within a group per time point. (D) Urine samples collected from three individual NPC1 patients upon intravenous application of CD for specific treatment of NPC. Urine cholesterol concentration was determined by GC-MS-SIM and normalized to urine creatinine excretion.
Fig. 7
Fig. 7. CD induces cholesterol metabolism and an anti-inflammatory LXR profile in human atherosclerotic carotid plaques
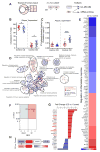
(A) Human atherosclerotic carotid plaques obtained by carotid endarterectomies (n=10) were split into two macroscopically equal pieces and cultured for 24 h with 10 mM CD or control. Half of the plaque tissue was used for mRNA profiling with nCounter analysis system (Nanostring technologies), the other half and the culture supernatant were analyzed by GC-MS-SIM. (B) Cholesterol efflux from plaque tissue into supernatants displayed as % of total cholesterol per sample. (C) Distribution of 27-hydroxycholesterol relative to cholesterol in plaque and supernatant. (D) GOEA of differentially expressed (DE) genes (FC>1.3, p-value<0.05) visualized as GO network, where red nodes indicate GO term enrichment by up-regulated DE genes and blue borders indicate GO term enrichment by downregulated DE genes. Node size and border width represent the corresponding FDR-adjusted enrichment p value (q value). Edges represent the associations between two enriched GO terms based on shared genes, where edge thickness indicates the overlap of genes between neighbor nodes. Highly connected terms were grouped together and were annotated manually by a shared general term. (E) Heat map of genes involved in the GO term “Regulation of inflammatory response” (GO:0050727). Color bar indicates fold change. (F) Volcano plot of NES and enrichment p-values based on GSEA for the LXR target gene set (Table S3). Red circle indicates positively and significantly enrichment of the LXR target gene set (NES>1, p-value<0.05). (G) Top DE genes determined by 3-way ANOVA (FC>1.5, p-value<0.05). LXR target genes are colored in red or blue. (H) Gene expression of genes relevant for the NLRP3 inflammasome pathway. Color bar indicates fold change. (B, C) Data are shown as mean +/− s.e.m. CD vs. Control, paired two-tailed Student’s t test; ***p < 0.001, *p < 0.05.
Fig. 8
Fig. 8. CD impairs atherogenesis and regulates metabolic and anti-inflammatory processes in an LXR-dependent manner
LDLR−/− mice were transplanted with WT, LXRα−/−β−/− or MAC-ABCDKO bone marrow. They were then fed a cholesterol-rich diet for eight weeks and concomitantly treated with 2g CD/ kg body weight or vehicle control twice a week (n=6–8 per group). (AC) Plasma cholesterol levels of CD- and vehicle-treated animals. (DF) Atherosclerotic plaque area relative to total arterial wall area. (GI) Descending aortas of LDLR−/− mice transplanted with WT and LXRα−/−β−/− were used for gene expression analysis by microarray, with subsequent filtration for the genes included in the human plaque mRNA profiling. (G) GOEA of differentially expressed (DE) genes (FC>1.3, p-value<0.05) visualized as GO network, where red nodes indicate GO term enrichment by up-regulated DE genes and blue borders indicate GO term enrichment by downregulated DE genes. Node size and border width represent the corresponding FDR-adjusted enrichment p value (q value). Edges represent the associations between two enriched GO terms based on shared genes, where edge thickness indicates the overlap of genes between neighbor nodes. Highly connected terms were grouped together and were annotated manually by a shared general term. (H) DE genes determined by 3-way ANOVA (FC>1.3, p-value<0.05) in aortas of LDLR−/− mice transplanted with WT bone marrow. LXR target genes are colored in red or blue. (I) Gene expression of genes relevant for the NLRP3 inflammasome pathway. Color bar indicates fold change. (A, B) Data are shown as mean + s.e.m., CD vs. Control, unpaired two-tailed Student’s t test; **p < 0.01, *p < 0.05.

Comment in

Similar articles

Cited by

References

    1. Robinson JG, Farnier M, Krempf M, Bergeron J, Luc G, Averna M, Stroes ES, Langslet G, Raal FJ, Shahawy ME, Koren MJ, Lepor NE, Lorenzato C, Pordy R, Chaudhari U, Kastelein JJP. ODYSSEY LONG TERM Investigators, Efficacy and Safety of Alirocumab in Reducing Lipids and Cardiovascular Events. N Engl J Med. 2015 doi: 10.1056/NEJMoa1501031. - DOI - PubMed
    1. Sabatine MS, Giugliano RP, Wiviott SD, Raal FJ, Blom DJ, Robinson J, Ballantyne CM, Somaratne R, Legg J, Wasserman SM, Scott R, Koren MJ, Stein EA. Open-Label Study of Long-Term Evaluation against LDL Cholesterol (OSLER) Investigators, Efficacy and Safety of Evolocumab in Reducing Lipids and Cardiovascular Events. N Engl J Med. 2015 150315080057008. - PubMed
    1. Task Force Members, ESC Committee for Practice Guidelines (CPG) Montalescot G, Sechtem U, Achenbach S, Andreotti F, Arden C, Budaj A, Bugiardini R, Crea F, Cuisset T, Di Mario C, Ferreira JR, Gersh BJ, Gitt K, Hulot JS, Marx N, Opie LH, Pfisterer M, Prescott E, Ruschitzka F, Sabate M, Senior R, Taggart DP, van der Wall EE, Vrints CJM, Zamorano JL, Baumgartner H, Bax JJ, Bueno H, Dean V, Deaton C, Erol C, Fagard R, Ferrari R, Hasdai D, Hoes AW, Kirchhof P, Knuuti J, Kolh P, Lancellotti P, Linhart A, Nihoyannopoulos P, Piepoli MF, Ponikowski P, Sirnes PA, Tamargo JL, Tendera M, Torbicki A, Wijns W, Windecker S, Valgimigli M, Bueno H, Claeys MJ, Donner-Banzhoff N, Erol C, Frank H, Funck-Brentano C, Gaemperli O, Gonzalez-Juanatey JR, Hamilos M, Husted S, James SK, Kervinen K, Kristensen SD, Maggioni AP, Piepoli MF, Pries AR, Romeo F, Ryden L, Simoons ML, Steg PG, Timmis A, Yildirir A. 2013 ESC guidelines on the management of stable coronary artery disease: The Task Force on the management of stable coronary artery disease of the European Society of Cardiology. Eur Heart J. 2013;34:2949–3003. Document Reviewers. - PubMed
    1. Sheedy FJ, Grebe A, Rayner KJ, Kalantari P, Ramkhelawon B, Carpenter SB, Becker CE, Ediriweera HN, Mullick AE, Golenbock DT, Stuart LM, Latz E, Fitzgerald KA, Moore KJ. CD36 coordinates NLRP3 inflammasome activation by facilitating intracellular nucleation of soluble ligands into particulate ligands in sterile inflammation. Nat Immunol. 2013;14:812–820. - PMC - PubMed
    1. Duewell P, Kono H, Rayner KJ, Sirois CM, Vladimer G, Bauernfeind FG, Abela GS, Franchi L, Nuñez G, Schnurr M, Espevik T, Lien E, Fitzgerald KA, Rock KL, Moore KJ, Wright SD, Hornung V, Latz E. NLRP3 inflammasomes are required for atherogenesis and activated by cholesterol crystals. Nature. 2010;464:1357–1361. - PMC - PubMed

Publication types

MeSH terms