. 2016 May;23(5):434-40.
doi: 10.1038/nsmb.3202. Epub 2016 Apr 4.

SIRT6 deacetylates H3K18ac at pericentric chromatin to prevent mitotic errors and cellular senescence

Affiliations

SIRT6 deacetylates H3K18ac at pericentric chromatin to prevent mitotic errors and cellular senescence

Luisa Tasselli et al. Nat Struct Mol Biol. 2016 May.

Abstract

Pericentric heterochromatin silencing at mammalian centromeres is essential for mitotic fidelity and genomic stability. Defective pericentric silencing has been observed in senescent cells, aging tissues, and mammalian tumors, but the underlying mechanisms and functional consequences of these defects are unclear. Here, we uncover an essential role of the human SIRT6 enzyme in pericentric transcriptional silencing, and we show that this function protects against mitotic defects, genomic instability, and cellular senescence. At pericentric heterochromatin, SIRT6 promotes deacetylation of a new substrate, residue K18 of histone H3 (H3K18), and inactivation of SIRT6 in cells leads to H3K18 hyperacetylation and aberrant accumulation of pericentric transcripts. Strikingly, depletion of these transcripts through RNA interference rescues the mitotic and senescence phenotypes of SIRT6-deficient cells. Together, our findings reveal a new function for SIRT6 and regulation of acetylated H3K18 at heterochromatin, and demonstrate the pathogenic role of deregulated pericentric transcription in aging- and cancer-related cellular dysfunction.


Figures

Figure 1
Figure 1. H3K18Ac is a physiologic SIRT6 substrate
(a) Mass spectra peak profile of H3K18Ac peptide after in vitro deacetylation assays with SIRT6 enzyme or in control reaction lacking enzyme. Molecular masses of acetylated and deacetylated peptides (arrows) are 2,650 and 2,608 daltons, respectively. (b) Western analysis showing H3K18Ac levels on nucleosomes after in vitro deacetylation assay. Reactions with or without NAD+, control GST, wild-type (WT) GST-SIRT6, (GST-SIRT6 WT) or mutant GST-SIRT6 H133Y (GST-SIRT6 HY) proteins are indicated. Similar results were obtained in 4 independent experiments. (c) Western analysis showing H3K18Ac and H3K9Ac levels in 293T and U2OS cells overexpressing SIRT6 WT, SIRT6 HY, or control empty vector. Actin and total H3 levels are shown as controls. (d) Western analysis showing H3K18Ac, H3K9Ac, and H3K56Ac levels in SIRT6 knockout (KO) MEFs compared to WT littermate control MEFs. (e) Western analysis showing H3K18Ac levels in SIRT6 KO MEFs reconstituted with WT murine SIRT6 protein (SIRT6 WT), or a catalytically inactive H133A mutant (SIRT6 HA). Uncropped gel images are shown in Supplementary Data Set 1.
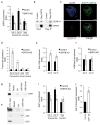
Figure 2
Figure 2. SIRT6 selectively regulates H3K18 deacetylation at pericentric chromatin
(a) H3K18Ac ChIP-seq analysis at pericentric and sub-telomeric heterochromatin. Genome-wide peak profiles (left) and relative box-and-whisker plots (right) show average H3K18Ac occupancy in SIRT6 knockdown (SIRT6 KD1) or control cells (Co), within 100Kb windows from centromeric gaps (Pericentric), or telomere gaps (Sub-telomeric). For box-and-whisker plots: center line is the medium value (middle quartile); top and bottom of box represent upper and lower quartile, respectively; top of upper whisker and bottom of lower whisker represent maximum and minimum, respectively (two-tailed Student’s t-test, n=500 for pericentric and n=51 for sub-telomeric regions). (b) Western blot showing SIRT6 levels in U2OS cells upon lentiviral transduction of two independent SIRT6 shRNAs (SIRT6 KD1, SIRT6 KD2). Uncropped gel images are shown in Supplementary Data Set 1. (c) UCSC Genome Browser screen shots showing H3K18Ac ChIP-seq levels at representative pericentric and sub-telomeric regions of Chr4, in control and SIRT6 KD1 U2OS cells. y-axis is normalized read count. (d) ChIP-seq H3K18Ac levels at two pericentric consensus sequences (PCT cons1, PCT cons2) in SIRT6 KD1 and control cells. Telomeric sequences, β-actin, and histone H4 are shown as controls. Graph shows values of forward and reverse paired-end reads (r1 and r2). (e) ChIP-qPCR showing H3K18Ac enrichment in U2OS SIRT6 KD1 and KD2 cells at pericentric satellite Satellite II and III (Sat II, Sat III) repeats, or at control 5S ribosomal DNA (5SR) region (mean +/− s.e.m. of n=3 independent knock-down experiments). (f) ChIP-qPCR showing H3K18Ac enrichment in U2OS cells overexpressing SIRT6 WT, or SIRT6 HY catalytic mutant at pericentric repeats (mean +/− s.e.m. n=4 technical replicates). Similar results were observed in 2 independent cell cultures. *p<0.05; **p<0.01; ***p<0.001; when not indicated, p>0.05 (one-tailed Student’s t-test).
Figure 3
Figure 3. SIRT6-depletion disrupts pericentric chromatin silencing and leads to aberrant accumulation of satellite transcripts
(a) ChIP-qPCR showing SIRT6 occupancy at pericentric Satellite (Sat II, Sat III) repeats (mean +/− s.e.m. of n=3 technical replicates). Neg (Negative control intergenic region). Fold change represents % input of SIRT6 ChIPs normalized to values in SIRT6 knockdown cells (SIRT6 KD). (b) Anti-Flag immunoprecipitation (Flag IP) from nucleosome preparations from cells expressing Flag-SIRT6 or empty vector (Control). CENP-A westerns detect centromeric nucleosomes. (c) Representative confocal microscopy images of U2OS cells expressing EGFP-SIRT6, stained for CENP-A after in situ detergent extraction of nucleoplasmic protein. Bar, 5μm. (d) Pericentric Satellite, centromeric αSatellite (Cent, αSat), and control 5S Ribosomal RNA (5SR) transcript levels in U2OS SIRT6 KD cells, determined by qRT–PCR (mean +/− s.d. of n=3 technical replicates). (e) ChIP-qPCR for RNA-Pol II Ser2-phopsho (Pol II S2P) in U2OS cells (mean +/− s.e.m. of n=3 technical replicates). (f) ChIP-qPCR for H3K9me3 in U2OS cells (mean +/− s.e.m. of n=3 independent knockdown experiments). (g,h) Immunoblots of peptide pull-downs with (g) nuclear extracts or (h) recombinant proteins. The AF9 YEATS domain (which binds H3K18Ac) and GST protein are shown as controls. Peptides used encompass amino acids 10–27 of histone H3. Similar results were observed in 2 independent experiments. (i) ChIP-qPCR for KAP1 in control or SIRT6 knockout (SIRT6 KO) U2OS cells (mean +/− s.e.m. of n=3 technical replicates). (j) Pericentric Sat III transcript levels in KAP1-deficient (KAP1 KD) U2OS cells, determined by qRT–PCR (mean +/− s.e.m. of n=3 independent knockdown experiments). In (a), (d), (e), (f), (i) and (j): *p<0.05; **p<0.01; ***p<0.001; when not indicated, p>0.05 (one-tailed Student’s t-test). In (a-e) and (i), results are representative of 3 different experiments from independent cell cultures. Uncropped gel images are shown in Supplementary Data Set 1.
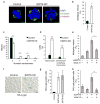
Figure 4
Figure 4. Aberrant accumulation of pericentric satellite transcripts in SIRT6-deficient cells causes mitotic defects and cellular senescence
(a) Representative confocal microscopy images showing multipolar mitoses in SIRT6-deficient U2OS cells compared to a bipolar normal mitosis in control cells. DNA was stained with DAPI (blue), spindle microtubules with α-tubulin (green), and centrosomes with γ-tubulin (magenta). Bar, 5 μm. (b, c) Quantification of multipolar mitoses (b) and centrosome numbers (c) in control or SIRT6 KD U2OS cells (mean +/− s.e.m. of n=3 independent knockdown experiments). (d) Quantification of U2OS cells with any micronuclei or centromere-positive micronuclei, stained as in Supplementary Fig. S4b (mean +/− s.e.m. of n=5 quantifications). (e) Quantification of multipolar mitoses in U2OS cells transiently transfected with siRNAs specific for SIRT6 (siSIRT6), Sat III transcripts (siSat III), and negative control siRNAs (–), as indicated (mean +/− s.e.m. of n=3 independent knockdown experiments). (f) Senescence-associated β-galactosidase (SA-β-gal) activity assay. Representative image of U2OS cells assayed one week after shSIRT6 or control transduction. Bar, 25 μm. (g) Quantification of SA-β-gal positive cells shown in (f) (mean +/− s.e.m. of n=5 quantifications). Experiment is representative of 3 independent knockdown experiments. (h) Quantification of SA-β-gal positive U2OS cells transfected as in (e) (mean +/− s.e.m. of n=5 quantifications). Representative images are shown in Supplementary Fig. S4d. Experiment is representative of 3 independent knockdown experiments. In all panels, *p<0.05; **p<0.01; ***p<0.001; and when not indicated, p>0.05 (two-tailed Student’s t-test).

Comment in

Similar articles

Cited by

References

    1. De Cecco M, et al. Genomes of replicatively senescent cells undergo global epigenetic changes leading to gene silencing and activation of transposable elements. Aging Cell. 2013 - PMC - PubMed
    1. De Cecco M, et al. Transposable elements become active and mobile in the genomes of aging mammalian somatic tissues. Aging (Albany NY) 2013;5:867–83. - PMC - PubMed
    1. Ting DT, et al. Aberrant overexpression of satellite repeats in pancreatic and other epithelial cancers. Science. 2011;331:593–6. - PMC - PubMed
    1. Shumaker DK, et al. Mutant nuclear lamin A leads to progressive alterations of epigenetic control in premature aging. Proc Natl Acad Sci U S A. 2006;103:8703–8. - PMC - PubMed
    1. Shah PP, et al. Lamin B1 depletion in senescent cells triggers large-scale changes in gene expression and the chromatin landscape. Genes Dev. 2013;27:1787–99. - PMC - PubMed

Publication types