. 2016 Apr 19;113(16):E2326-34.
doi: 10.1073/pnas.1602336113. Epub 2016 Mar 21.

Discovery of unfixed endogenous retrovirus insertions in diverse human populations

Affiliations

Discovery of unfixed endogenous retrovirus insertions in diverse human populations

Julia Halo Wildschutte et al. Proc Natl Acad Sci U S A. .

Abstract

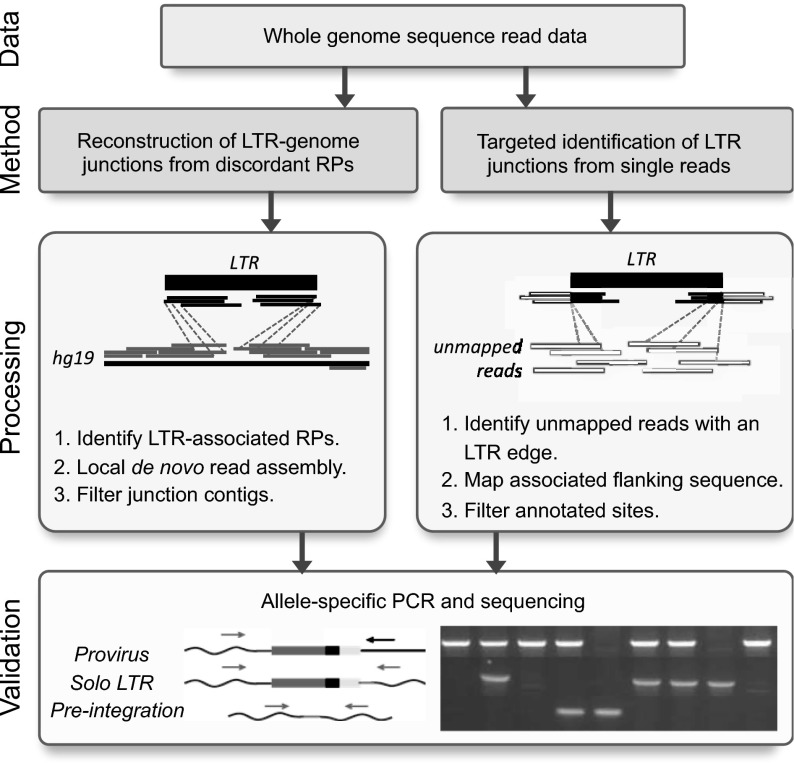
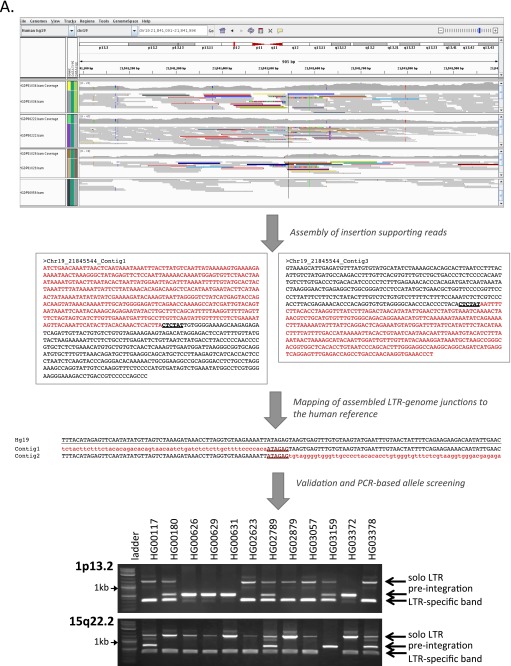
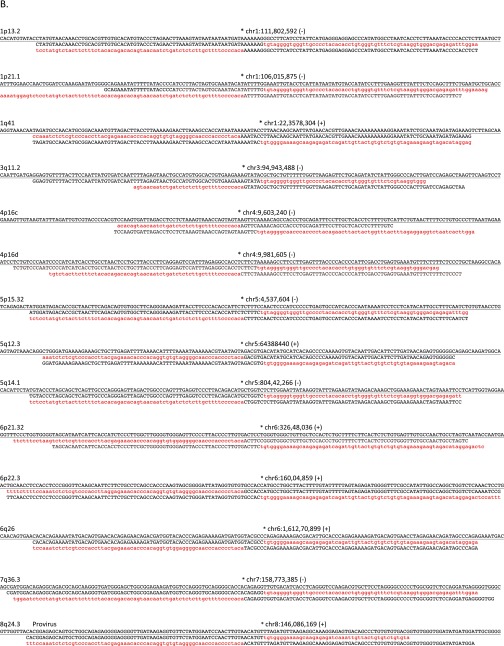
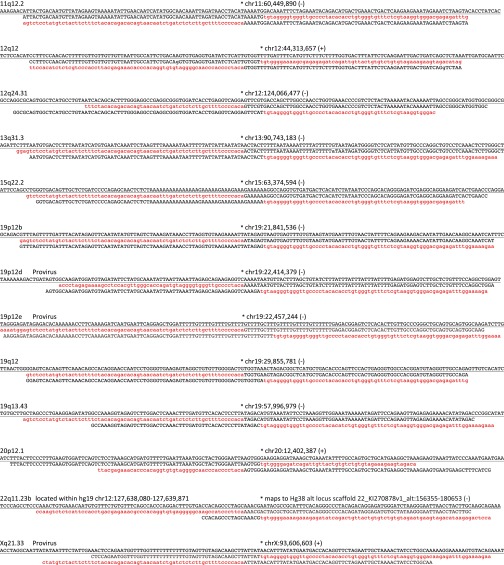
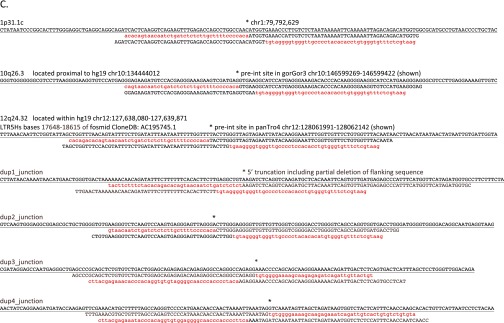
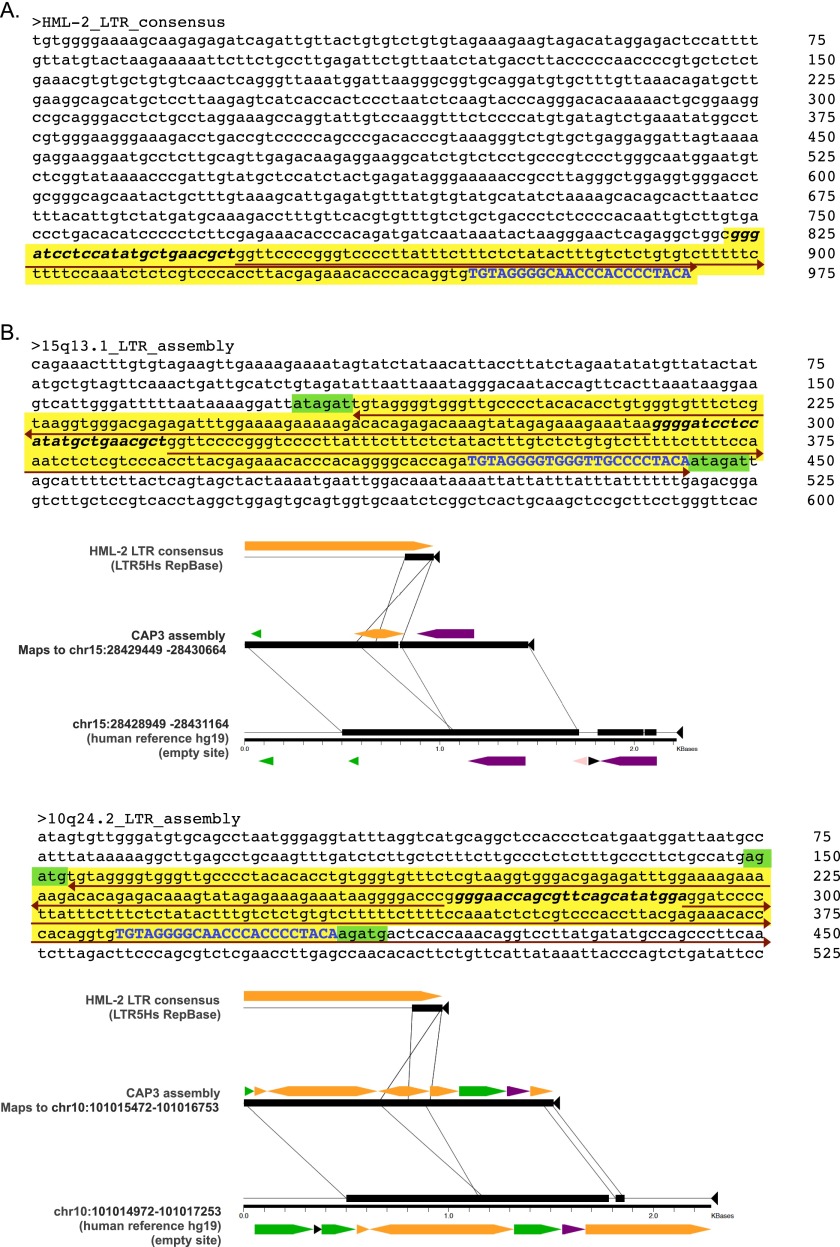
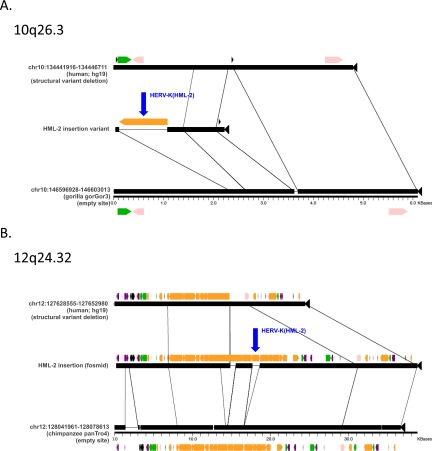
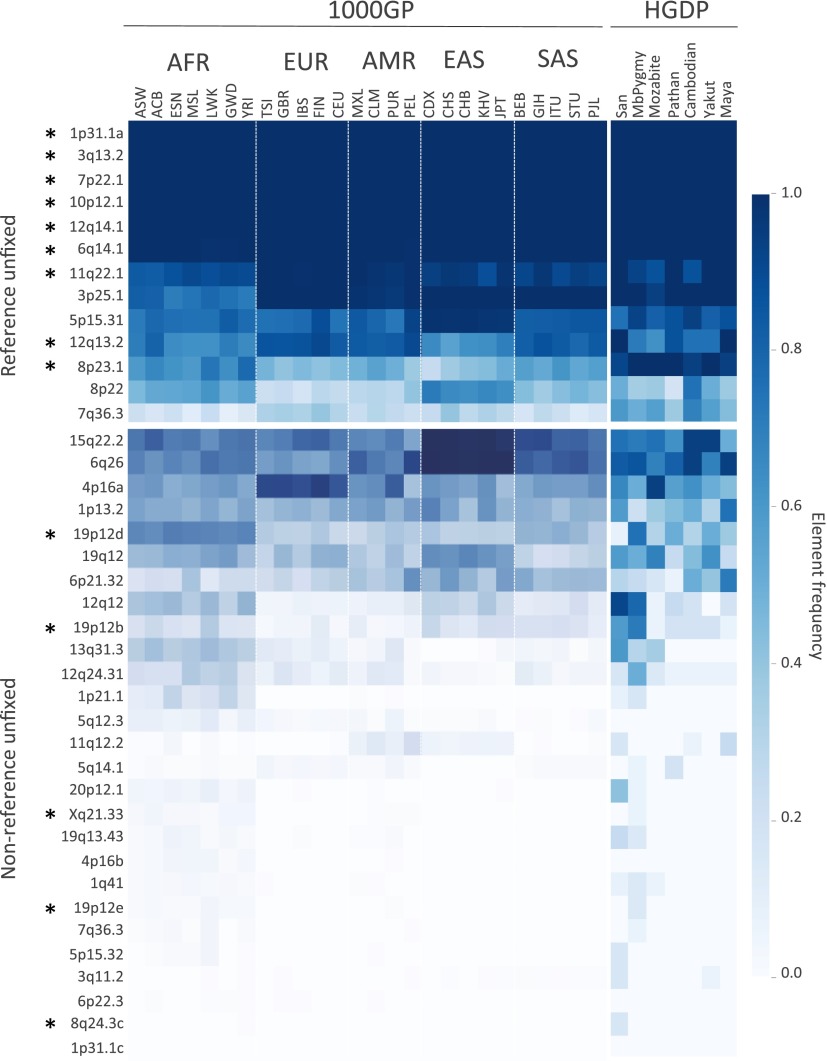
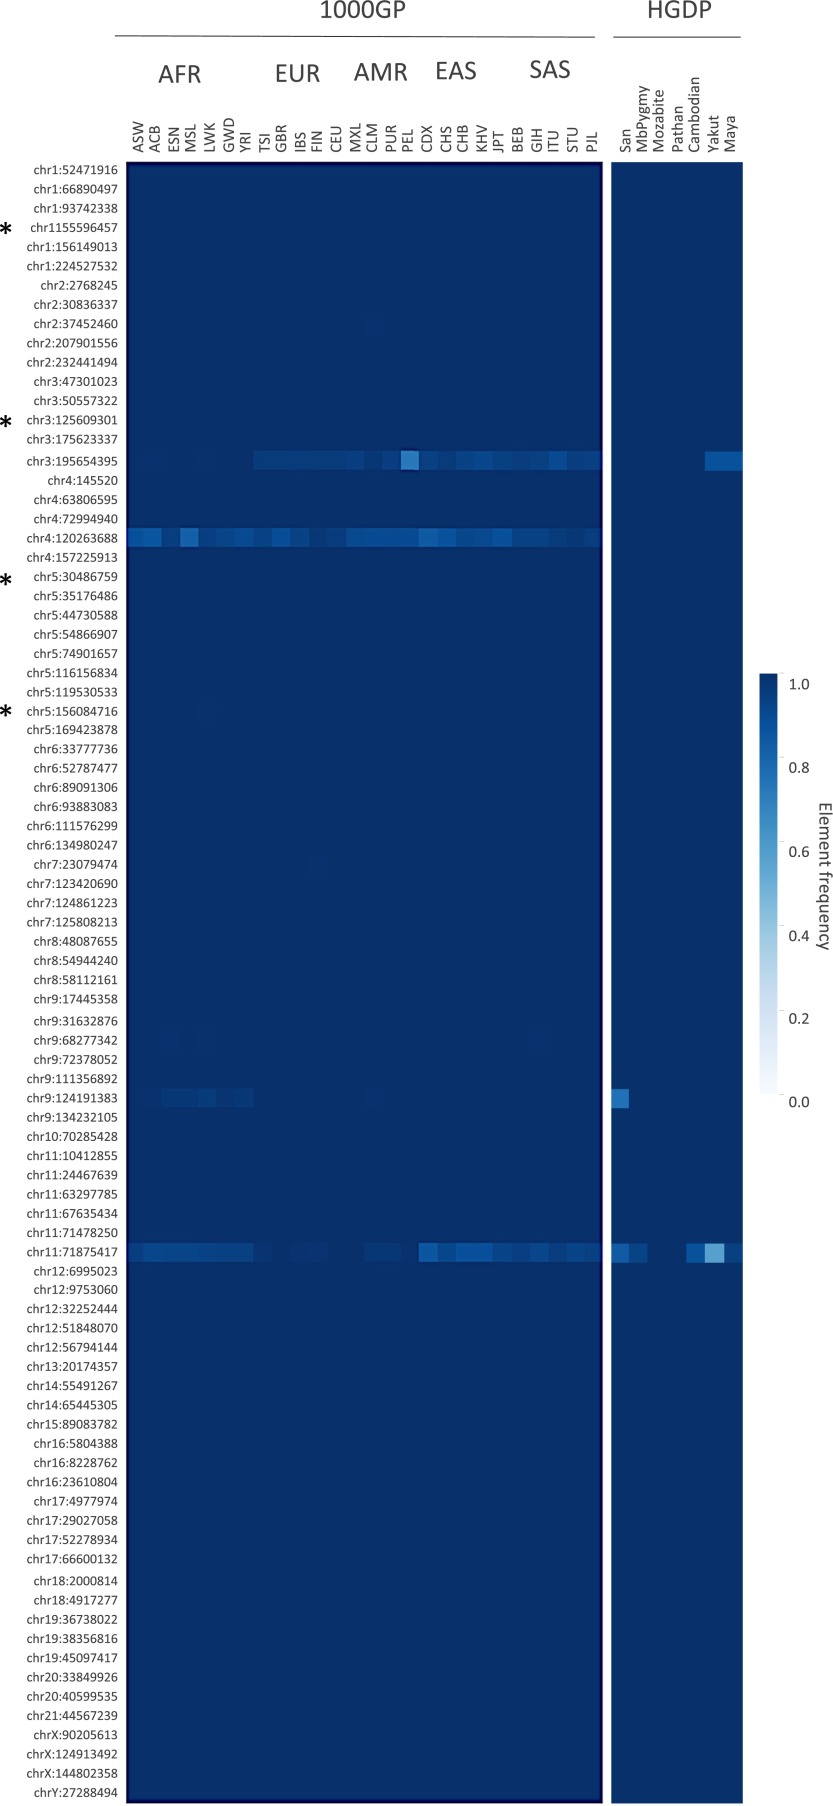
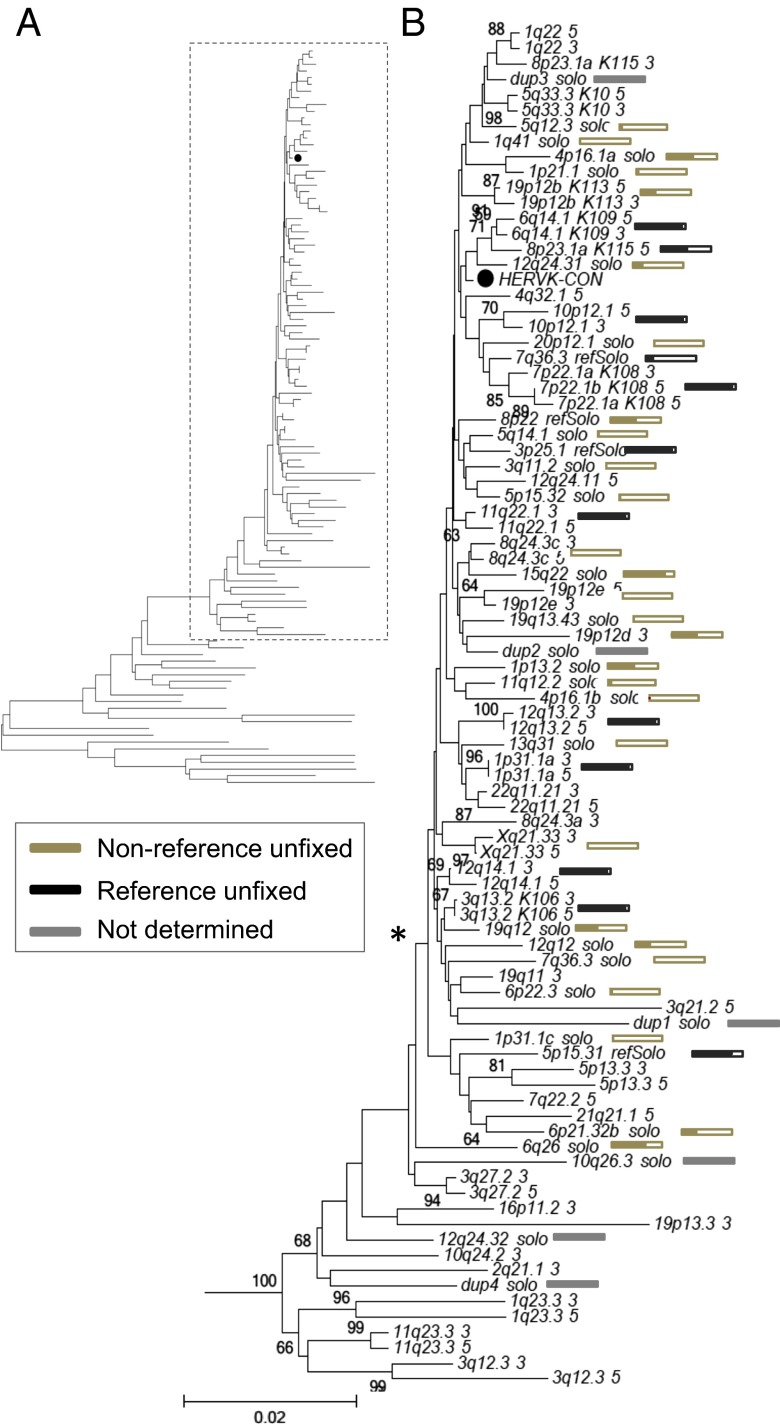
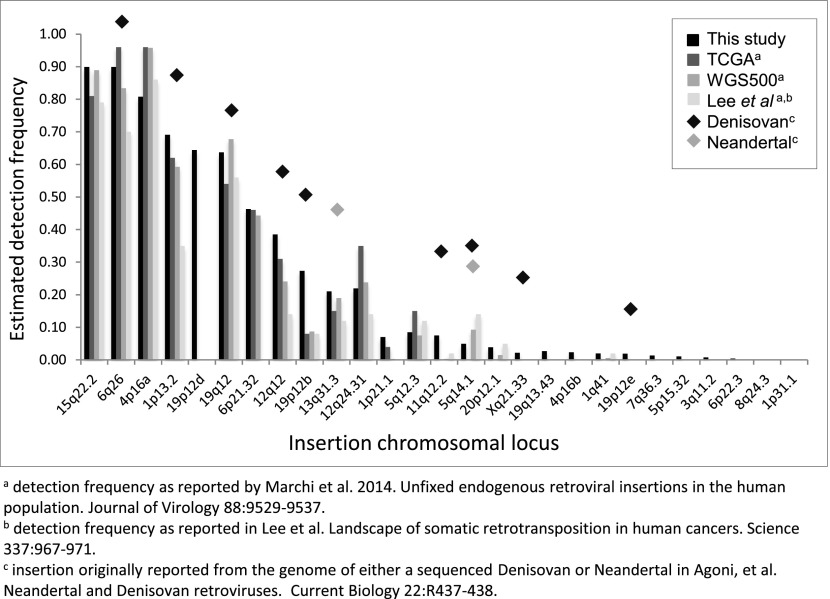
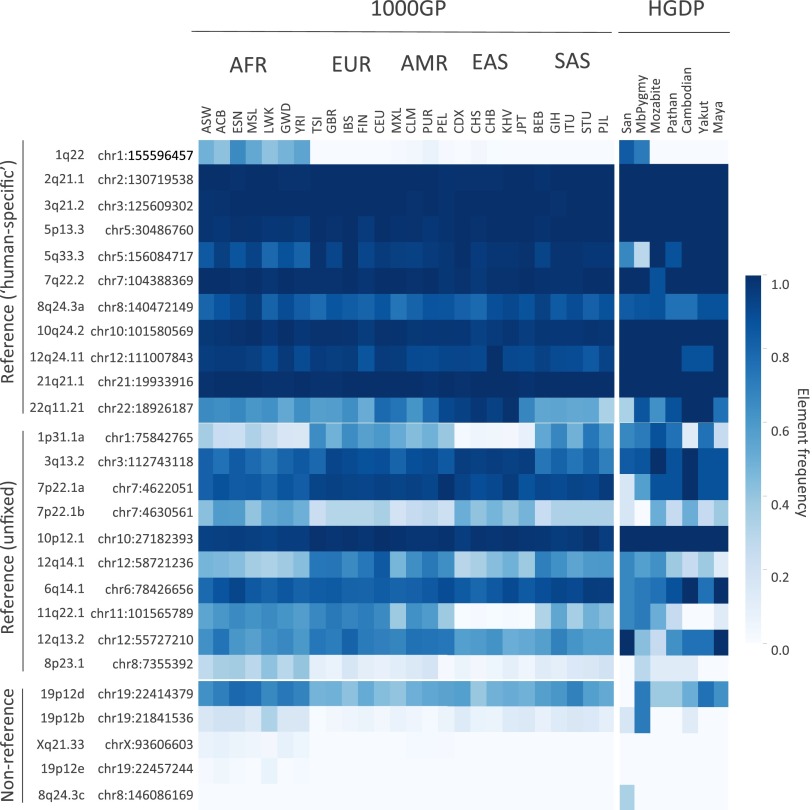
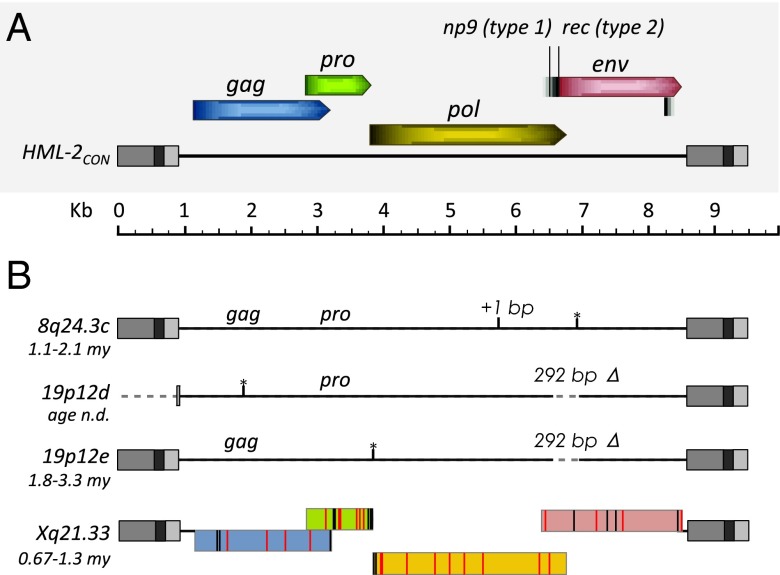
Endogenous retroviruses (ERVs) have contributed to more than 8% of the human genome. The majority of these elements lack function due to accumulated mutations or internal recombination resulting in a solitary (solo) LTR, although members of one group of human ERVs (HERVs), HERV-K, were recently active with members that remain nearly intact, a subset of which is present as insertionally polymorphic loci that include approximately full-length (2-LTR) and solo-LTR alleles in addition to the unoccupied site. Several 2-LTR insertions have intact reading frames in some or all genes that are expressed as functional proteins. These properties reflect the activity of HERV-K and suggest the existence of additional unique loci within humans. We sought to determine the extent to which other polymorphic insertions are present in humans, using sequenced genomes from the 1000 Genomes Project and a subset of the Human Genome Diversity Project panel. We report analysis of a total of 36 nonreference polymorphic HERV-K proviruses, including 19 newly reported loci, with insertion frequencies ranging from <0.0005 to >0.75 that varied by population. Targeted screening of individual loci identified three new unfixed 2-LTR proviruses within our set, including an intact provirus present at Xq21.33 in some individuals, with the potential for retained infectivity.

Keywords: 1000 Genomes Project; HERV-K; HML-2; Human Genome Diversity Project; human endogenous retrovirus.


Conflict of interest statement

The authors declare no conflict of interest.

Figures

Fig. 1.
Fig. 1.
Approaches for the detection of nonreference HML-2 insertions from WGS read data. Illumina short reads were processed by one of two methods. (Left) Read pairs (RPs) were identified that have one read mapped to the genome (gray) and mate to reads that map to the sequence matching the HML-2 LTR consensus (black). Supporting reads from each site were extracted and subjected to local assembly, and the resulting contigs were analyzed for the presence of LTR–genome junctions. (Right) Unmapped reads from each sample were identified that contained a sequence corresponding to the LTR edge, and the cognate sequence was then used to determine candidate integration positions from genomic data. (Bottom) PCR and capillary sequencing were used to validate candidate insertions in reactions that used flanking primers (gray arrows) to detect the presence of a solo-LTR or empty site, or a flanking primer paired with an internal proviral primer (black arrow) to infer the presence of a full-length allele. Representative products are shown in a genotyping gel to the right.
Fig. S1.
Fig. S1.
Assembly-based identification and validation of nonreference HML-2 insertions. (A, Upper) Integrative Genomics Viewer (IGV) screen shot showing Illumina paired short reads from four HGDP samples mapped to a candidate nonreference HML-2 insertion. The K113 locus at chr19:21,841,544 is illustrated as an example. Read pairs that have both reads mapped to the reference are shown in gray. Anchored reads that have discordant mated pairs (i.e., mapped to HML-2 LTRs that are present in the hg19 reference) are flagged and shown in color, and split reads (representing putative captured viral-genome junctions) are multicolored. Nearby SNPs are indicated by colored vertical lines within individual reads. HML-2 LTR-supporting read pairs, as reported in RetroSeq outputs, were then subjected to a local de novo assembly to generate contigs (boxed) corresponding to the 5′ and 3′ K113 proviral junctions. The sequence corresponding to the HML-2 LTR is shown in red; the sequence that maps to the reference is shown in black; and the candidate TSD is in shown dark red and underlined. (A, Middle) Alignment confirming overlap of the assembled contigs and presence of the TSD to the hg19 reference. Coloring is as above; the sequence corresponding to the reference is underlined. (A, Lower) Example validation screening is shown for integrations at 1p13.2 and 15q22.2 across a subset of 12 samples from the 1KGP. Each PCR contained three primers: two were designed to flank the insertion site, and a third primer was specific for the 5′ edge of the HML-2 LTR. Potential amplicons are interpreted to represent the preintegration site, solo-LTR (∼968 bp larger than the empty site), or an LTR-specific band. 2-LTR proviruses will not be amplified, but should produce an LTR-specific band. (B) Three-way alignments show overlap of HML-2–genome junctions against the hg19 reference (empty allele) for 27 validated nonreference insertions identified by breakpoint assembly. In each alignment, the reference allele is underlined and the sequence corresponding to the edges of either the 5′ or 3′ HML-2–LTR junction is shaded in red (LTR) or black (flanking). The hg19 insertion coordinates and locus are provided above each alignment; the asterisk indicates the first base of the LTR, respective of orientation (as indicated by “+” or “−” symbol). (C) Alignments corresponding to insertions identified in mining of unmapped reads. The junctions for five of seven insertions were validated in this study; the remaining two loci have been validated elsewhere (refer to main text). Sequences are shaded as above.
Fig. S1.
Fig. S1.
Assembly-based identification and validation of nonreference HML-2 insertions. (A, Upper) Integrative Genomics Viewer (IGV) screen shot showing Illumina paired short reads from four HGDP samples mapped to a candidate nonreference HML-2 insertion. The K113 locus at chr19:21,841,544 is illustrated as an example. Read pairs that have both reads mapped to the reference are shown in gray. Anchored reads that have discordant mated pairs (i.e., mapped to HML-2 LTRs that are present in the hg19 reference) are flagged and shown in color, and split reads (representing putative captured viral-genome junctions) are multicolored. Nearby SNPs are indicated by colored vertical lines within individual reads. HML-2 LTR-supporting read pairs, as reported in RetroSeq outputs, were then subjected to a local de novo assembly to generate contigs (boxed) corresponding to the 5′ and 3′ K113 proviral junctions. The sequence corresponding to the HML-2 LTR is shown in red; the sequence that maps to the reference is shown in black; and the candidate TSD is in shown dark red and underlined. (A, Middle) Alignment confirming overlap of the assembled contigs and presence of the TSD to the hg19 reference. Coloring is as above; the sequence corresponding to the reference is underlined. (A, Lower) Example validation screening is shown for integrations at 1p13.2 and 15q22.2 across a subset of 12 samples from the 1KGP. Each PCR contained three primers: two were designed to flank the insertion site, and a third primer was specific for the 5′ edge of the HML-2 LTR. Potential amplicons are interpreted to represent the preintegration site, solo-LTR (∼968 bp larger than the empty site), or an LTR-specific band. 2-LTR proviruses will not be amplified, but should produce an LTR-specific band. (B) Three-way alignments show overlap of HML-2–genome junctions against the hg19 reference (empty allele) for 27 validated nonreference insertions identified by breakpoint assembly. In each alignment, the reference allele is underlined and the sequence corresponding to the edges of either the 5′ or 3′ HML-2–LTR junction is shaded in red (LTR) or black (flanking). The hg19 insertion coordinates and locus are provided above each alignment; the asterisk indicates the first base of the LTR, respective of orientation (as indicated by “+” or “−” symbol). (C) Alignments corresponding to insertions identified in mining of unmapped reads. The junctions for five of seven insertions were validated in this study; the remaining two loci have been validated elsewhere (refer to main text). Sequences are shaded as above.
Fig. S2.
Fig. S2.
Assembled loci with unusual structure. Detailed nucleotide structure of the assembled contigs at 15q13.1 and 10q24.2. (A) Consensus LTR from the most recent HERV-K HML-2 insertions corresponds to the 968-bp LTR5_Hs consensus (RepBase release 11.03). The last 146 bp (yellow shading) are detected in two of our assembled structures; specific regions are labeled to indicate structural similarities with the two assembled elements as follows. (B) Nucleotide sequences and Miropeats alignments derived in local read assemblies at the 15q13.1 (Upper) and 10q24.2 (Lower) loci. Shading is used to discriminate LTR-derived portions from flanking genomic sequence. The yellow shading indicates an LTR5_Hs-matching sequence that assembles as an inverted repeat (red arrows) with a central unique portion (bolded and italicized in all three sequences) at those sites. The presence of a short stretch of the LTR-derived portion that is present in the hg19 reference is shown in blue, and the putative TSDs of 6 bp and 5 bp, respectively, are shaded in green. Block arrows indicate RepeatMasker annotated repeats within each aligned segment. DNA repeats are shown in pink, LTRs are shown in orange, long interspersed elements (LINEs) are shown in green, short interspersed elements (SINEs) are shown in purple.
Fig. S3.
Fig. S3.
Insertions located within genomic structural variants. Aligned sequence segments were generated using the program Miropeats (58) for HML-2 insertions in encompassing deletions that exist as structural variants in humans, located within 10q26.3 (A) and 12q24.32 (B) relative to the hg19 reference. Junction sequences corresponding to these insertions were recovered in BLAST searches of the NCBI Trace Archive; the adjacent flanking sequence maps to putative preinsertion sites within nonhuman primate reference genomes (gorilla or chimpanzee indicated as appropriate, including positions mapping to the preinsertion alleles in those references). The alignments corresponding to either insertion are arranged to indicate the absence of the insertion in the hg19 segment (Top), the presence of the insertion within the validated variant region (Middle), and the homologous sequence from the reference to which the preinsertion site could be mapped (Bottom). Lines are used to indicate segments of homology between the aligned segments. The validated LTR at 10q26.3 was sequenced in this study (HG00449), and the LTR at 12q24.32 was taken from a finished fosmid clone from Kidd et al. (43) (NIH CloneDB: AC1945745.1). Repeats are colored as in Fig. S2. The LTRs corresponding to the identified HML-2 insertions at 10q26.3 and 12q23.32 are labeled in blue with arrows.
Fig. 2.
Fig. 2.
Estimated insertion allele frequencies of unfixed HML-2 insertions in humans. A total of 40 HML-2 loci were subjected to in silico genotyping: 13 sites represented the unfixed HML-2 loci from the hg19 reference, and 27 sites corresponded to nonreference polymorphic HML-2 reported here. Genotypes were inferred for each unfixed HML-2 locus across samples based on remapping of Illumina reads to reconstructed insertion or empty alleles corresponding to each site. Samples lacking remapped reads at a particular site were excluded from genotyping at that site. Allele frequencies were then calculated for each population as the total number of insertion alleles divided by total alleles. Allele frequencies are depicted as a heat map according to the color legend to the right. The 1KGP (1000GP) and HGDP populations are labeled above (also refer to Dataset S1 for population descriptors and other information). The locus of each of the unfixed HML-2 loci is labeled to the left according to its cytoband position. An asterisk is used to indicate insertions that have confirmed full-length copies. (Upper) Estimated distribution of reference unfixed HML-2 [from loci reported by Subramanian et al. (11) and Belshaw et al. (5)]. (Lower) Estimated distribution of nonreference HML-2 insertions. AFR, African; AMR, Admixed American; EAS, East Asian; EUR, European; SAS, South Asian.
Fig. S4.
Fig. S4.
Inferred frequencies of additional human-specific HML-2 insertions in humans. A total of 85 additional HML-2 loci were subjected to in silico genotyping based on previous reports of human-specific HML-2 elements from Belshaw et al. (5) and Subramanian et al. (11). Of these loci, 81 insertions are present as solo-LTRs and four (indicated to the left by an asterisk) are present as proviruses in the hg19 reference genome, excluding insertions with unmatched TSDs and requiring the presence of cognate LTRs for full-length proviruses. Three solo-LTRs corresponded to duplicated loci and were excluded (chr8_91696140, chrY_25039185, and chrY_26672934). Genotypes were inferred by remapping Illumina reads to reconstructed reference (i.e., insertion) or alternate (i.e., empty) alleles for each site. Population allele frequencies were calculated as the total number of insertion alleles divided by total alleles and shown by heat map. The 1KGP and HGDP populations are labeled above (also refer to Dataset S1). The locus of each of the unfixed HML-2 loci is labeled to the left according to its chromosomal position.
Fig. 3.
Fig. 3.
Phylogenetic construction of HML-2 LTRs within humans. (A) Neighbor-joining tree was constructed based on the aligned nucleotide sequences corresponding to HML-2 LTRs from the LTR5Hs group, specifically including those nucleotide sequences considered to be human-specific and/or polymorphic. The LTRs were extracted from (i) all reference HML-2 proviruses previously inferred as belonging to the LTR5Hs HML-2 subgroup [as reported by Subramanian et al. (11)], (ii) unfixed reference solo-LTRs [as reported by Belshaw et al. (5), and (iii) unfixed nonreference insertions as reported here. Both 5′ and 3′ LTRs were used for full-length insertions, when present. The closed circle (●) indicates the taxon corresponding to the HERV-KCON LTR within the tree. Classic nomenclature has been included in taxon names for the better studied insertions: K113 (19p12b), K108 (7p22.1), K115 (8p23.1a), K106 (3q13.2), and K109 (6q14.1). (B) Detailed view of branches representing unfixed HML-2 insertions. Individual HML-2 loci are indicated for each branch as follows: the cytoband followed by a 5′ or 3′ for the 5′ or 3′ LTRs from full-length insertions, solo for nonreference unfixed solo-LTR insertions, or refSolo for reference unfixed loci. An asterisk is used to indicate the position of the clade containing the majority of unfixed insertions. Boxes are used to indicate estimated allele frequencies for each unfixed insertion at the end of each respective branch. The filled area within each box is shown as proportional to the estimated frequency of the insertion in all samples; the derived values are provided in Dataset S3. Gold and black boxes are used to represent nonreference and reference unfixed insertions, and gray bars indicate the elements for which the frequency could not be determined.
Fig. S5.
Fig. S5.
Comparison of the inferred presence of nonreference HML-2 insertions with other reports. Insertion frequencies were calculated as the proportion of individuals with evidence for the insertion, as estimated by remapping of local reads to reconstructed alleles representing the insertion and empty states across samples. Samples without read support at a given site were not included in calculations for that site. The obtained values are plotted for 27 nonreference HML-2 insertions identified in our analysis. Insertion detection frequencies from this analysis are plotted in black; frequencies inferred from similar analysis of sequenced genomes from 26 TCGA and 332 WGS500 samples [Marchi et al. (12)], and 44 sequenced clinical samples [Lee et al. (41)] are shown in gray as indicated in the key. Shaded diamonds are used to indicate elements also detected in the sequenced Neandertal and Denisovan genomes [Agoni et al. (42) and Lee et al. (51)].
Fig. S6.
Fig. S6.
Presence of full-length unfixed HML-2 proviruses in the human genome. The presence of provirus (2-LTR) insertions was inferred based on counting of unique k-mers identified from the full nucleotide sequences corresponding to unfixed full-length insertions. Cytoband information and chromosomal positions corresponding to each locus are shown to the left. Sample carrier frequencies are represented as a heat map as shown by the color legend to the right. Samples are labeled by population according to the 1KGP (1000GP) or HGDP dataset (also refer to Dataset S1). The estimated distribution of reference unfixed HML-2 with confirmed 2-LTR proviruses [from loci reported by Subramanian et al. (11)] and the estimated distribution of nonreference HML-2 2-LTR insertions reported here are shown. AFR, African; AMR, Admixed American; EAS, East Asian; EUR, European; SAS, South Asian.
Fig. 4.
Fig. 4.
Features of newly identified HML-2 proviruses in humans. (A) Schematic representation of the consensus HML-2 provirus, including the viral gene positions and frames to scale. Splice sites for np9 (type 1 insertion, 292 bp Δ) and rec (type 2) are indicated. Regions within the LTRs are colored in gray: U3, medium; R, dark; U5, light. (B) Features of nonreference identified proviruses are shown to scale. The region of 292 bp is labeled for type 1 insertions. Age estimations are shown for each site. n.d., not determined. The black vertical line indicates a frameshift mutation (as indicated “+1 bp”); black lines with asterisks are used to indicate positions of stop codons where present. Reading frames are shown for the Xq21.33 2-LTR provirus as colored as in A. Black vertical lines within the frames indicate the positions of base changes that are observed in other full-length HML-2 proviruses. Red vertical lines are used to indicate base changes that are unique to the sequenced Xq21.33 provirus.

Comment in

  • HERV-K HML-2 diversity among humans.
    Lenz J. Lenz J. Proc Natl Acad Sci U S A. 2016 Apr 19;113(16):4240-2. doi: 10.1073/pnas.1603569113. Epub 2016 Apr 8. Proc Natl Acad Sci U S A. 2016. PMID: 27071126 Free PMC article. No abstract available.

Similar articles

Cited by

References

    1. Boeke JD, Stoye JP. Retrotransposons, endogenous retroviruses, and the evolution of retroelements. In: Hughes S, Varmus H, editors. Retroviruses. Cold Spring Harbor Laboratory Press; Plainview, NY: 1997. pp. 343–435. - PubMed
    1. McPherson JD, et al. International Human Genome Mapping Consortium A physical map of the human genome. Nature. 2001;409(6822):934–941. - PubMed
    1. Jern P, Coffin JM. Effects of retroviruses on host genome function. Annu Rev Genet. 2008;42:709–732. - PubMed
    1. Barbulescu M, et al. Many human endogenous retrovirus K (HERV-K) proviruses are unique to humans. Curr Biol. 1999;9(16):861–868. - PubMed
    1. Belshaw R, et al. Genomewide screening reveals high levels of insertional polymorphism in the human endogenous retrovirus family HERV-K(HML2): Implications for present-day activity. J Virol. 2005;79(19):12507–12514. - PMC - PubMed

Publication types

Associated data