Activation of Endothelial Nitric Oxide (eNOS) Occurs through Different Membrane Domains in Endothelial Cells
- PMID: 26977592
- PMCID: PMC4792450
- DOI: 10.1371/journal.pone.0151556
Activation of Endothelial Nitric Oxide (eNOS) Occurs through Different Membrane Domains in Endothelial Cells
Abstract
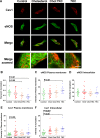
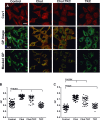
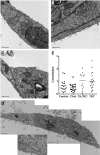
Endothelial cells respond to a large range of stimuli including circulating lipoproteins, growth factors and changes in haemodynamic mechanical forces to regulate the activity of endothelial nitric oxide synthase (eNOS) and maintain blood pressure. While many signalling pathways have been mapped, the identities of membrane domains through which these signals are transmitted are less well characterized. Here, we manipulated bovine aortic endothelial cells (BAEC) with cholesterol and the oxysterol 7-ketocholesterol (7KC). Using a range of microscopy techniques including confocal, 2-photon, super-resolution and electron microscopy, we found that sterol enrichment had differential effects on eNOS and caveolin-1 (Cav1) colocalisation, membrane order of the plasma membrane, caveolae numbers and Cav1 clustering. We found a correlation between cholesterol-induced condensation of the plasma membrane and enhanced high density lipoprotein (HDL)-induced eNOS activity and phosphorylation suggesting that cholesterol domains, but not individual caveolae, mediate HDL stimulation of eNOS. Vascular endothelial growth factor (VEGF)-induced and shear stress-induced eNOS activity was relatively independent of membrane order and may be predominantly controlled by the number of caveolae on the cell surface. Taken together, our data suggest that signals that activate and phosphorylate eNOS are transmitted through distinct membrane domains in endothelial cells.
Conflict of interest statement
Figures


Similar articles
-
TNF-alpha potentiates protein-tyrosine nitration through activation of NADPH oxidase and eNOS localized in membrane rafts and caveolae of bovine aortic endothelial cells.Am J Physiol Heart Circ Physiol. 2007 Feb;292(2):H954-62. doi: 10.1152/ajpheart.00758.2006. Epub 2006 Oct 6. Am J Physiol Heart Circ Physiol. 2007. PMID: 17028163
-
Opposing effects of reactive oxygen species and cholesterol on endothelial nitric oxide synthase and endothelial cell caveolae.Circ Res. 1999 Jul 9;85(1):29-37. doi: 10.1161/01.res.85.1.29. Circ Res. 1999. PMID: 10400908
-
Caveolin-1 expression is critical for vascular endothelial growth factor-induced ischemic hindlimb collateralization and nitric oxide-mediated angiogenesis.Circ Res. 2004 Jul 23;95(2):154-61. doi: 10.1161/01.RES.0000136344.27825.72. Epub 2004 Jun 17. Circ Res. 2004. PMID: 15205364
-
Regulation of eNOS in caveolae.Adv Exp Med Biol. 2012;729:51-62. doi: 10.1007/978-1-4614-1222-9_4. Adv Exp Med Biol. 2012. PMID: 22411313 Review.
-
Endothelial nitric oxide synthase, caveolae and the development of atherosclerosis.J Physiol. 2003 Feb 15;547(Pt 1):21-33. doi: 10.1113/jphysiol.2002.031534. Epub 2003 Jan 10. J Physiol. 2003. PMID: 12562964 Free PMC article. Review.
Cited by
-
Redistribution of Membrane Raft Microdomains by Apolipoprotein A-I In Mouse Aortic Endothelial Cells.Cardiovasc Dis Med. 2020;1(1):10.47496/nl.cdm.2020.01.02. doi: 10.47496/nl.cdm.2020.01.02. Epub 2020 Nov 13. Cardiovasc Dis Med. 2020. PMID: 38784448 Free PMC article.
-
Cell-free formation and interactome analysis of caveolae.J Cell Biol. 2018 Jun 4;217(6):2141-2165. doi: 10.1083/jcb.201707004. Epub 2018 May 1. J Cell Biol. 2018. PMID: 29716956 Free PMC article.
-
The Role of Structure and Biophysical Properties in the Pleiotropic Effects of Statins.Int J Mol Sci. 2020 Nov 19;21(22):8745. doi: 10.3390/ijms21228745. Int J Mol Sci. 2020. PMID: 33228116 Free PMC article. Review.
-
Endothelial Nitric Oxide Mediates the Anti-Atherosclerotic Action of Torenia concolor Lindley var. Formosama Yamazaki.Int J Mol Sci. 2020 Feb 24;21(4):1532. doi: 10.3390/ijms21041532. Int J Mol Sci. 2020. PMID: 32102326 Free PMC article.
-
eNOS-NO-induced small blood vessel relaxation requires EHD2-dependent caveolae stabilization.PLoS One. 2019 Oct 10;14(10):e0223620. doi: 10.1371/journal.pone.0223620. eCollection 2019. PLoS One. 2019. PMID: 31600286 Free PMC article.
References
-
- Brown DA, Rose JK. Sorting of GPI-anchored proteins to glycolipid enriched membrane subdomains during transport to the apical cell surface. Cell. 1992;68:533–44. - PubMed
-
- Xu X, London E. The effect of sterol structure on membrane lipid domains reveals how cholesterol can induce lipid domain formation. Biochemistry. 2000;39(5):843–9. Epub 2000/02/02. bi992543v [pii]. . - PubMed
-
- Ahmed SN, Brown DA, London E. On the origin of sphingolipid/cholesterol-rich detergent-insoluble cell membranes: physiological concentrations of cholesterol and sphingolipid induce formation of a detergent-insoluble, liquid-ordered lipid phase in model membranes. Biochemistry. 1997;36(36):10944–53. 10.1021/bi971167g . - DOI - PubMed
Publication types
MeSH terms
Substances
Grants and funding
LinkOut - more resources
Full Text Sources
Other Literature Sources

