

Ceramide Synthase 5 Is Essential to Maintain C16:0-Ceramide Pools and Contributes to the Development of Diet-induced Obesity
- PMID: 26853464
- PMCID: PMC4807283
- DOI: 10.1074/jbc.M115.691212
Ceramide Synthase 5 Is Essential to Maintain C16:0-Ceramide Pools and Contributes to the Development of Diet-induced Obesity
Abstract
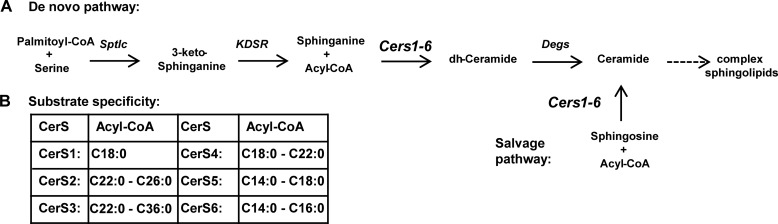
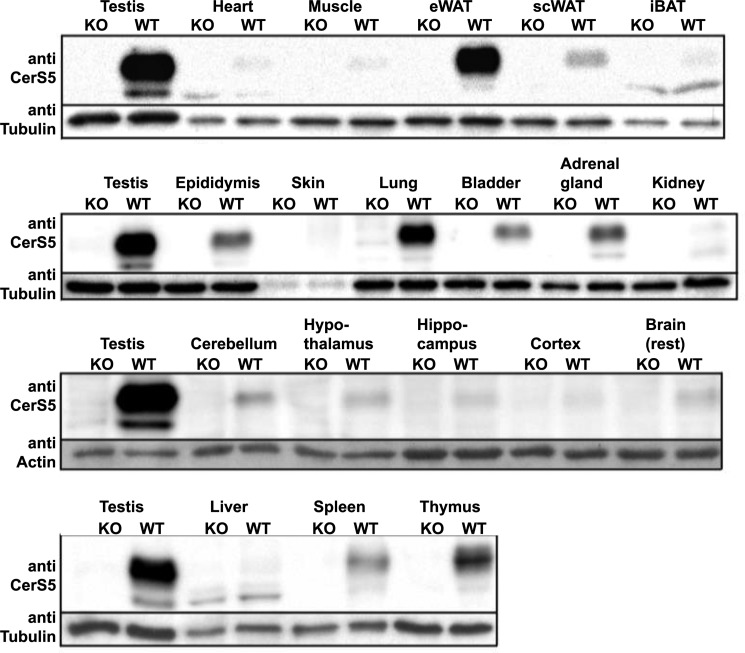
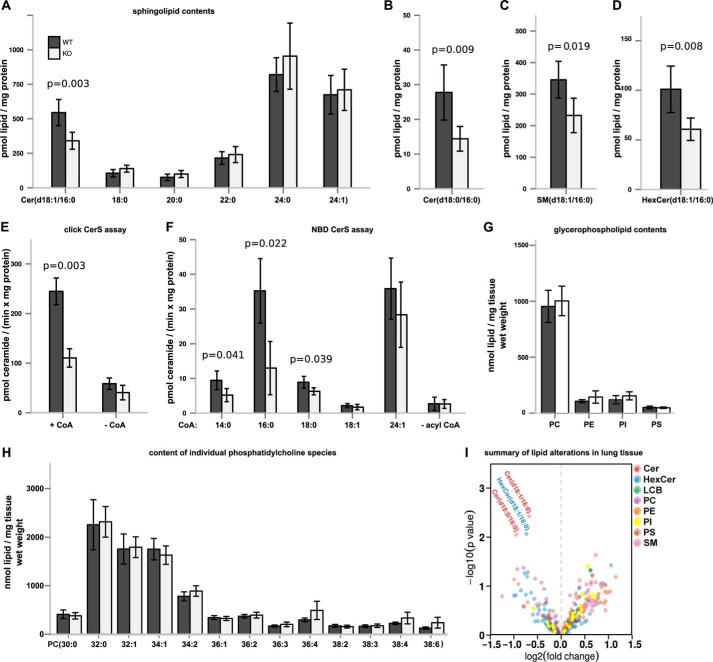
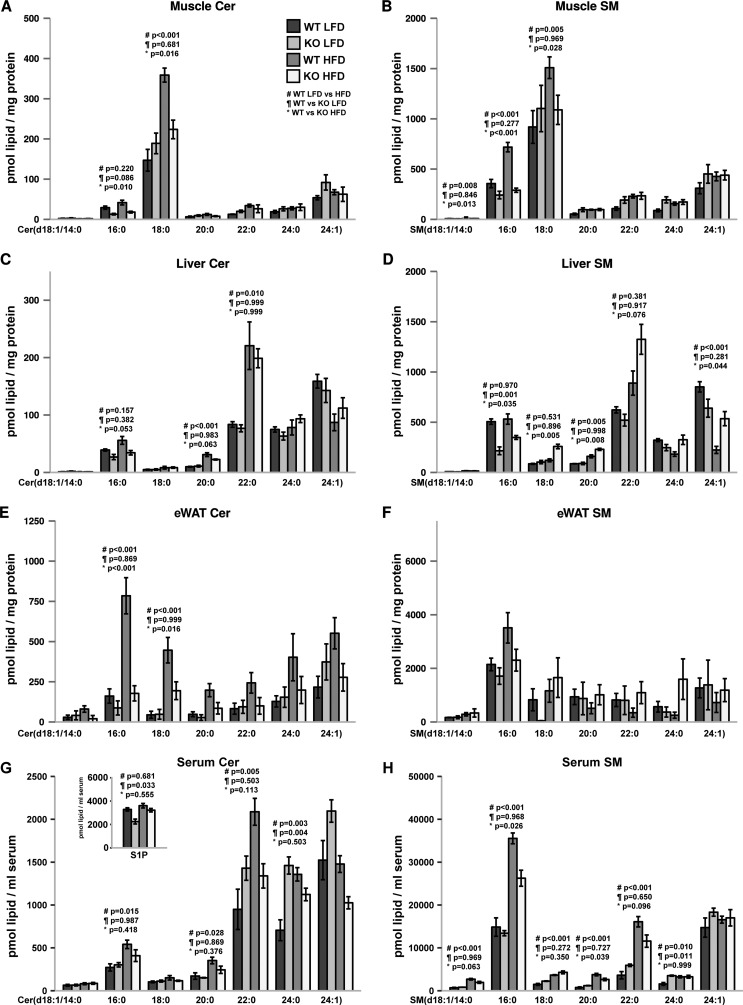
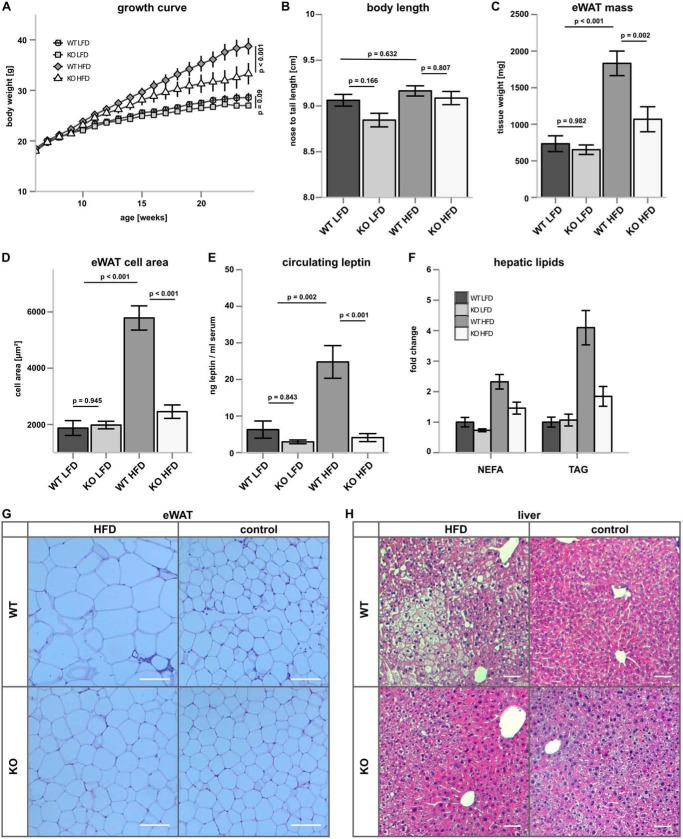
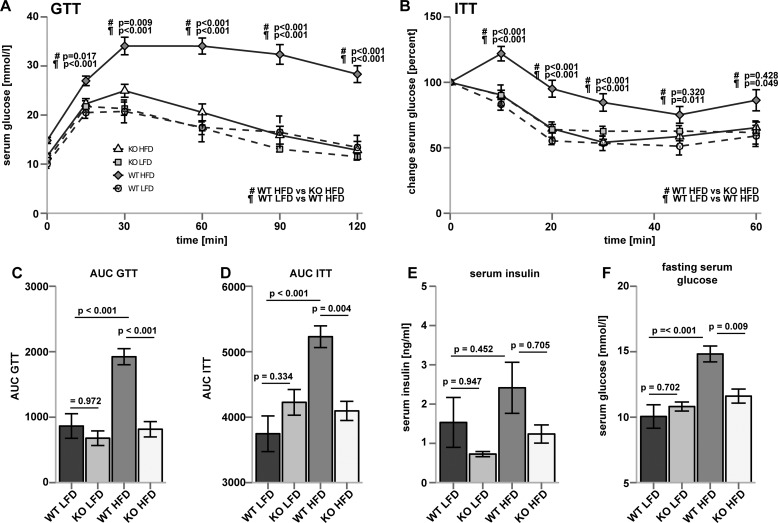
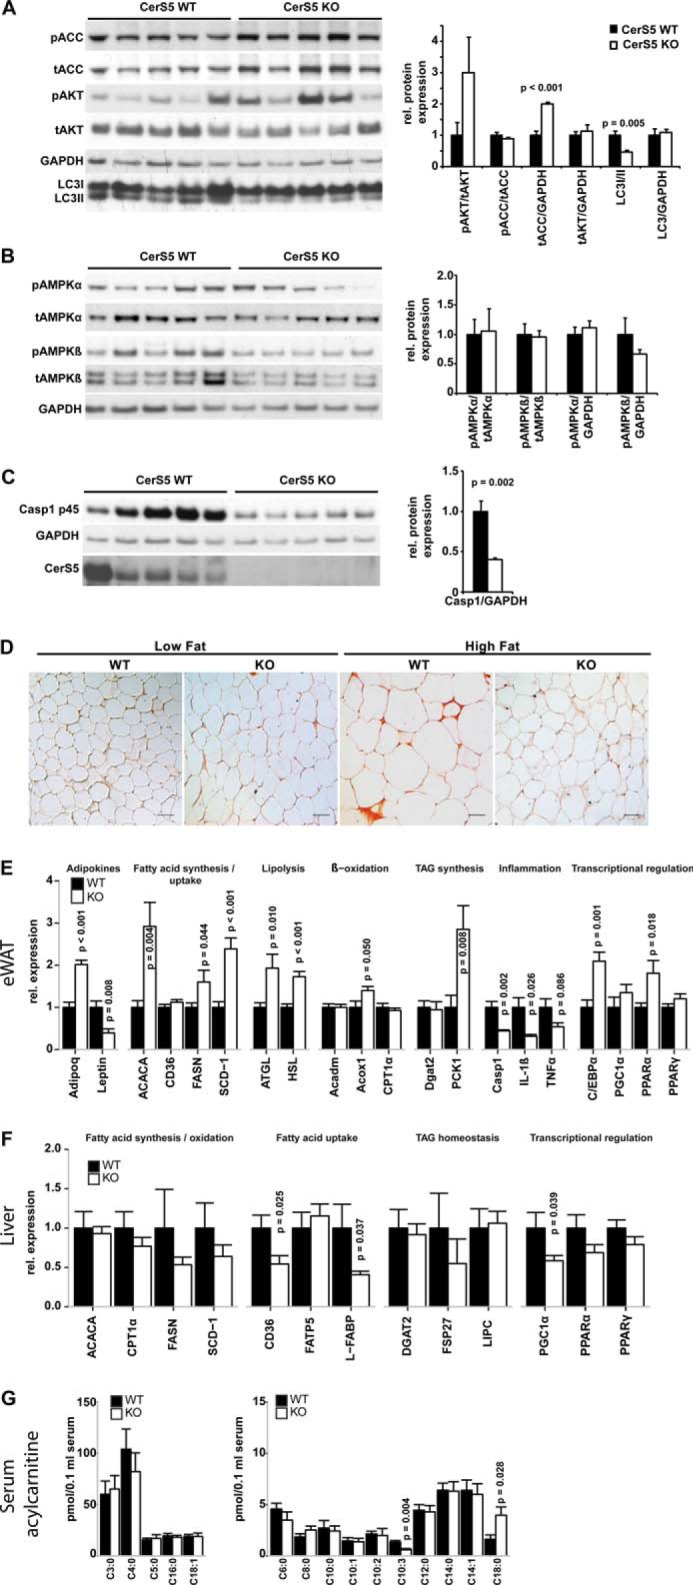
Ceramides are bioactive sphingolipids, which are composed of sphingoid bases carrying acyl chains of various lengths. Ceramides are synthesized by a family of six ceramide synthases (CerS) in mammals, which produce ceramides with differentN-linked acyl chains. Increased ceramide levels are known to contribute to the development of obesity and insulin resistance. Recently, it has been demonstrated that the ceramide acylation pattern is of particular importance for an organism to maintain energy homeostasis. However, which of theCerSfamily members are involved in this process is not yet completely known. Using newly developedCerS5knock-out mice, we show here thatCerS5is essential to maintain cellular C16:0sphingolipid pools in lung, spleen, muscle, liver, and white adipose tissue. Glycerophospholipid levels inCerS5-deficient mice were not altered. We found a strong impact of CerS5-dependent ceramide synthesis in white adipose tissue after high fat diet feeding. In skeletal muscle, liver, and spleen, C16:0-ceramide levels were altered independent of feeding conditions. The loss ofCerS5is associated with reduced weight gain and improved systemic health, including maintenance of glucose homeostasis and reduced white adipose tissue inflammation after high fat diet challenge. Our findings indicate that reduction of endogenous C16:0-ceramide by genetic inhibition ofCerS5is sufficient to ameliorate obesity and its comorbidities.
Keywords: adipose tissue metabolism; ceramide; ceramide synthase; diabetes; gene knockout; insulin resistance; lipid metabolism; metabolism; obesity; sphingolipid.
© 2016 by The American Society for Biochemistry and Molecular Biology, Inc.
Figures
Similar articles
-
The role of C16:0 ceramide in the development of obesity and type 2 diabetes: CerS6 inhibition as a novel therapeutic approach.Mol Metab. 2019 Mar;21:36-50. doi: 10.1016/j.molmet.2018.12.008. Epub 2019 Jan 2. Mol Metab. 2019. PMID: 30655217 Free PMC article.
-
Obesity-induced CerS6-dependent C16:0 ceramide production promotes weight gain and glucose intolerance.Cell Metab. 2014 Oct 7;20(4):678-86. doi: 10.1016/j.cmet.2014.08.002. Cell Metab. 2014. PMID: 25295788
-
CerS1-Derived C18:0 Ceramide in Skeletal Muscle Promotes Obesity-Induced Insulin Resistance.Cell Rep. 2019 Jan 2;26(1):1-10.e7. doi: 10.1016/j.celrep.2018.12.031. Cell Rep. 2019. PMID: 30605666
-
The role of the ceramide acyl chain length in neurodegeneration: involvement of ceramide synthases.Neuromolecular Med. 2010 Dec;12(4):341-50. doi: 10.1007/s12017-010-8114-x. Epub 2010 May 26. Neuromolecular Med. 2010. PMID: 20502986 Review.
-
A Stroll Down the CerS Lane.Adv Exp Med Biol. 2019;1159:49-63. doi: 10.1007/978-3-030-21162-2_4. Adv Exp Med Biol. 2019. PMID: 31502199 Review.
Cited by
-
Hepatic triglyceride accumulation via endoplasmic reticulum stress-induced SREBP-1 activation is regulated by ceramide synthases.Exp Mol Med. 2019 Nov 1;51(11):1-16. doi: 10.1038/s12276-019-0340-1. Exp Mol Med. 2019. PMID: 31676768 Free PMC article.
-
Potential Drug Targets for Ceramide Metabolism in Cardiovascular Disease.J Cardiovasc Dev Dis. 2022 Dec 2;9(12):434. doi: 10.3390/jcdd9120434. J Cardiovasc Dev Dis. 2022. PMID: 36547431 Free PMC article. Review.
-
The role of ceramides in metabolic disorders: when size and localization matters.Nat Rev Endocrinol. 2020 Apr;16(4):224-233. doi: 10.1038/s41574-020-0320-5. Epub 2020 Feb 14. Nat Rev Endocrinol. 2020. PMID: 32060415 Review.
-
Ceramides in Adipose Tissue.Front Endocrinol (Lausanne). 2020 Jun 19;11:407. doi: 10.3389/fendo.2020.00407. eCollection 2020. Front Endocrinol (Lausanne). 2020. PMID: 32636806 Free PMC article. Review.
-
Contribution of Adipose Tissue Inflammation to the Development of Type 2 Diabetes Mellitus.Compr Physiol. 2018 Dec 13;9(1):1-58. doi: 10.1002/cphy.c170040. Compr Physiol. 2018. PMID: 30549014 Free PMC article. Review.
References
-
- Jennemann R., Rabionet M., Gorgas K., Epstein S., Dalpke A., Rothermel U., Bayerle A., van der Hoeven F., Imgrund S., Kirsch J., Nickel W., Willecke K., Riezman H., Gröne H.-J., and Sandhoff R. (2012) Loss of ceramide synthase 3 causes lethal skin barrier disruption. Hum. Mol. Genet. 21, 586–608 - PubMed
-
- Ginkel C., Hartmann D., vom Dorp K., Zlomuzica A., Farwanah H., Eckhardt M., Sandhoff R., Degen J., Rabionet M., Dere E., Dörmann P., Sandhoff K., and Willecke K. (2012) Ablation of neuronal ceramide synthase 1 in mice decreases ganglioside levels and expression of myelin-associated glycoprotein in oligodendrocytes. J. Biol. Chem. 287, 41888–41902 - PMC - PubMed
-
- Pewzner-Jung Y., Park H., Laviad E. L., Silva L. C., Lahiri S., Stiban J., Erez-Roman R., Brügger B., Sachsenheimer T., Wieland F., Prieto M., Merrill A. H. Jr., and Futerman A. H. (2010) A critical role for ceramide synthase 2 in liver homeostasis: I. alterations in lipid metabolic pathways. J. Biol. Chem. 285, 10902–10910 - PMC - PubMed
Publication types
MeSH terms
Substances
LinkOut - more resources
Full Text Sources
Other Literature Sources
Medical
Molecular Biology Databases
