. 2016 Feb 2:7:10438.
doi: 10.1038/ncomms10438.

Stabilization of p21 by mTORC1/4E-BP1 predicts clinical outcome of head and neck cancers

Affiliations

Stabilization of p21 by mTORC1/4E-BP1 predicts clinical outcome of head and neck cancers

Susana Llanos et al. Nat Commun. .

Abstract

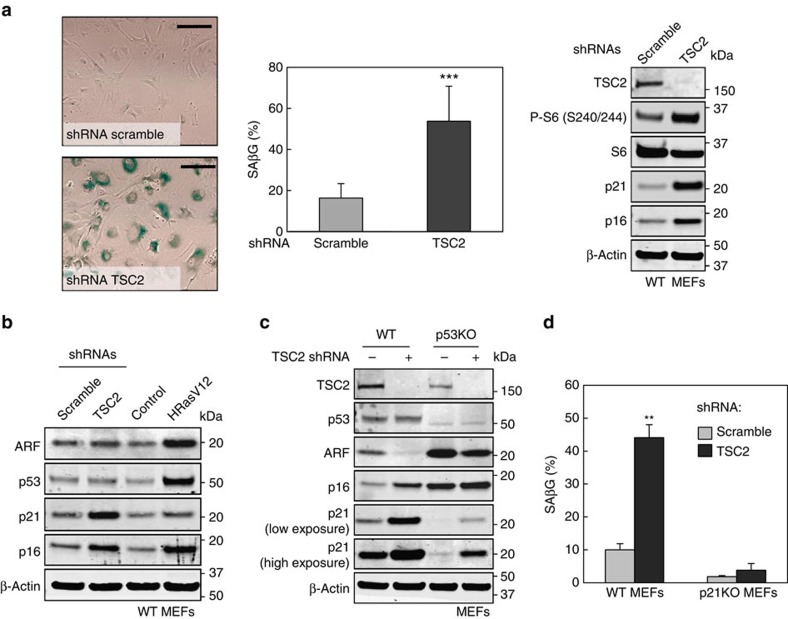
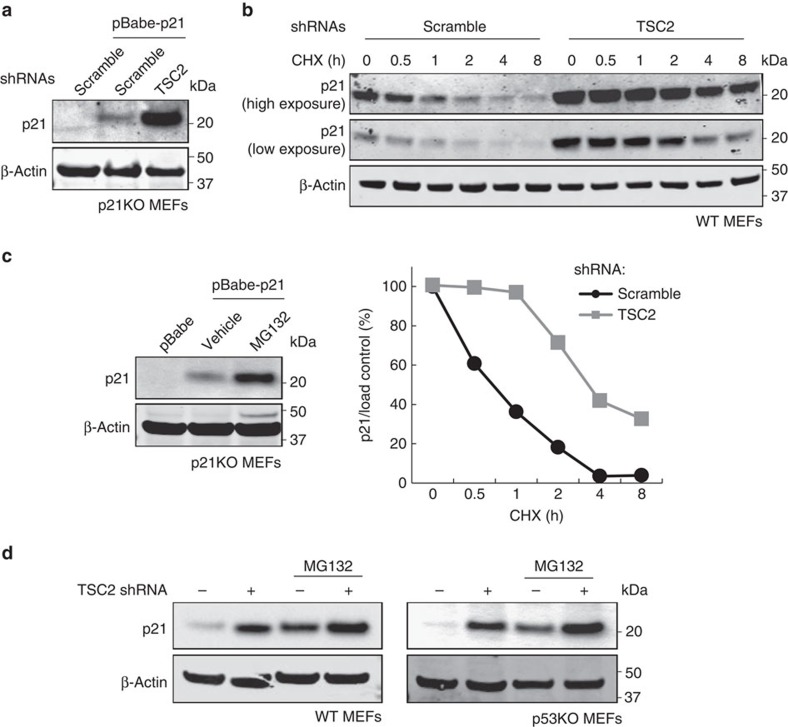
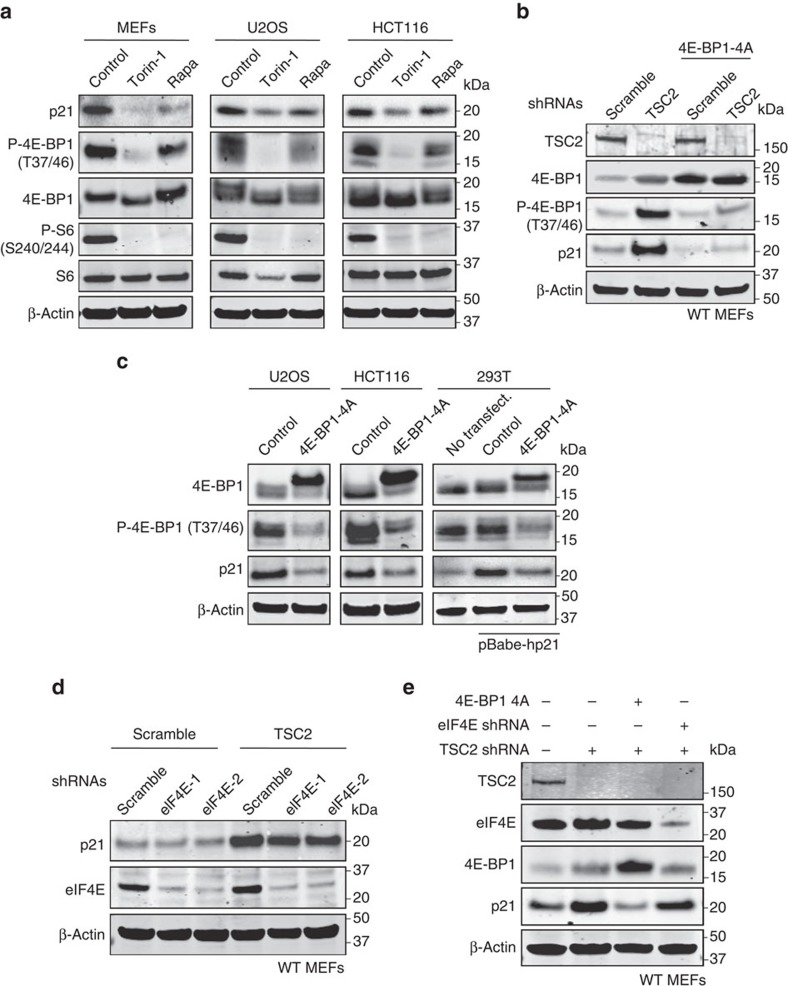
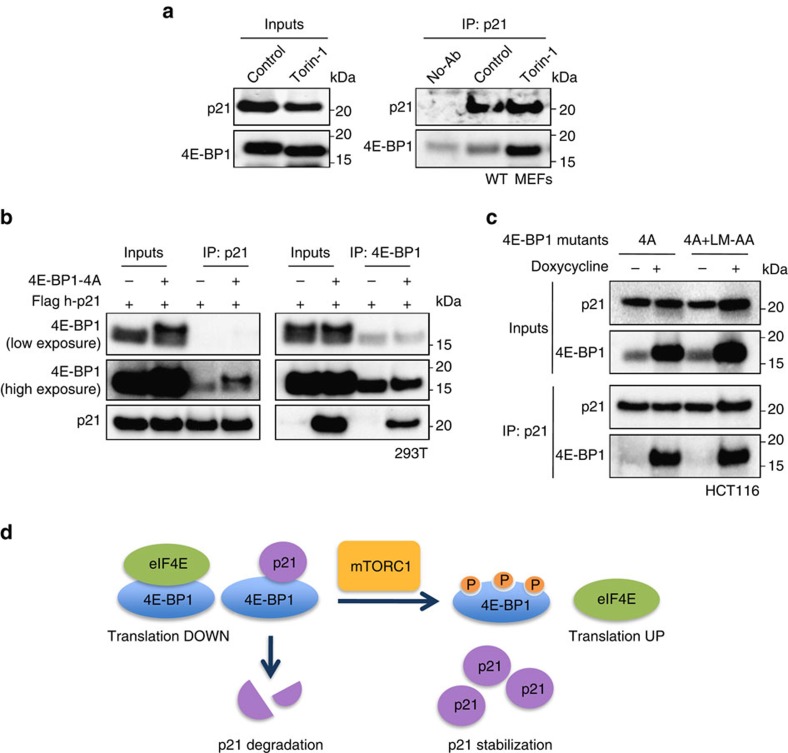
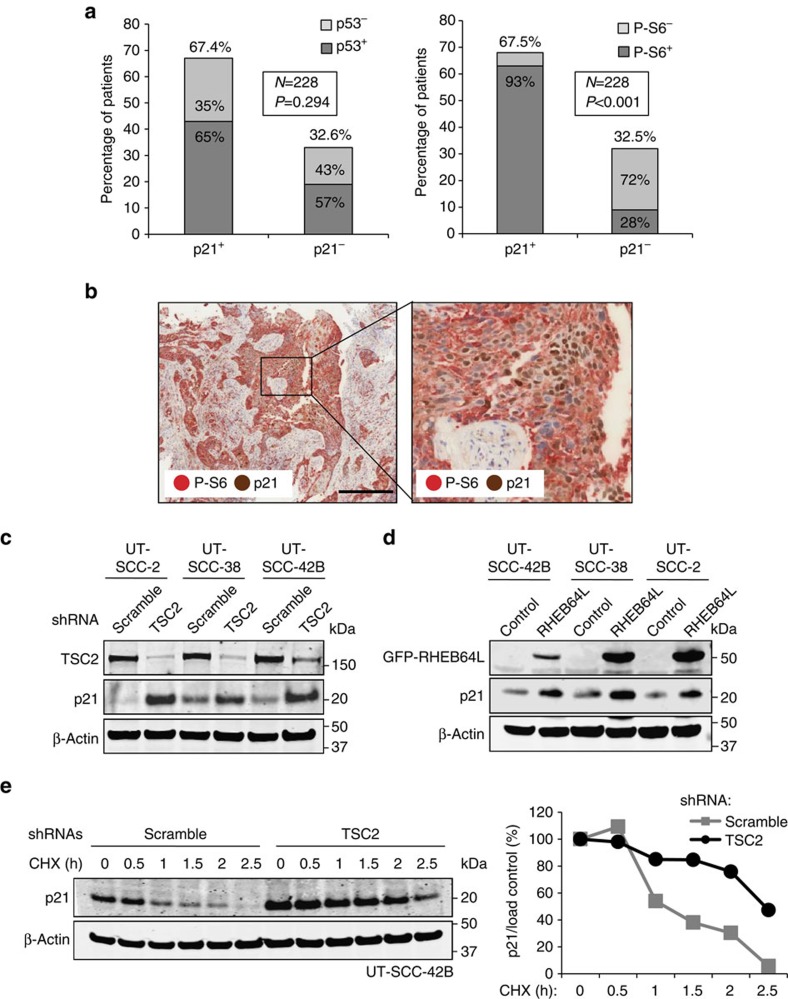
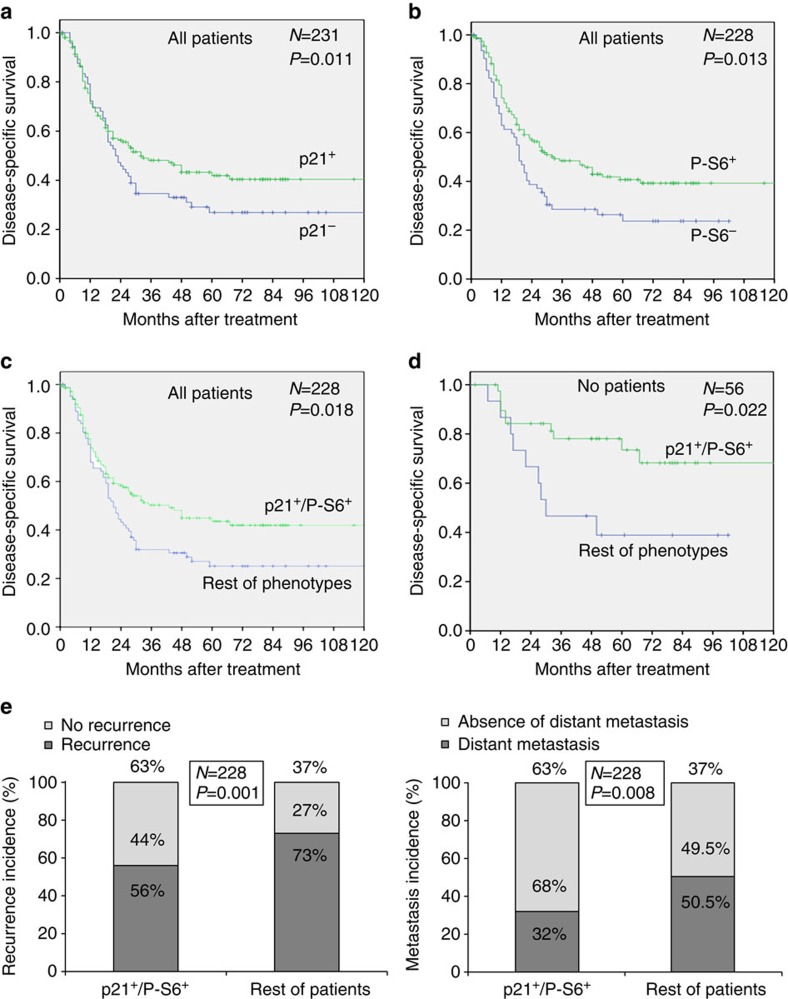
The levels, regulation and prognostic value of p21 in head and neck squamous cell carcinomas (HNSCC) has been puzzling for years. Here, we report a new mechanism of regulation of p21 by the mTORC1/4E-BP1 pathway. We find that non-phosphorylated 4E-BP1 interacts with p21 and induces its degradation. Accordingly, hyper-activation of mTORC1 results in phosphorylation of 4E-BP1 and stabilization of p21. In HNSCC, p21 levels strongly correlate with mTORC1 activity but not with p53 status. Finally, clinical data indicate that HNSCC patients with p21 and phospho-S6-double-positive tumours present a better disease-specific survival. We conclude that over-activation of the mTORC1/4E-BP1/p21 pathway is a frequent and clinically relevant alteration in HNSCC.


Figures

Figure 1
Figure 1. mTORC1 activation promotes senescence in MEFs concomitant with p53-independent induction of p21.
(a) Representative images illustrating β-galactosidase activity in MEFs infected with scramble or TSC2 shRNAs (top left panel). Scale bar, 100 μm. Average quantification of four (n=4) independent experiments±s.d. (bottom left panel). Statistical t-test analysis was performed to calculate significance (***P≤0.005). Western blotting analysis of protein levels in scramble and TSC2-depleted MEFs (right panel). (b) Western blot depicting changes in protein levels in primary fibroblasts following infection with TSC2 shRNA, HRasV12 or control viruses. (c) Western blot analysis of protein expression levels in WT MEFs and p53KO MEFs infected with scramble or TSC2 shRNAs lentiviruses. (d) β-Galactosidase activity in WT and p21KO MEFs following infection with scramble or TSC2 shRNAs lentiviruses. Data corresponds to the average of two (n=2) independent infections±s.d. Statistical t-test analysis was performed to calculate significance (**P≤0.05). For each panel, all the western blots correspond to samples from the same experiment; in some cases, samples were distributed in several electrophoretic gels run in parallel.
Figure 2
Figure 2. TSC2 depletion upregulates exogenous p21 levels and increases p21 half-life.
(a) Representative western blot showing p21 levels in MEFs co-infected with pBabe-p21 retrovirus and either control or TSC2 shRNAs retroviruses. (b) Western blot analysis of p21 levels in scramble or TSC2 shRNA-expressing MEFs following incubation with 10 μM cyclohexamide (CHX) for the indicated times (top). Densitometric quantification of p21 levels corrected by loading control (bottom). (c) Western blot showing exogenous mouse p21 levels in the presence or absence of the proteasomal inhibitor MG132. (d) WT and p53KO MEFs were infected with either scramble or TSC2 shRNAs lentiviruses. Following selection, the cells were incubated for 8 h in the presence or absence of the proteasome inhibitor MG132. The p21 immunoblot of p53KO MEFs (right panel) is overexposed compared with WT MEFs (left panel). For each panel, all the western blots correspond to samples from the same experiment; in some cases, samples were distributed in several electrophoretic gels run in parallel.
Figure 3
Figure 3. mTORC1-mediated upregulation of p21 requires 4E-BP1 phosphorylation.
(a) Effect of mTOR inhibitors torin-1 (250 nM) and rapamycin (100 nM) on p21 levels in different cell lines. Cells were treated for 24 h with the indicated drugs and protein levels were subsequently analysed by western blot. (b) Protein levels in MEFs infected simultaneously with lentiviruses expressing either scramble or TSC2 shRNAs together with control or 4E-BP1-4A. (c) Protein levels in U2OS, HCT116 and 293T cells transfected with 4E-BP1-4A mutant alone (U2OS and HCT116 cells) or in combination with pBabe-p21 plasmid (293T cells). (d) Western blot depicting protein levels in MEFs following co-infection with lentiviruses expressing the indicated shRNAs. (e) Primary MEFs were infected with lentiviruses expressing scramble, TSC2 or eIF4E shRNAs in combination with control or 4E-BP1-4A. Protein levels were measured by immunoblotting. For each panel, all the western blots correspond to samples from the same experiment; in some cases, samples were distributed in several electrophoretic gels run in parallel.
Figure 4
Figure 4. p21 interacts with non-phosphorylated 4E-BP1.
(a) p21 was immunoprecipitated from WT MEFs untreated of treated with torin-1 (250 nM) for 6 hours in the presence of MG132 (25 μM). Inputs and co-inmunoprecipitated proteins were analysed by western blot. (b) 293T cells were transfected with 4E-BP1-4A and flag-p21 plasmids. Cell lysates were immunoprecipitated with either anti-4E-BP1 or anti-flag antibodies following incubation with MG132 (25 μM) for 5 h. Inputs and co-immunoprecipitated proteins were analysed by western blot. (c) HCT116-expressing Tet-On-inducible 4E-BP1 mutants were treated with doxycycline (1 μg ml−1) for 24 h. Cell lysates were immunoprecipitated with anti-p21 antibodies and subjected to immunoblot analysis. (d) Model for mTORC1/4E-BP1-mediated regulation of p21: Non-phosphorylated 4E-BP1 binds to p21 and promotes p21 degradation. 4E-BP1 phosphorylation by mTORC1 disrupt the 4E-BP1/p21 complex ensuing p21 accumulation. 4E-BP1 regulates p21 independently of its interaction with the the translation initiation factor eIF4E. For each panel, all the western blots correspond to samples from the same experiment; in some cases, samples were distributed in several electrophoretic gels run in parallel.
Figure 5
Figure 5. mTORC1/4E-BP1 regulates p21 expression in HNSCC.
(a) Graphical representation of the IHC data to correlate p21 and p53 expression (left) or p21 and P-S6 expression (S240/244; right; see also Supplementary Tables 2 and 3). Statistical significance was calculated using the Fisher exact test (two-sided). (b) Representative sections from HNSCC tissue samples depicting the IHC detection of p21 and P-S6 (S240/244). Scale bar, 200 μm. (c) Western blot analysis of p21 and TSC2 protein levels in HNSCC cell lines infected with scramble or TSC2 shRNAs lentiviruses. (d) Western blot analysis of p21 protein levels in HCT116 cells co-transfected with p21-flag- and Rheb64L-GFP-expressing plasmids. (e) Western blot analysis of p21 levels in scramble or TSC2 shRNA-expressing UT-SCC-42B cells following incubation with 10 μM cyclohexamide (CHX) for the indicated times (left). Densitometric quantification of p21 levels corrected by the loading control (right). For each panel, all the western blots correspond to samples from the same experiment; in some cases, samples were distributed in several electrophoretic gels run in parallel.
Figure 6
Figure 6. p21 and P-S6 protein expression correlates with improved survival in HNSCC patients.
(a) Kaplan–Meier disease-specific survival curves categorized by p21. (b) Kaplan–Meier disease-specific survival curves categorized by P-S6 (240/244). (c) Kaplan–Meier disease-specific survival curves categorized by p21 and P-S6 (240/244). (d) Kaplan–Meier disease-specific survival curves of patients without regional lymph node affection at the time of diagnosis (N0) categorized by p21 and P-S6 (240/244). (e) Graphical representation of the IHC data to correlate p21+/P-S6+-double-positive phenotype and disease recurrence (left) or distant metastasis (right) (see also Supplementary Tables 6 and 7). For ad, statistical significance was calculated using the log-rank test. For e, statistical significance was calculated using the Fisher exact test (two-sided).

Similar articles

Cited by

References

    1. Abbas T. & Dutta A. p21 in cancer: intricate networks and multiple activities. Nat. Rev. Cancer 9, 400–414 (2009). - PMC - PubMed
    1. Warfel N. A. & El-Deiry W. S. p21WAF1 and tumourigenesis: 20 years after. Curr. Opin. Oncol. 25, 52–58 (2013). - PubMed
    1. Jung Y.-S., Qian Y. & Chen X. Examination of the expanding pathways for the regulation of p21 expression and activity. Cell Signal. 22, 1003–1012 (2010). - PMC - PubMed
    1. Zoncu R., Efeyan A. & Sabatini D. M. mTOR: from growth signal integration to cancer, diabetes and ageing. Nat. Rev. Mol. Cell Biol. 12, 21–35 (2011). - PMC - PubMed
    1. Laplante M. & Sabatini D. M. mTOR signaling in growth control and disease. Cell 149, 274–293 (2012). - PMC - PubMed

Publication types

MeSH terms

Substances