. 2016 Jan 22;12(1):e1005405.
doi: 10.1371/journal.ppat.1005405. eCollection 2016 Jan.

A Viral microRNA Cluster Regulates the Expression of PTEN, p27 and of a bcl-2 Homolog

Affiliations

A Viral microRNA Cluster Regulates the Expression of PTEN, p27 and of a bcl-2 Homolog

Katharina Bernhardt et al. PLoS Pathog. .

Abstract

The Epstein-Barr virus (EBV) infects and transforms B-lymphocytes with high efficiency. This process requires expression of the viral latent proteins and of the 3 miR-BHRF1 microRNAs. Here we show that B-cells infected by a virus that lacks these non-coding RNAs (Δ123) grew more slowly between day 5 and day 20, relative to wild type controls. This effect could be ascribed to a reduced S phase entry combined with a moderately increased apoptosis rate. Whilst the first phenotypic trait was consistent with an enhanced PTEN expression in B-cells infected with Δ123, the second could be explained by very low BHRF1 protein and RNA levels in the same cells. Indeed, B-cells infected either by a recombinant virus that lacks the BHRF1 protein, a viral bcl-2 homolog, or by Δ123 underwent a similar degree of apoptosis, whereas knockouts of both BHRF1 microRNAs and protein proved transformation-incompetent. We find that that the miR-BHRF1-3 seed regions, and to a lesser extent those of miR-BHRF1-2 mediate these stimulatory effects. After this critical period, B-cells infected with the Δ123 mutant recovered a normal growth rate and became more resistant to provoked apoptosis. This resulted from an enhanced BHRF1 protein expression relative to cells infected with wild type viruses and correlated with decreased p27 expression, two pro-oncogenic events. The upregulation of BHRF1 can be explained by the observation that large BHRF1 mRNAs are the source of BHRF1 protein but are destroyed following BHRF1 microRNA processing, in particular of miR-BHRF1-2. The BHRF1 microRNAs are unlikely to directly target p27 but their absence may facilitate the selection of B-cells that express low levels of this protein. Thus, the BHRF1 microRNAs allowed a time-restricted expression of the BHRF1 protein to innocuously expand the virus B-cell reservoir during the first weeks post-infection without increasing long-term immune pressure.


Conflict of interest statement

The authors have declared that no competing interests exist.

Figures

Fig 1
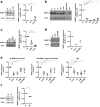
Fig 1. Phenotypic traits of B-cells infected with Δ123.
Primary B-cells were infected with B95-8 wild type (wt) or a recombinant virus lacking the three BHRF1 miRNAs (Δ123) and monitored between day 3 and 34 after infection. The mitotic rate was analyzed by immunofluorescence staining of phospho-histone H3 (PH3) (a), or Hoechst 33258 staining of DNA combined with a Centrin-2 (Cy3) and α-tubulin (Alexa488) double staining (b). BrdU incorporation assays were performed at day 13 to compare the cell cycle distribution of B-cells transformed with wt virus or the Δ123 mutant (c). The adjacent 2 graphs give the percentage of cells present in the different phases of the cell cycle as well as the ratio of cells in the G2/M and in the S phase, based on the results of the BrdU assay performed on three blood samples. We determined the degree of apoptosis in infected B-lymphocytes by immunofluorescence staining of active caspase 3 (d) or using a TUNEL assay at the indicated time points after infection (e). All experiments were repeated with cells from three different B-cell donors.
Fig 2
Fig 2. B-cells freshly infected with EBV strongly express BHRF1.
(a) B-cells were infected with EBV wild type or the miR-BHRF1-negative virus (Δ123) and harvested at the indicated time points post-infection for immunoblotting with a BHRF1-specific antibody. Actin served as a loading control. The EBV negative Elijah BL cell line and the Wp-restricted Oku-BL served as negative and positive controls for BHRF1 expression, respectively. Actin levels in the two BL lines were repeatedly found to be lower than in LCLs, although the same amount of total protein was loaded for each sample. The right panel shows an ImageJ-based quantification of BHRF1 protein expression normalized for actin with a close-up view on day 18 p.i. Protein expression is shown relative to BHRF1 levels in the LCL transformed by wt EBV at day 1 post-infection. Results of two independent infections with unrelated B-cell samples are shown. (b) The picture shows a northern blot analysis of LCLs generated with wild type virus or Δ123 at day 5 or 60 post-infection (dpi). The blots were hybridized with three probes that span the open reading frame (ORF) BHRF1 gene, its 3’UTR and its intron. The exposure times are indicated below the blots (c) Three B-cell samples from independent donors infected with wild type EBV or Δ123 were collected at day 5, 12, 36 and 60 post-infection. The graph shows the evolution of the BHRF1 RNA expression levels in these cells over time.
Fig 3
Fig 3. The reduced BHRF1 expression in B-cells infected with Δ123 leads to a moderately increased apoptosis.
Primary B-cells were infected with wild type, Δ123, ΔBHRF1 or Δ123ΔBHRF1 and monitored over time by immunofluorescence staining of active caspase 3 (a), by TUNEL assay (b), and by phospho-histone H3 staining (PH3) (c). Two out of five blood samples are shown. BrdU incorporation on day 14 was determined in B-cells transformed with wild type, Δ123, ΔBHRF1 and Δ123ΔBHRF1 (d). The results obtained with two samples are shown. Transformation assays were performed by infecting primary B-cells with 0.01 infectious virus per cell. 500 cells per well were seeded on 96-well cluster plates coated with 50Gy irradiated WI38 feeder cells and the number of wells with LCL outgrowth was determined 30 days after infection (e).
Fig 4
Fig 4. miR-BHRF1-3 and miR-BHRF1-2 stimulate BHRF1 transcription and translation early after infection.
BHRF1 protein expression at day 5 after infection of primary B-cells was determined by western blotting for cells infected with wild type, Δ123 and Δ1 (a), Δ2, Δ3, and Δ23 (b), 3SM and ΔBHRF1 (c), and 2/2*DSM (d). The figure shows a representative western blot and the adjacent graphs relative intensities of the obtained signals after quantification with ImageJ. (e) BHRF1 and Wp-driven transcripts were quantified by qPCR 5 days after B-cell infection with wt, Δ123, Δ3, 2/2*DSM and 3SM. The graph gives the results relative to values observed in cells infected with the wild type virus. (f) BHRF1 expression in cells infected with a replication-incompetent ΔZ mutant. One representative blot is shown together with the ImageJ-based quantification of multiple B-cell donors. The results are given as a ratio of signals recorded for LCLs infected with the mutant and the wt virus and are normalized for differences in actin expression.
Fig 5
Fig 5. The BHRF1 miRNA negatively regulates PTEN expression.
(a) The miR-BHRF1-3 target site in the PTEN 3’UTR according to a PAR-CLIP assay is shown (Skalsky et al.). (b) Primary B-cells were infected with B95-8 wild type (wt) or with the Δ123 recombinant and harvested at the indicated time points after infection for immunoblotting with a PTEN-specific antibody. Actin served as a loading control. Exactly the same amounts of Elijah and Oku-BL extracts were loaded on both gels to allow comparison of signal intensity between the two blots. The right panel shows the ImageJ-based quantification of the PTEN protein levels over time, normalized for differences in actin levels and signals obtained with Elijah and Oku-BL. PTEN expression in LCLs transformed by wt EBV, miR-BHRF1-3 (Δ3) single knockout (c), or 3SM (d). Actin served as a loading control. The right panels show the ImageJ-based quantification of PTEN expression for multiple blood samples. All values were normalized for differences in actin levels. (e) Luciferase assays performed with the PTEN 3’UTR or a seed-match mutant thereof by transfection of an expression plasmid that drives miR-BHRF1-3 expression or an empty pcDNA3.1 negative control. The results of three transfections are given relative to the luciferase activity signals recorded with the negative control. (f) 14 days old B-cells from two donors transformed with wild type EBV were treated for 24h with the PI3K inhibitor wortmannin (10nM) or the solvent DMSO. The cell cycle profile was determined by BrdU incorporation and quantified by FACS analysis. The results obtained with one B-cell primary sample are shown. This right panel depicts the ratio of cells present in the G2/M phase and in the S phase determined for two donors.
Fig 6
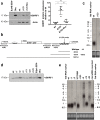
Fig 6. miR-BHRF1-2 downregulates the BHRF1 protein in established LCLs.
(a) Western blot with a BHRF1-specific antibody performed on LCLs established from a primary B-cell sample infected with B95-8 wt, Δ123 or the Δ123 revertant virus (Δ123 Rev) virus and tested 2 months after infection. Actin served as a loading control. The EBV negative BJAB BL and the Wp-restricted Oku-BL served as negative and positive control for BHRF1 protein expression, respectively. The right panel shows the ImageJ-quantified BHRF1 protein expression in four donors 2 months after infection, normalized for differences in actin expression. (b) This schematic describes the BHRF1 locus and gives the length of the different BHRF1 RNA species that would arise from Drosha-mediated processing of the different miRNAs. The sizes are given exclusive of the polyA tails. (c) 1.5μg polyA+ RNA extracted from wild type- or Δ123-transformed LCLs was analyzed by northern blotting 45 days after infection. The blot was hybridized with a probe specific for the 3’UTR of BHRF1 downstream of miR-BHRF1-3, shown in (c). The bottom panel shows the agarose gel stained with ethidium bromide. (d) BHRF1 protein expression in LCLs 45 days after infection with a panel of viruses lacking one or several BHRF1 miRNAs was determined by western blotting. (e) 1.5μg polyA+ RNA was isolated from LCLs generated from one primary B-cell sample by infection with B95-8 wild type or the different single and double miR-BHRF1 knockout viruses. The northern blot was hybridized with a probe specific to the 3’UTR of BHRF1 downstream of miR-BHRF1-3, as depicted in (c).
Fig 7
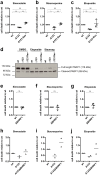
Fig 7. LCLs established with Δ123 are more resistant to apoptosis.
Established, 2–3 months old LCLs transformed with wild type, Δ123, or the Δ123 revertant were treated with different apoptosis-inducing agents or the respective solvent control. Cell samples were stained with Annexin-V and 7AAD and the number of apoptotic cells was determined by FACS and normalized for the percentage of dying cells in the respective solvent-treated control samples. Three LCLs established from different buffy coats were tested for each experiment. The cell death rate of the tested samples is given as its ratio with the death rate of samples infected with the wild type virus. (a) LCLs were treated 5 days with simvastatin (2μM) or EtOH as solvent control. (b) LCLs were treated with staurosporine (4μg/ml) or DMSO as solvent control for 20hrs. (c) LCLs were treated with etoposide (4μg/ml) or DMSO as solvent control for 20 hrs. (d) PARP western blot of one triplet of LCLs is shown after 20 hrs of treatment with etoposide, staurosporine or DMSO as solvent control. The same experiment was repeated for LCLs established from 4 different buffy coats generated by infection with wild type, Δ123, ΔBHRF1 (e, f, g) or from 2 additional samples infected with the wild type or Δ123ΔBHRF1 (h, i, j). Cell death rates were assessed after treatment with simvastatin (e and h), staurosporine (f and i), or etoposide (g and j).
Fig 8
Fig 8. p27 expression in B-cells infected with Δ123.
(a) We performed a BrdU incorporation assay with LCLs transformed by wild type or Δ123 viruses. The figure shows the results of the FACS analysis two months after infection. (b) 2 months-old cells infected with wild type or the Δ123 virus were brought to a concentration of 3x10⁵ cells per ml and the increase in cell numbers was determined by counting trypan blue-negative cells 24 and 48 hours thereafter. The growth rate is given relative to initial cell numbers. The growth kinetics of four donors were determined twice in independent experiments. (c) Western blot for PTEN expression from one representative donor infected with B95-8 wt or B95-8 Δ123. LCLs were analyzed 2.5 months after their establishment. Actin served as a loading control. ImageJ quantified PTEN expression in three donors 2.5 month after infection is shown in the right panel. All values were normalized for differences in actin expression. (d) We measured p27 expression in seven 2–3 months old LCLs established with wild type EBV or with Δ123 using a western blot analysis. The left panel shows one example; the right panel gives the results of ImageJ-based quantification for all tested donors. The individual values were normalized for differences in actin levels and p27 levels are depicted relative to the respective wild type control. (e) p27 expression was monitored between day 1 and 18 after infection of primary B-cells with wild type or Δ123 viruses. Actin served as a loading control. The right panel depicts the ImageJ-based quantification of the p27 protein levels normalized for differences in actin expression.

Similar articles

Cited by

References

    1. Zur Hausen H. The search for infectious causes of human cancers: where and why. Virology. 2009;392(1):1–10. 10.1016/j.virol.2009.06.001 - DOI - PubMed
    1. Rickinson AB, Kieff ED. Epstein-Barr virus In: Knipe DM, Howley PM, editors. Fields Virology Fifth Edition. 2. 5th ed. Philadelphia: Lippinkott Williams & Wilkins; 2007. p. 2655–700.
    1. Delecluse HJ, Feederle R, O'Sullivan B, Taniere P. Epstein Barr virus-associated tumours: an update for the attention of the working pathologist. J Clin Pathol. 2007;60(12):1358–64. Epub 2007/09/18. 10.1136/jcp.2006.044586 - DOI - PMC - PubMed
    1. Seto E, Moosmann A, Gromminger S, Walz N, Grundhoff A, Hammerschmidt W. Micro RNAs of Epstein-Barr virus promote cell cycle progression and prevent apoptosis of primary human B cells. PLoS Pathog. 2010;6(8):e1001063 Epub 2010/09/03. 10.1371/journal.ppat.1001063 - DOI - PMC - PubMed
    1. Feederle R, Linnstaedt SD, Bannert H, Lips H, Bencun M, Cullen BR, et al. A viral microRNA cluster strongly potentiates the transforming properties of a human herpesvirus. PLoS Pathog. 2011;7(2):e1001294 Epub 2011/03/08. 10.1371/journal.ppat.1001294 - DOI - PMC - PubMed

Publication types

MeSH terms

Grants and funding

The study was funded by the German Cancer Research Center and Inserm. The funders had no role in study design, data collection and analysis, decision to publish, or preparation of the manuscript.