

Pulmonary Epithelial Cell-Derived Cytokine TGF-β1 Is a Critical Cofactor for Enhanced Innate Lymphoid Cell Function
- PMID: 26588780
- PMCID: PMC4658339
- DOI: 10.1016/j.immuni.2015.10.012
Pulmonary Epithelial Cell-Derived Cytokine TGF-β1 Is a Critical Cofactor for Enhanced Innate Lymphoid Cell Function
Abstract
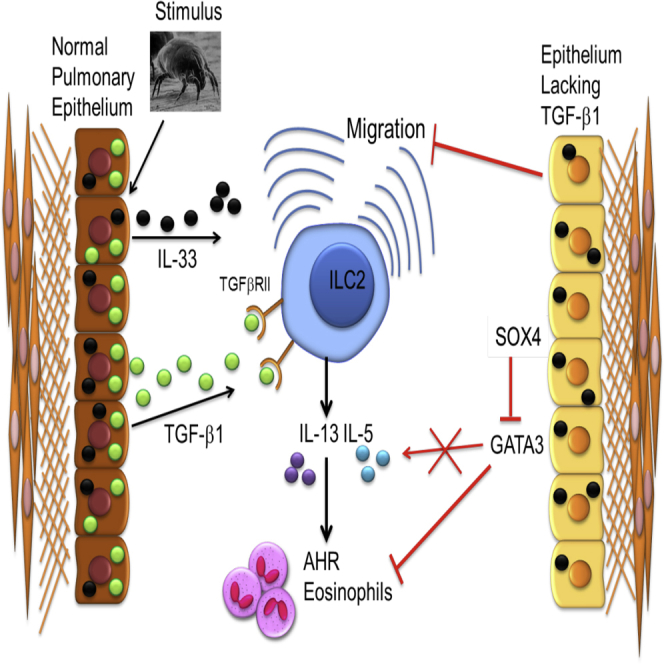
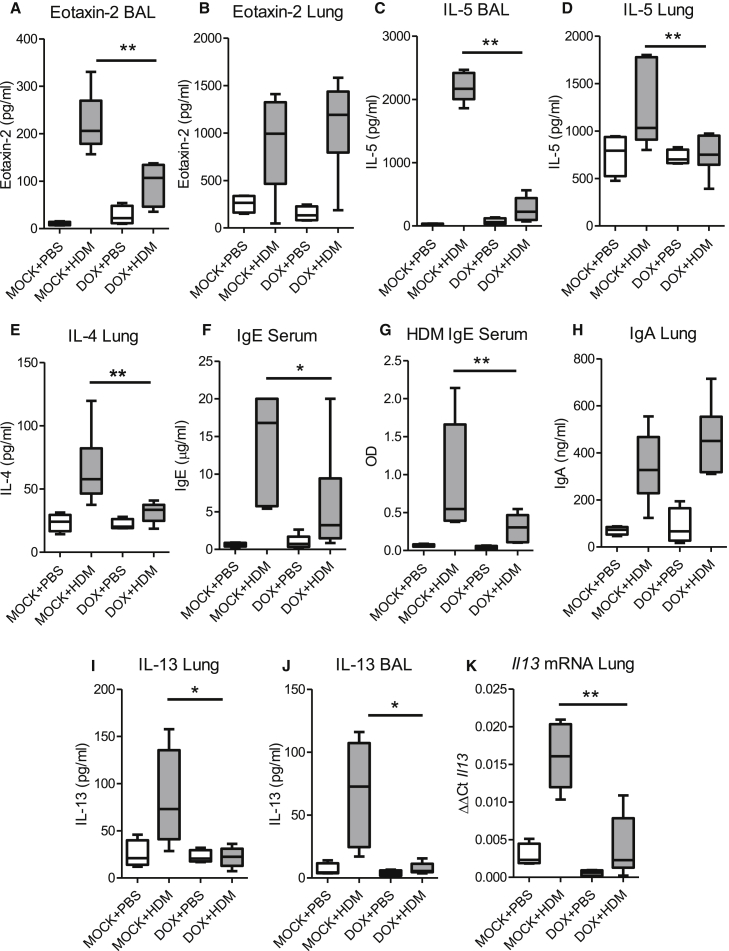
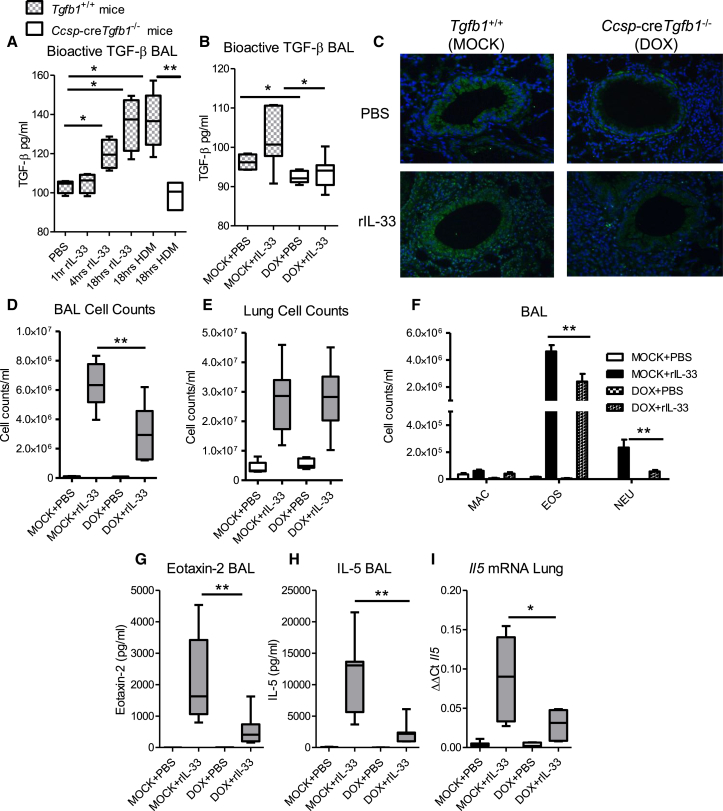
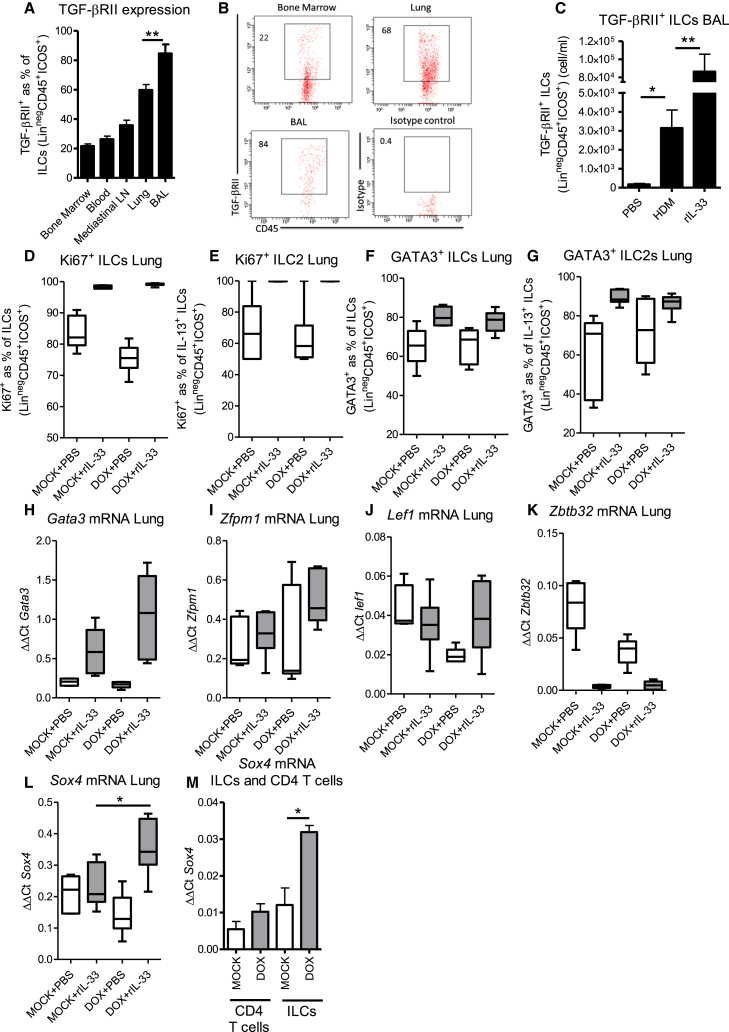
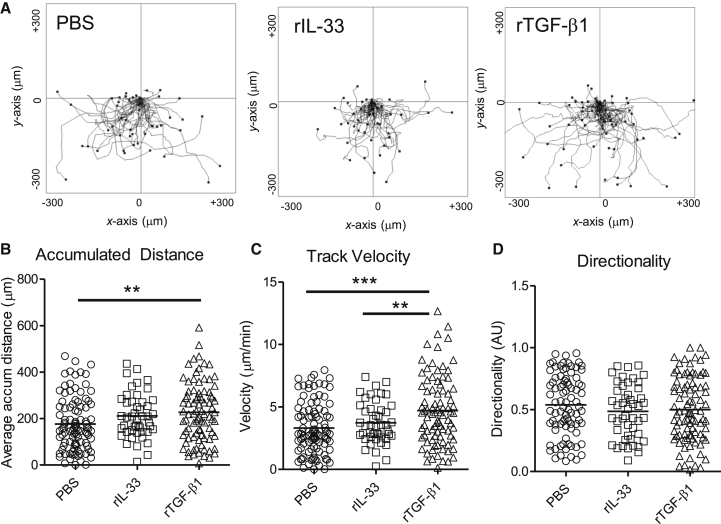
Epithelial cells orchestrate pulmonary homeostasis and pathogen defense and play a crucial role in the initiation of allergic immune responses. Maintaining the balance between homeostasis and inappropriate immune activation and associated pathology is particularly complex at mucosal sites that are exposed to billions of potentially antigenic particles daily. We demonstrated that epithelial cell-derived cytokine TGF-β had a central role in the generation of the pulmonary immune response. Mice that specifically lacked epithelial cell-derived TGF-β1 displayed a reduction in type 2 innate lymphoid cells (ILCs), resulting in suppression of interleukin-13 and hallmark features of the allergic response including airway hyperreactivity. ILCs in the airway lumen were primed to respond to TGF-β by expressing the receptor TGF-βRII and ILC chemoactivity was enhanced by TGF-β. These data demonstrate that resident epithelial cells instruct immune cells, highlighting the central role of the local environmental niche in defining the nature and magnitude of immune reactions.
Copyright © 2015 The Authors. Published by Elsevier Inc. All rights reserved.
Figures


Similar articles
-
Krüppel-like factor KLF10 regulates transforming growth factor receptor II expression and TGF-β signaling in CD8+ T lymphocytes.Am J Physiol Cell Physiol. 2015 Mar 1;308(5):C362-71. doi: 10.1152/ajpcell.00262.2014. Epub 2014 Dec 3. Am J Physiol Cell Physiol. 2015. PMID: 25472963 Free PMC article.
-
Surfactant protein D attenuates sub-epithelial fibrosis in allergic airways disease through TGF-β.Respir Res. 2014 Nov 29;15(1):143. doi: 10.1186/s12931-014-0143-9. Respir Res. 2014. PMID: 25472740 Free PMC article.
-
Airway macrophage-intrinsic TGF-β1 regulates pulmonary immunity during early-life allergen exposure.J Allergy Clin Immunol. 2021 May;147(5):1892-1906. doi: 10.1016/j.jaci.2021.01.026. Epub 2021 Feb 9. J Allergy Clin Immunol. 2021. PMID: 33571538 Free PMC article.
-
The Influence of Innate Lymphoid Cells and Unconventional T Cells in Chronic Inflammatory Lung Disease.Front Immunol. 2019 Jul 11;10:1597. doi: 10.3389/fimmu.2019.01597. eCollection 2019. Front Immunol. 2019. PMID: 31354734 Free PMC article. Review.
-
Innate Lymphoid Cell-Epithelial Cell Modules Sustain Intestinal Homeostasis.Immunity. 2020 Mar 17;52(3):452-463. doi: 10.1016/j.immuni.2020.02.016. Immunity. 2020. PMID: 32187516 Review.
Cited by
-
On-Target Anti-TGF-β Therapies Are Not Succeeding in Clinical Cancer Treatments: What Are Remaining Challenges?Front Cell Dev Biol. 2020 Jul 8;8:605. doi: 10.3389/fcell.2020.00605. eCollection 2020. Front Cell Dev Biol. 2020. PMID: 32733895 Free PMC article. Review.
-
TGF-β induces ST2 and programs ILC2 development.Nat Commun. 2020 Jan 7;11(1):35. doi: 10.1038/s41467-019-13734-w. Nat Commun. 2020. PMID: 31911623 Free PMC article.
-
Target the Host, Kill the Bug; Targeting Host Respiratory Immunosuppressive Responses as a Novel Strategy to Improve Bacterial Clearance During Lung Infection.Front Immunol. 2020 Apr 30;11:767. doi: 10.3389/fimmu.2020.00767. eCollection 2020. Front Immunol. 2020. PMID: 32425944 Free PMC article. Review.
-
Functional Contribution and Targeted Migration of Group-2 Innate Lymphoid Cells in Inflammatory Lung Diseases: Being at the Right Place at the Right Time.Front Immunol. 2021 Jun 10;12:688879. doi: 10.3389/fimmu.2021.688879. eCollection 2021. Front Immunol. 2021. PMID: 34177944 Free PMC article. Review.
-
Effect of TGF-β1 on eosinophils to induce cysteinyl leukotriene E4 production in aspirin-exacerbated respiratory disease.PLoS One. 2021 Aug 26;16(8):e0256237. doi: 10.1371/journal.pone.0256237. eCollection 2021. PLoS One. 2021. PMID: 34437574 Free PMC article.
References
-
- Barlow J.L., Peel S., Fox J., Panova V., Hardman C.S., Camelo A., Bucks C., Wu X., Kane C.M., Neill D.R. IL-33 is more potent than IL-25 in provoking IL-13-producing nuocytes (type 2 innate lymphoid cells) and airway contraction. J. Allergy Clin. Immunol. 2013;132:933–941. - PubMed
-
- Castriconi R., Dondero A., Bellora F., Moretta L., Castellano A., Locatelli F., Corrias M.V., Moretta A., Bottino C. Neuroblastoma-derived TGF-β1 modulates the chemokine receptor repertoire of human resting NK cells. J. Immunol. 2013;190:5321–5328. - PubMed
Publication types
MeSH terms
Substances
Grants and funding
LinkOut - more resources
Full Text Sources
Other Literature Sources
Molecular Biology Databases
