. 2015 Nov 4;90(2):947-58.
doi: 10.1128/JVI.01932-15. Print 2016 Jan 15.

Induction of the Lytic Cycle Sensitizes Epstein-Barr Virus-Infected B Cells to NK Cell Killing That Is Counteracted by Virus-Mediated NK Cell Evasion Mechanisms in the Late Lytic Cycle

Affiliations

Induction of the Lytic Cycle Sensitizes Epstein-Barr Virus-Infected B Cells to NK Cell Killing That Is Counteracted by Virus-Mediated NK Cell Evasion Mechanisms in the Late Lytic Cycle

Luke R Williams et al. J Virol. .

Abstract

Epstein-Barr Virus (EBV) persists for the lifetime of the infected host despite eliciting strong immune responses. This persistence requires a fine balance between the host immune system and EBV immune evasion. Accumulating evidence suggests an important role for natural killer (NK) cells in this balance. NK cells can kill EBV-infected cells undergoing lytic replication in vitro, and studies in both humans and mice with reconstituted human immune systems have shown that NK cells can limit EBV replication and prevent infectious mononucleosis. We now show that NK cells, via NKG2D and DNAM-1 interactions, recognize and kill EBV-infected cells undergoing lytic replication and that expression of a single EBV lytic gene, BZLF1, is sufficient to trigger sensitization to NK cell killing. We also present evidence suggesting the possibility of the existence of an as-yet-unidentified DNAM-1 ligand which may be particularly important for killing lytically infected normal B cells. Furthermore, while cells entering the lytic cycle become sensitized to NK cell killing, we observed that cells in the late lytic cycle are highly resistant. We identified expression of the vBcl-2 protein, BHRF1, as one effective mechanism by which EBV mediates this protection. Thus, contrary to the view expressed in some reports, EBV has evolved the ability to evade NK cell responses.

Importance: This report extends our understanding of the interaction between EBV and host innate responses. It provides the first evidence that the susceptibility to NK cell lysis of EBV-infected B cells undergoing lytic replication is dependent upon the phase of the lytic cycle. Induction of the lytic cycle is associated with acquired sensitization to NK cell killing, while progress through the late lytic cycle is associated with acquired resistance to killing. We provide mechanistic explanations for this novel observation, indicating important roles for the BZLF1 immediate early transactivator, the BHRF1 vBcl-2 homologue, and a novel ligand for the DNAM-1 NK cell receptor.


Figures

FIG 1
FIG 1
Activating receptor expression profiles of NK cell lines and primary NK cells. NKL, NK92, and two enriched primary NK cell lines were stained for NKG2D, DNAM-1, NKp30, and NKp46 surface expression and analyzed using flow cytometry. Solid black lines represent staining of each activating receptor, and gray-filled histograms represent the isotype control.
FIG 2
FIG 2
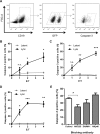
EBV-infected cells undergoing lytic infection are sensitive to NK cell killing. AKBM cells were induced into the lytic cycle and used as targets in 4-h cytotoxicity assays. (A) Cells were stained for CD19 to differentiate effector and target cells, and AKBM cells undergoing lytic infection were identified by GFP expression. Cells were stained for caspase-3 as a marker of NK cell-induced killing. (B to D) NK cell killing was measured in latent and lytic populations at increasing effector/target cell (E:T) ratios. Effector cells used were NKL cells (B), NK-92 cells (C), and freshly isolated NK cells (D). (E) NKL cells were incubated with blocking antibodies prior to use in cytotoxicity assays, and NK cell killing was measured in the lytic population of AKBM cells at an effector/target cell ratio of 4:1. Data shown are mean values from three separate experiments, error bars represent standard errors, and significance was determined using t tests (*, P < 0.05; **, P < 0.01; ***, P < 0.001).
FIG 3
FIG 3
EBV-infected cells in the late-stage lytic cycle are protected from NK cell killing. AKBM cells were induced into the lytic cycle and used as targets in 4-h cytotoxicity assays using NKL cells. (A) Cells were stained for BZLF1 and BcLF1 to differentiate cells in the latent (BZLF1 BcLF1), early lytic (BZLF1+ BcLF1), and late lytic (BZLF1+ BcLF1+) cycles. (B) Caspase-3 positivity was assayed in each of the three populations as a measure of NK cell killing. Data shown are mean values from three separate experiments, and error bars represent standard errors.
FIG 4
FIG 4
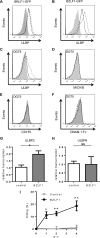
BZLF1 induces expression of NKG2D ligands and sensitizes B cells to NK cell killing. (A to F) HEK 293 cells (A and B) or DG75 cells (C to F) transiently expressing control-GFP (solid black line) and BRLF1-GFP (dashed black line) (A) or BZLF1-GFP (dashed black line) (B to F) were investigated for surface expression of NK cell-activating receptor ligands using flow cytometry. Gray-filled histograms represent isotype control staining. Results shown are representative of three separate experiments. (G and H) Total RNA was iso lated from control DG75 and BZLF1-expressing DG75 cells and then reverse transcribed to cDNA. Relative transcription levels of ULBP2 (G) and ULBP6 (H) were measured by qPCR assay, normalized to measured B2m transcripts. Data shown are mean values from three separate experiments, error bars represent standard errors, and significance was determined using t tests (*, P < 0.05; **, P < 0.01; ***, P < 0.001). (I) DG75 cells transfected with control or BZLF1 expression plasmids were used as targets in NK cell killing assays using NKL cells, and specific cytotoxicity was calculated.
FIG 5
FIG 5
Maximum expression levels of BHRF1 protein occur beyond 12 h postinduction of the lytic cycle. AKBM cells were induced into the lytic cycle by cross-linking of surface immunoglobulin. (A) Levels of BHRF1 (middle panel) and BZLF1 (upper panel) proteins were measured at the indicated time points postinduction using Western blot analysis. The level of calregulin (lower panel) was detected as a loading control. (B) Relative expression of BHRF1 protein was calculated using Bio-Rad Image Lab densitometry software and compared to that of the calregulin control at each time point.
FIG 6
FIG 6
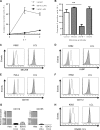
BHRF1 protects B cells from BZLF1-induced NK cell killing. DG75 cells were transduced with control- or BHRF1-NGFR-expressing retroviral vectors. (A) Following magnetic enrichment, cells were stained for expression of NGFR. Cells were then transfected with control- or BZLF1-GFP expression vectors. (B) Expression of BHRF1 (top panel) and BZLF1 (middle panel) proteins in the four different cell lines was determined by Western blot analysis. Calregulin expression (bottom panel) was measured as a loading control. (C) The four cell lines were then used as targets in killing assays using NKL cells at increasing effector/target cell ratios. Data shown are mean values from three separate experiments, and error bars represent standard errors. (D) Surface expression of ULBP was measured on DG75-control cells (gray-filled histograms), DG75-control cells expressing BZLF1 (solid black line), and DG75-BHRF1 cells expressing BZLF1 (dashed black line). Data shown are representative of three separate experiments. (E) The four DG75 cell lines mentioned above were cocultured with NKL cells and FITC-conjugated anti-CD107a antibody for 5 h. The surface CD107a expression of NKL cells from four cultures was analyzed by flow cytometry. Data shown are mean values from three separate experiments, and error bars represent standard errors. The significance was determined using one-way ANOVA tests (*, P < 0.05; **, P < 0.01).
FIG 7
FIG 7
LCLs are also protected from NK cell killing in the late-stage lytic cycle, but killing of cells in the early lytic cycle is mediated by DNAM-1. LCLs were screened for the presence of cells undergoing spontaneous lytic cycle and used as targets in 4-h cytotoxicity assays using NKL cells. Cells were stained for BZLF1 and BcLF1 to differentiate latent, early lytic, and late lytic cells and stained for caspase-3 as a marker of NK cell-induced killing. (A) NK cell killing was measured in the three populations at increasing effector/target cell ratios. (B) NKL cells were incubated with blocking antibodies prior to use in cytotoxicity assays and NK cell killing measured in the early lytic population of LCLs at an effector/target cell ratio of 4:1. Data shown are mean values from three separate experiments using four different LCLs, error bars represent standard errors, and significance was determined using t tests (**, P < 0.01). (C to F) LCLs were stained for BZLF1 to detect cells undergoing spontaneous lytic cycle, and levels of MICA/B (C), ULBP (D), CD155 (E), and CD112 (F) were measured by flow cytometry. Solid black lines represent BZLF (latent) cells, dashed black lines represent BZLF1+ (lytic) cells, and gray-filled histograms represent isotype control staining of bulk LCLs. HeLa cells were used as a positive control for CD155 expression (E), and K562 cells were used as a positive control for MICA/B, ULBP, and CD112 expression (C, D, and F). Results shown are representative of multiple separate experiments using multiple antibodies to CD155 and CD112. (G) Total RNA was isolated from LCLs and then reverse transcribed to cDNA. Relative transcription levels of CD112 and CD155 were measured by qPCR assay, normalized to measured B2m transcripts. The error bars represent standard errors for three different LCLs. HeLa cells served as a standard for relative transcription in this assay. (H) LCLs were stained for BZLF1 to detect cells undergoing spontaneous lytic cycle, and levels of DNAM-1 ligands were measured using DNAM-1-Fc fusion protein by flow cytometry. Solid black lines represent BZLF (latent) cells, dashed black lines represent BZLF1+ (lytic) cells, and gray-filled histograms represent isotype control staining of bulk LCLs. K562 cells were used as a positive control.

Similar articles

Cited by

References

    1. Longnecker R, Kieff E, Cohen J. 2013. Epstein-Barr Virus, p 1898–1959. In Knipe D, Howley P (ed), Fields virology. Lippincott Williams & Wilkins, Philadelphia, PA.
    1. Thorley-Lawson DA, Hawkins JB, Tracy SI, Shapiro M. 2013. The pathogenesis of Epstein-Barr virus persistent infection. Curr Opin Virol 3:227–232. doi:10.1016/j.coviro.2013.04.005. - DOI - PMC - PubMed
    1. Rickinson AB, Long HM, Palendira U, Munz C, Hislop AD. 2014. Cellular immune controls over Epstein-Barr virus infection: new lessons from the clinic and the laboratory. Trends Immunol 35:159–169. doi:10.1016/j.it.2014.01.003. - DOI - PubMed
    1. Balfour HH Jr, Odumade OA, Schmeling DO, Mullan BD, J Aed Knight JA, Vezina HE, Thomas W, Hogquist KA. 2013. Behavioral, virologic, and immunologic factors associated with acquisition and severity of primary Epstein-Barr virus infection in university students. J Infect Dis 207:80–88. doi:10.1093/infdis/jis646. - DOI - PMC - PubMed
    1. Williams H, McAulay K, Macsween KF, Gallacher NJ, Higgins CD, Harrison N, Swerdlow AJ, Crawford DH. 2005. The immune response to primary EBV infection: a role for natural killer cells. Br J Haematol 129:266–274. doi:10.1111/j.1365-2141.2005.05452.x. - DOI - PubMed

Publication types

Substances

LinkOut - more resources