. 2015 Nov 24;6(37):40310-26.
doi: 10.18632/oncotarget.5643.

Targeting the ROR1 and ROR2 receptors in epithelial ovarian cancer inhibits cell migration and invasion

Affiliations

Targeting the ROR1 and ROR2 receptors in epithelial ovarian cancer inhibits cell migration and invasion

Claire Henry et al. Oncotarget. .

Abstract

Aim: In recent years, the Wnt signalling pathway has been implicated in epithelial ovarian cancer and its members have potential as diagnostic, prognostic and therapeutic targets. Here we investigated the role of two Wnt receptor tyrosine kinases (RTKs), ROR1 and ROR2, and their putative ligand, Wnt5a, in ovarian cancer.

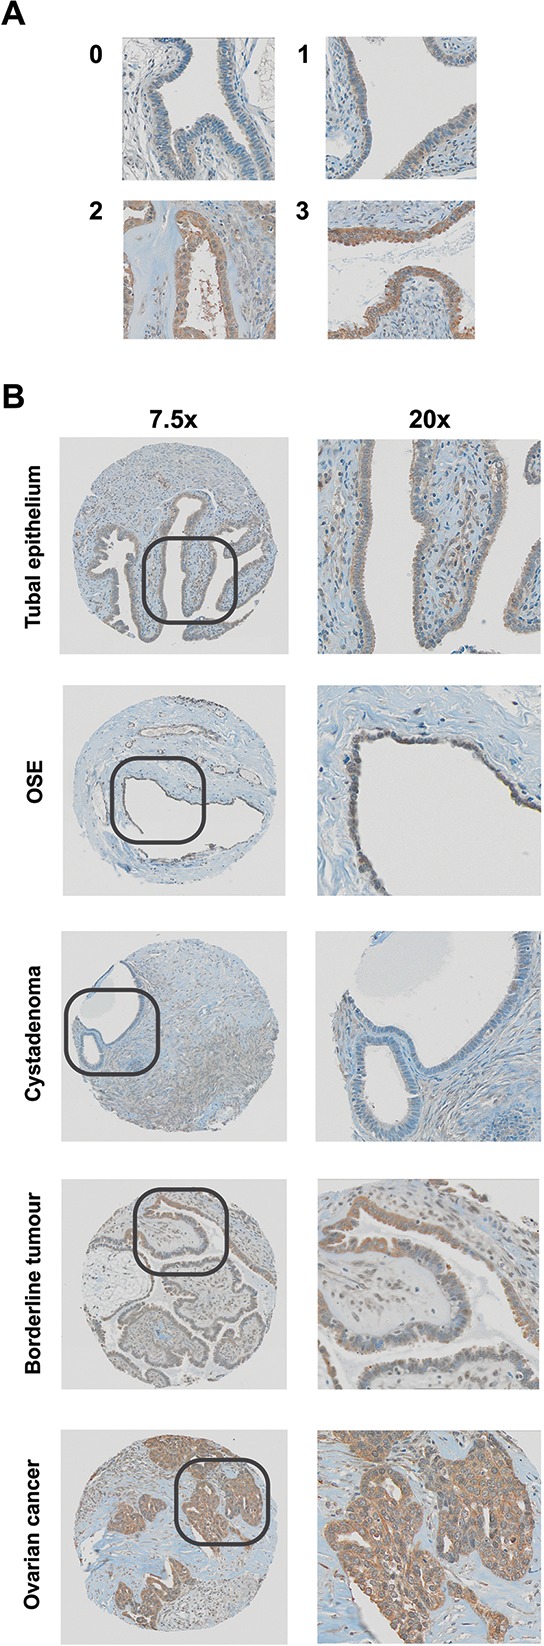
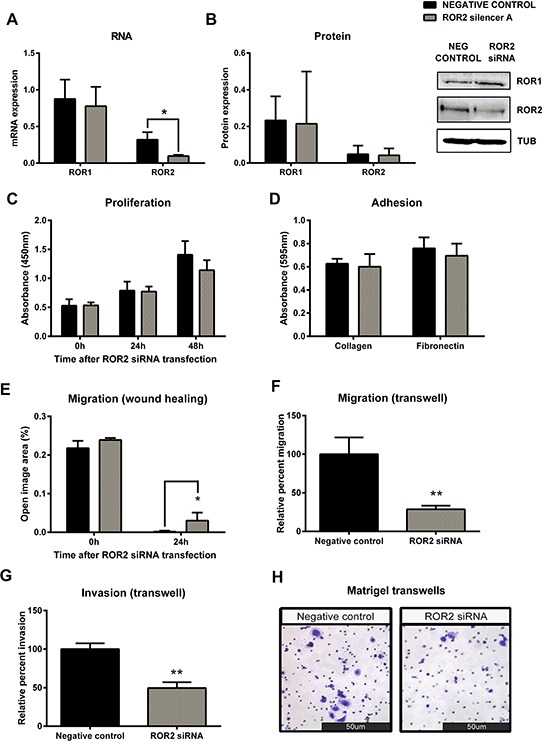
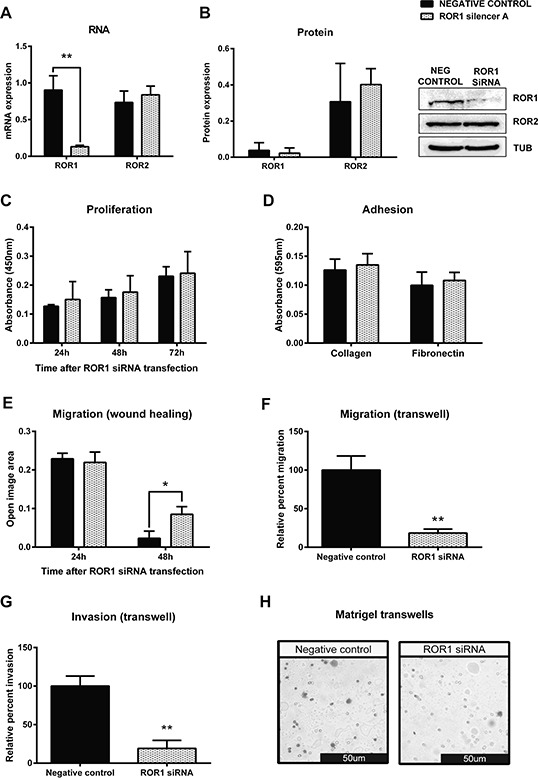
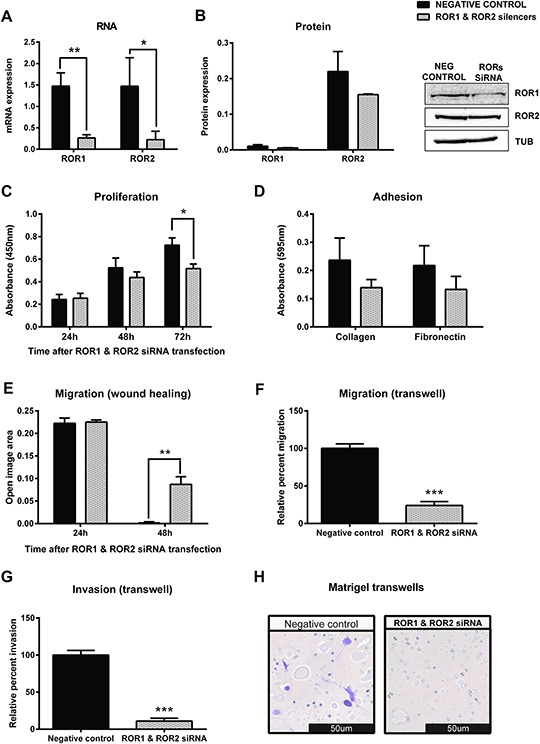
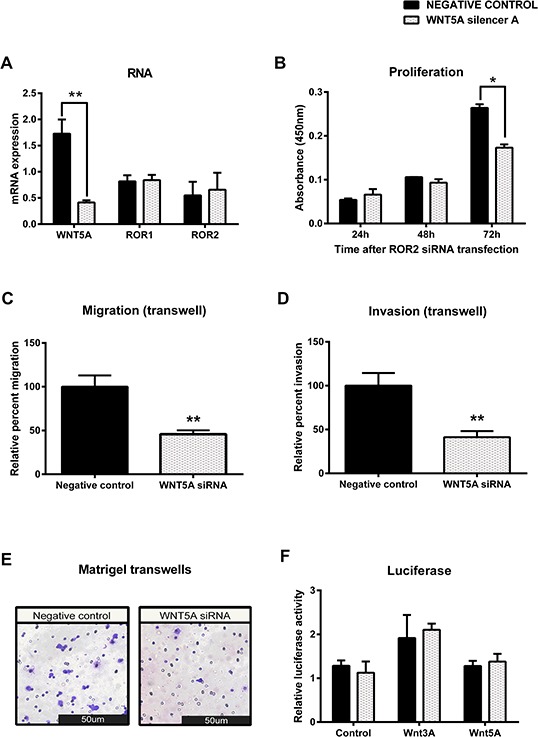
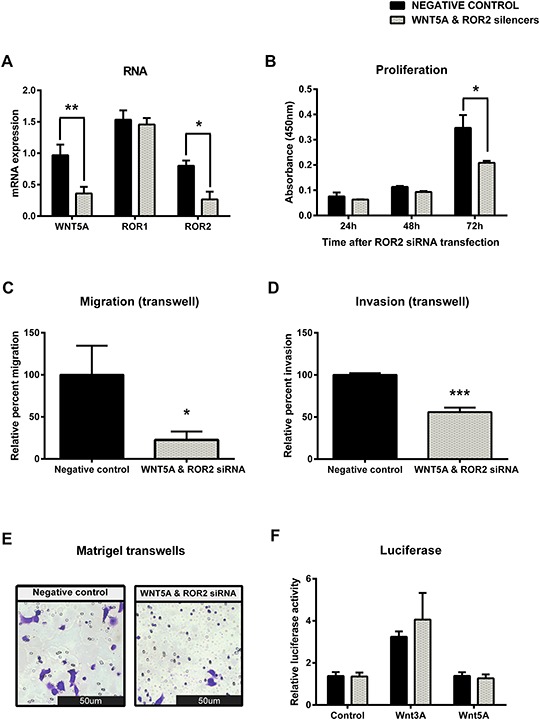
Methods: Immunohistochemistry for ROR2 was performed in a large patient cohort, including benign controls, borderline tumours and epithelial ovarian cancer. In addition, siRNA was used to silence ROR1, ROR2 and Wnt5a individually, and together, in two ovarian cancer cell lines, and the effects on cell proliferation, adhesion, migration and invasion were measured.

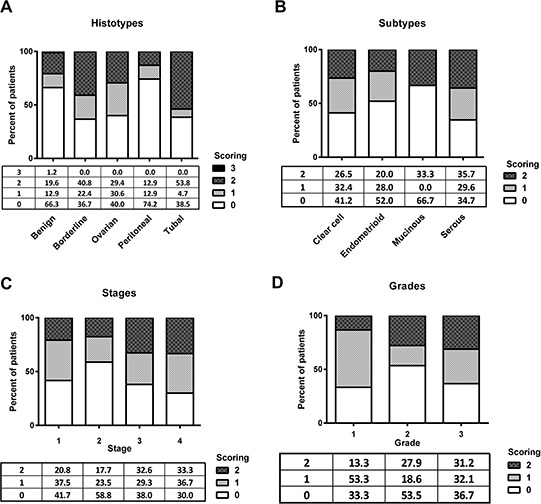
Results: ROR2 expression is significantly increased in ovarian cancer patients compared to patients with benign disease. In vitro assays showed that silencing either receptor inhibits ovarian cancer cell migration and invasion, and concurrently silencing both receptors has an even stronger inhibitory effect on proliferation, migration and invasion.

Conclusions: ROR2 expression is increased in epithelial ovarian cancer, and silencing ROR2 and its sister receptor ROR1 has a strong inhibitory effect on the ability of ovarian cancer cells to proliferate, migrate and invade through an extracellular matrix.

Keywords: ROR1; ROR2; Wnt signalling; epithelial ovarian cancer; metastasis.


Conflict of interest statement

CONFLICTS OF INTEREST

There is no conflict of interest to declare.

Figures

Figure 1
Figure 1. ROR2 protein expression as measured by immunohistochemistry
A. Representative staining at 0, 1, 2 and 3 intensity. B. Representative IHC staining in tubal epithelium, ovarian surface epithelium (OSE), cystadenoma, borderline, and ovarian cancer samples.
Figure 2
Figure 2. ROR2 expression is elevated in epithelial ovarian cancer
A. Expression of ROR2 in benign, borderline tumours, ovarian cancer, peritoneal cancer and tubal cancer patients, expressed as a percentage of total. B. ROR2 expression in ovarian cancer patients stratified by subtype. C. ROR2 expression in ovarian cancer patients stratified by stage. D. ROR2 expression in ovarian cancer patients stratified by grade.
Figure 3
Figure 3. Knockdown of ROR2 in serous ovarian cancer cells inhibits cell migration
A. ROR2 is decreased at the mRNA level following siRNA (A) induced knockdown in serous ovarian cancer (OVCAR3) cells. No effect on ROR1 mRNA level. qRT-PCR was performed in triplicate and normalised to three different housekeeping genes (SDHA, HSPCB, RPL13A). Results represent an average of four experiments. Error bars represent the s.d of the mean. **P < 0.01. B. Densitometric analysis of ROR1 and ROR2 protein levels from three separate experiments. Representative immunoblots showing ROR2 knockdown at the protein level in OVCAR3 cells. No effect on ROR1 protein level. Top panel: ROR1, middle panel: ROR2, bottom panel: α-tubulin. C. Cell proliferation is slightly decreased following ROR2 knockdown in OVCAR3 cells over a 48–72 hours period, but not significantly. Results represent the average of three independent experiments. Error bars represent the s.d of the mean. D. ROR2 knockdown has no effect on the adhesion of OVCAR3 cells to collagen or fibronectin. Results represent the average of 3 experiments. E. Cell migration performed using the wound healing assay is significantly decreased following ROR2 knockdown in OVCAR3 cells. Results represent an average of three experiments. Error bars represent the s.d of the mean. *P < 0.05. F. Relative cell migration performed using the transwell migration assay is significantly decreased following ROR2 knockdown in OVCAR3 cells. Results represent an average of three experiments. Error bars represent the s.d of the mean. **P < 0.01. G. Relative cell invasion performed using the matrigel pre coated transwell assay significantly decreased following ROR2 knockdown in OVCAR3 cells. Results represent the average of three experiments. Error bars represent the s.d of the mean. **P < 0.01. H. Representative picture of OVCAR3 cells invading matrigel over 48 hours.
Figure 4
Figure 4. Knockdown of ROR1 in serous ovarian cancer cells decreases migration
A. ROR1 is decreased at the mRNA level following ROR1 siRNA (A) induced knockdown in serous ovarian cancer (OVCAR3) cells. No effect on ROR2 mRNA level. qRT-PCR was performed in triplicate and normalised to three different housekeeping genes (SDHA, HSPCB, RPL13A). Results represent an average of three experiments. Error bars represent the s.d of the mean. **P < 0.01. B. Densitometric analysis of ROR1 and ROR2 protein levels from three separate experiments. Representative immunoblots showing ROR1 knockdown at the protein level in OVCAR3 cells. No effect on ROR2 protein level. Top panel: ROR1, middle panel: ROR2, bottom panel: α-tubulin. C. Cell proliferation does not change following ROR1 knockdown in OVCAR3 cells over a 48–72 hour period. Results represent the average of three independent experiments. Error bars represent the s.d of the mean. D. ROR1 knockdown has no effect on the adhesion of OVCAR3 cells to collagen or fibronectin. Results represent the average of 3 experiments and error bars represent the s.d of the mean. E. Cell migration performed using the wound healing assay decreases following ROR1 knockdown in OVCAR3 cells. Results represent an average of three experiments. Error bars represent the s.d of the mean. *P < 0.05. F. Relative cell migration performed using the transwell migration assay is significantly decreased following ROR1 knockdown in OVCAR3 cells. Results represent an average of three experiments. Error bars represent the s.d of the mean. **P < 0.01. G. Relative cell invasion performed using the matrigel pre coated transwell assay is significantly decreased following ROR1 knockdown in OVCAR3 cells. Results represent the average of three experiments. Error bars represent the s.d of the mean. **P < 0.01. H. Representative picture of OVCAR3 cells invading matrigel over 48 hours.
Figure 5
Figure 5. Simultaneous knockdown of ROR1 and ROR2 in serous ovarian cancer cells decreases migration and proliferation
A. ROR1 and ROR2 are decreased at the mRNA level following siRNA (A) induced knockdown in serous ovarian cancer (OVCAR3) cells. qRT-PCR was performed in triplicate and normalised to three different housekeeping genes (SDHA, HSPCB, RPL13A). Results represent an average of three experiments. Error bars represent the s.d of the mean. **P < 0.01, *P < 0.05. B. Densitometric analysis of ROR1 and ROR2 protein levels from three separate experiments. Representative immunoblots showing ROR1 and ROR2 knockdown at the protein level in OVCAR3 cells. Top panel: ROR1, middle panel: ROR2, bottom panel: α-tubulin. C. Cell proliferation decreases following ROR1 and ROR2 knockdown in OVCAR3 cells over a 48–72 hour period. Results represent the average of three independent experiments. Error bars represent the s.d of the mean. *P < 0.05. D. ROR1 and ROR2 knockdown may decrease the adhesion of OVCAR3 cells to collagen or fibronectin, but not significantly. Collagen p = 0.115, Fibronectin p = 0.155. Results represent the average of 3 experiments and error bars represent the s.d of the mean. E. Cell migration performed using the wound healing assay decreases following ROR1 and ROR2 knockdown in OVCAR3 cells. Results represent an average of three experiments. Error bars represent the s.d of the mean. **P < 0.01. F. Relative cell migration performed using the transwell migration assay is significantly decreased following ROR1 and ROR2 knockdown in OVCAR3 cells. Results represent an average of three experiments. Error bars represent the s.d of the mean. ***P < 0.001. G. Relative cell invasion performed using the matrigel pre coated transwell assay is significantly decreased following ROR1 and ROR2 knockdown in OVCAR3 cells. Results represent the average of three experiments. Error bars represent the s.d of the mean. ***P < 0.001. H. Representative picture of OVCAR3 cells invading matrigel over 48 hours.
Figure 6
Figure 6. Knockdown of WNT5A in serous ovarian cancer decreases migration and invasion
A. WNT5A is decreased at the mRNA level following siRNA (A) induced knockdown in serous ovarian cancer (OVCAR3) cells. No effect on ROR1 or ROR2 mRNA level. qRT-PCR was performed in triplicate and normalised to three different housekeeping genes (SDHA, HSPCB, RPL13A). Results represent an average of three experiments. Error bars represent the s.d of the mean. **P < 0.01. B. Cell proliferation decreases following WNT5A knockdown in OVCAR3 cells over a 48–72 hour period, however did not come to significance (P = 0.076). Results represent the average of three independent experiments. Error bars represent the s.d of the mean. C. Relative cell migration performed using the transwell migration assay is significantly decreased following WNT5A knockdown in OVCAR3 cells. Results represent an average of three experiments. Error bars represent the s.d of the mean. **P < 0.01. D. Relative cell invasion performed using the matrigel pre coated transwell assay is significantly decreased following WNT5A knockdown in OVCAR3 cells. Results represent the average of three experiments. Error bars represent the s.d of the mean. **P < 0.01. E. Representative picture of OVCAR3 cells invading matrigel over 48 hours. F. Luciferase assay determined no change in β-catenin dependent signalling after WNT5A knockdown in OVCAR3. Relative β-catenin driven transcription activity was calculated as a TOP/FOP ratio in triplicate wells. Results represent an average of three experiments. Error bars represent the s.d of the mean.
Figure 7
Figure 7. Simultaneous knockdown of WNT5A and ROR2 in serous ovarian cancer decreases proliferation, migration and invasion
A. WNT5A and ROR2 are decreased at the mRNA level following siRNA (A) induced knockdown in serous ovarian cancer (OVCAR3) cells. No effect on ROR1 mRNA level. qRT-PCR was performed in triplicate and normalised to three different housekeeping genes (SDHA, HSPCB, RPL13A). Results represent an average of three experiments. Error bars represent the s.d of the mean. *P < 0.05, **P < 0.01. B. Cell proliferation decreases following WNT5A and ROR2 knockdown in OVCAR3 cells after 72 hours. Results represent the average of three independent experiments. Error bars represent the s.d of the mean. *P < 0.05. C. Relative cell migration performed using the transwell migration assay is significantly decreased following WNT5A and ROR2 knockdown in OVCAR3 cells. Results represent an average of three experiments. Error bars represent the s.d of the mean. *P < 0.05. D. Relative cell invasion performed using the matrigel pre coated transwell assay is significantly decreased following WNT5A and ROR2 knockdown in OVCAR3 cells. Results represent the average of three experiments. Error bars represent the s.d of the mean. ***P < 0.001. E. Representative picture of OVCAR3 cells invading matrigel over 48 hours. F. Luciferase assay determined a slight non-significant increase in WNT3A stimulated β-catenin dependent signalling after WNT5A and ROR2 knockdown in OVCAR3. Relative β-catenin driven transcription activity was calculated as a TOP/FOP ratio in triplicate wells. Results represent an average of three experiments. Error bars represent the s.d of the mean.

Similar articles

Cited by

References

    1. The Cancer Genome Atlas Integrated genomic analyses of ovarian carcinoma. Nature. 2011;474:609–615. - PMC - PubMed
    1. Tothill RW, Tinker AV, George J, Brown R, Fox SB, Lade S, Johnson DS, Trivett MK, Etemadmoghadam D, Locandro B, Traficante N, Fereday S, Hung JA, Chiew YE, Haviv I, Australian Ovarian Cancer Study G et al. Novel molecular subtypes of serous and endometrioid ovarian cancer linked to clinical outcome. Clin Cancer Res. 2008;14:5198–5208. - PubMed
    1. Tan TZ, Miow QH, Huang RY, Wong MK, Ye J, Lau JA, Wu MC, Bin Abdul Hadi LH, Soong R, Choolani M, Davidson B, Nesland JM, Wang LZ, Matsumura N, Mandai M, Konishi I, et al. Functional genomics identifies five distinct molecular subtypes with clinical relevance and pathways for growth control in epithelial ovarian cancer. EMBO molecular medicine. 2013;5:983–998. - PMC - PubMed
    1. Loh YN, Hedditch EL, Baker LA, Jary E, Ward RL, Ford CE. The Wnt signalling pathway is upregulated in an in vitro model of acquired tamoxifen resistant breast cancer. BMC Cancer. 2013;13:174. - PMC - PubMed
    1. Ford CE, Punnia-Moorthy G, Henry CE, Llamosas E, Nixdorf S, Olivier J, Caduff R, Ward RL, Heinzelmann-Schwarz V. The non-canonical Wnt ligand, Wnt5a, is upregulated and associated with epithelial to mesenchymal transition in epithelial ovarian cancer. Gynecologic Oncology. 2014;134:338–345. - PubMed

Publication types

MeSH terms