Magnitude and Kinetics of CD8+ T Cell Activation during Hyperacute HIV Infection Impact Viral Set Point
- PMID: 26362266
- PMCID: PMC4575777
- DOI: 10.1016/j.immuni.2015.08.012
Magnitude and Kinetics of CD8+ T Cell Activation during Hyperacute HIV Infection Impact Viral Set Point
Abstract
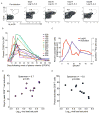
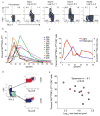
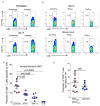
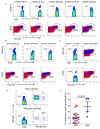
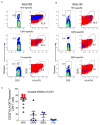
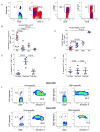
CD8(+) T cells contribute to the control of HIV, but it is not clear whether initial immune responses modulate the viral set point. We screened high-risk uninfected women twice a week for plasma HIV RNA and identified 12 hyperacute infections. Onset of viremia elicited a massive HIV-specific CD8(+) T cell response, with limited bystander activation of non-HIV memory CD8(+) T cells. HIV-specific CD8(+) T cells secreted little interferon-γ, underwent rapid apoptosis, and failed to upregulate the interleukin-7 receptor, known to be important for T cell survival. The rapidity to peak CD8(+) T cell activation and the absolute magnitude of activation induced by the exponential rise in viremia were inversely correlated with set point viremia. These data indicate that rapid, high magnitude HIV-induced CD8(+) T cell responses are crucial for subsequent immune control of acute infection, which has important implications for HIV vaccine design.
Copyright © 2015 Elsevier Inc. All rights reserved.
Figures

Similar articles
-
HIV-specific IL-2(+) and/or IFN-γ(+) CD8(+) T cell responses during chronic HIV-1 infection in former blood donors.Biomed Environ Sci. 2010 Oct;23(5):391-401. doi: 10.1016/S0895-3988(10)60081-5. Biomed Environ Sci. 2010. PMID: 21112488
-
Type I interferon upregulates Bak and contributes to T cell loss during human immunodeficiency virus (HIV) infection.PLoS Pathog. 2013;9(10):e1003658. doi: 10.1371/journal.ppat.1003658. Epub 2013 Oct 10. PLoS Pathog. 2013. PMID: 24130482 Free PMC article. Clinical Trial.
-
Human immunodeficiency virus type 1 (HIV-1)-specific CD8+ T(EMRA) cells in early infection are linked to control of HIV-1 viremia and predict the subsequent viral load set point.J Virol. 2007 Jun;81(11):5759-65. doi: 10.1128/JVI.00045-07. Epub 2007 Mar 21. J Virol. 2007. PMID: 17376902 Free PMC article.
-
Apoptosis in AIDS. Genetic control and relevance for AIDS pathogenesis.Biochem Soc Trans. 1996 Nov;24(4):1055-8. doi: 10.1042/bst0241055. Biochem Soc Trans. 1996. PMID: 8968511 Review. No abstract available.
-
Viro-immunopathogenesis of HIV disease: implications for therapy.Immunol Today. 1995 Jan;16(1):5-7. doi: 10.1016/0167-5699(95)80062-x. Immunol Today. 1995. PMID: 7880388 Review. No abstract available.
Cited by
-
Immunometabolism and HIV-1 pathogenesis: food for thought.Nat Rev Immunol. 2021 Jan;21(1):5-19. doi: 10.1038/s41577-020-0381-7. Epub 2020 Aug 6. Nat Rev Immunol. 2021. PMID: 32764670 Review.
-
Nonhuman TRIM5 Variants Enhance Recognition of HIV-1-Infected Cells by CD8+ T Cells.J Virol. 2016 Sep 12;90(19):8552-62. doi: 10.1128/JVI.00819-16. Print 2016 Oct 1. J Virol. 2016. PMID: 27440884 Free PMC article.
-
The plasma levels of soluble ST2 as a marker of gut mucosal damage in early HIV infection.AIDS. 2016 Jun 19;30(10):1617-27. doi: 10.1097/QAD.0000000000001105. AIDS. 2016. PMID: 27045377 Free PMC article.
-
Envelope residue 375 substitutions in simian-human immunodeficiency viruses enhance CD4 binding and replication in rhesus macaques.Proc Natl Acad Sci U S A. 2016 Jun 14;113(24):E3413-22. doi: 10.1073/pnas.1606636113. Epub 2016 May 31. Proc Natl Acad Sci U S A. 2016. PMID: 27247400 Free PMC article.
-
CD8 T cells targeting adapted epitopes in chronic HIV infection promote dendritic cell maturation and CD4 T cell trans-infection.PLoS Pathog. 2019 Aug 9;15(8):e1007970. doi: 10.1371/journal.ppat.1007970. eCollection 2019 Aug. PLoS Pathog. 2019. PMID: 31398241 Free PMC article.
References
-
- Appay V, Papagno L, Spina CA, Hansasuta P, King A, Jones L, Ogg GS, Little S, McMichael AJ, Richman DD, Rowland-Jones SL. Dynamics of T cell responses in HIV infection. J Immunol. 2002;168:3660–3666. - PubMed
-
- Badovinac VP, Porter BB, Harty JT. Programmed contraction of CD8(+) T cells after infection. Nature immunology. 2002;3:619–626. - PubMed
-
- Bangs SC, McMichael AJ, Xu XN. Bystander T cell activation--implications for HIV infection and other diseases. Trends Immunol. 2006;27:518–524. - PubMed
Publication types
MeSH terms
Substances
Grants and funding
LinkOut - more resources
Full Text Sources
Other Literature Sources
Medical
Research Materials

