

Genome-wide RNAi analysis reveals that simultaneous inhibition of specific mevalonate pathway genes potentiates tumor cell death
- PMID: 26353928
- PMCID: PMC4694962
- DOI: 10.18632/oncotarget.4817
Genome-wide RNAi analysis reveals that simultaneous inhibition of specific mevalonate pathway genes potentiates tumor cell death
Abstract
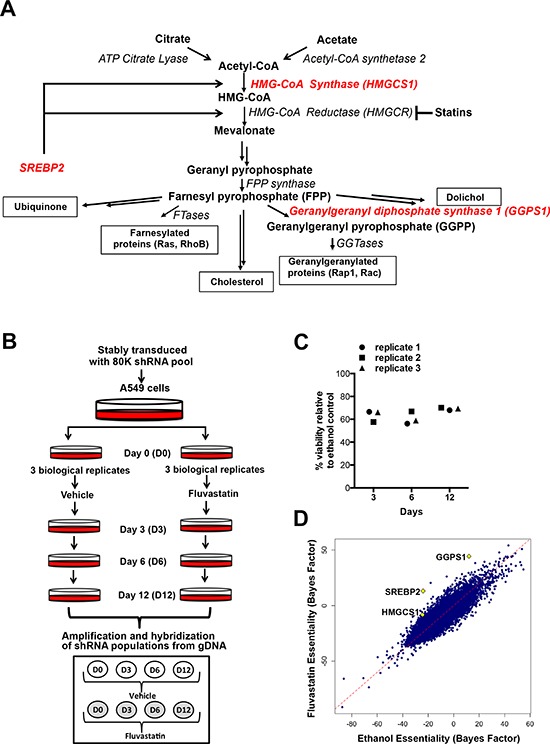
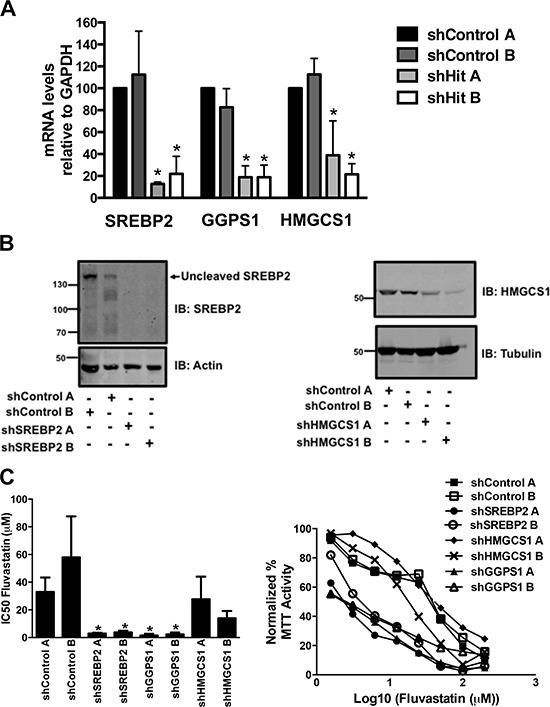
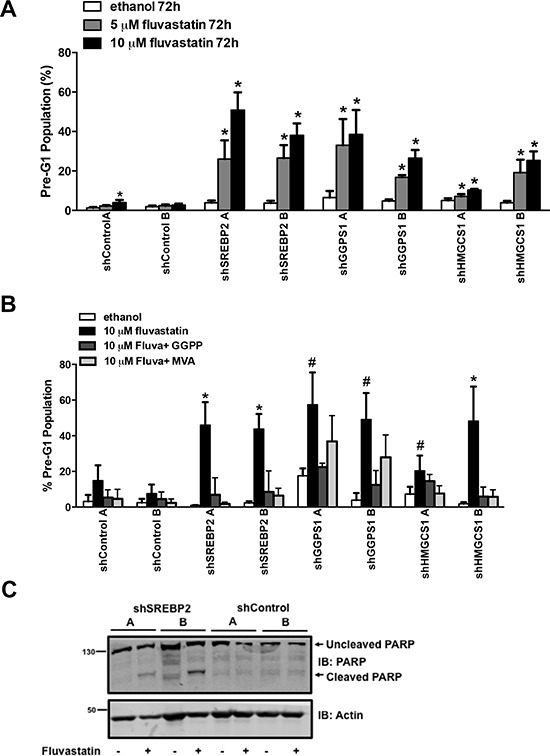
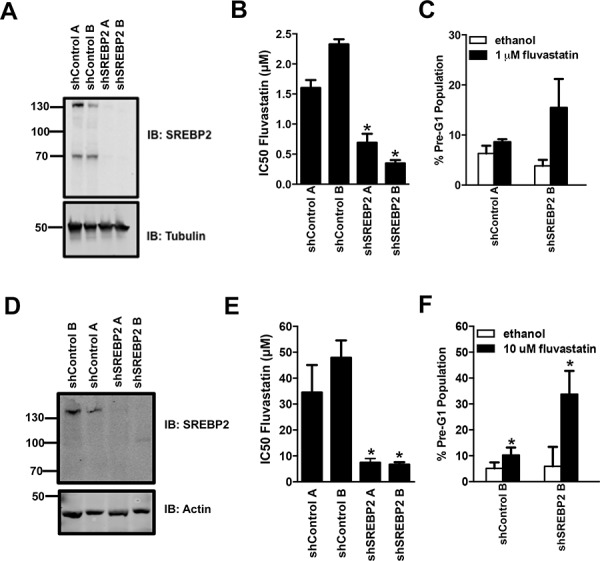
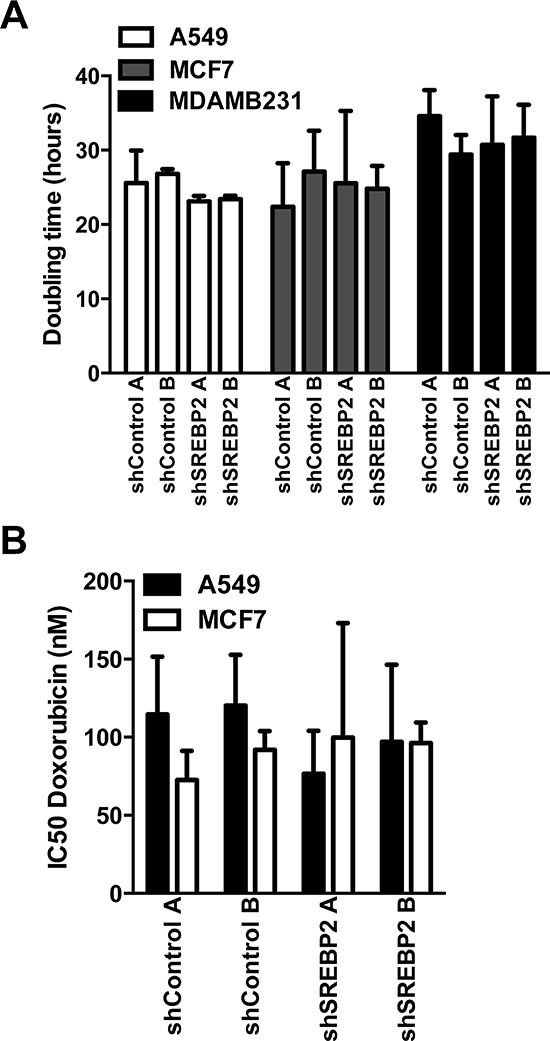
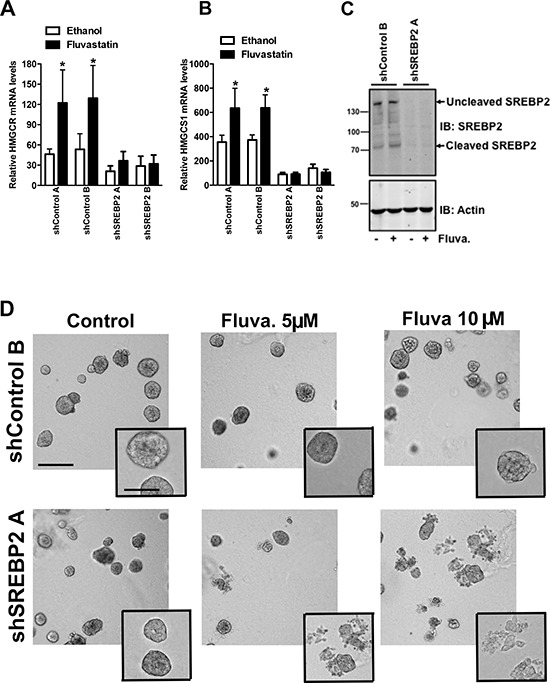
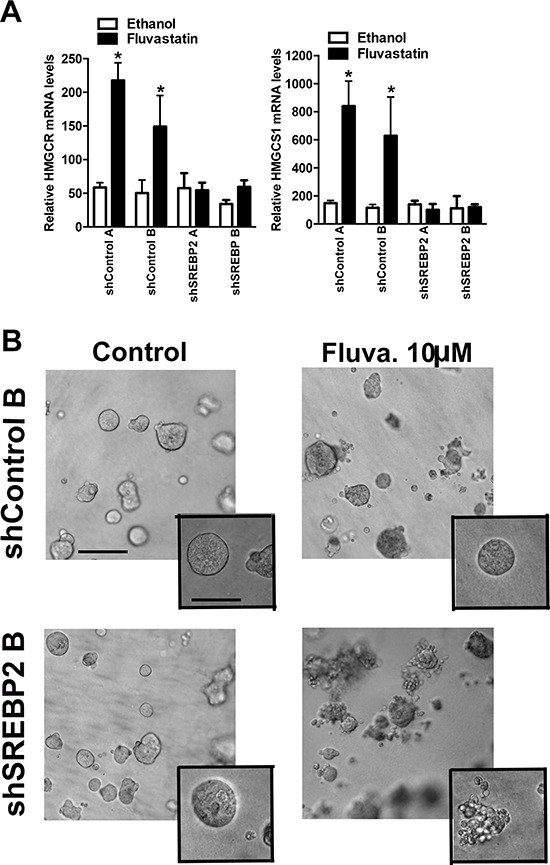
The mevalonate (MVA) pathway is often dysregulated or overexpressed in many cancers suggesting tumor dependency on this classic metabolic pathway. Statins, which target the rate-limiting enzyme of this pathway, 3-hydroxy-3-methylglutaryl-CoA reductase (HMGCR), are promising agents currently being evaluated in clinical trials for anti-cancer efficacy. To uncover novel targets that potentiate statin-induced apoptosis when knocked down, we carried out a pooled genome-wide short hairpin RNA (shRNA) screen. Genes of the MVA pathway were amongst the top-scoring targets, including sterol regulatory element binding transcription factor 2 (SREBP2), 3-hydroxy-3-methylglutaryl-coenzyme A synthase 1 (HMGCS1) and geranylgeranyl diphosphate synthase 1 (GGPS1). Each gene was independently validated and shown to significantly sensitize A549 cells to statin-induced apoptosis when knocked down. SREBP2 knockdown in lung and breast cancer cells completely abrogated the fluvastatin-induced upregulation of sterol-responsive genes HMGCR and HMGCS1. Knockdown of SREBP2 alone did not affect three-dimensional growth of lung and breast cancer cells, yet in combination with fluvastatin cell growth was disrupted. Taken together, these results show that directly targeting multiple levels of the MVA pathway, including blocking the sterol-feedback loop initiated by statin treatment, is an effective and targetable anti-tumor strategy.
Keywords: SREBP2; feedback inhibition; mevalonate pathway; statins; tumor metabolism.
Conflict of interest statement
The authors declare no conflict of interest.
Figures
Similar articles
-
An actionable sterol-regulated feedback loop modulates statin sensitivity in prostate cancer.Mol Metab. 2019 Jul;25:119-130. doi: 10.1016/j.molmet.2019.04.003. Epub 2019 Apr 10. Mol Metab. 2019. PMID: 31023626 Free PMC article.
-
Immediate utility of two approved agents to target both the metabolic mevalonate pathway and its restorative feedback loop.Cancer Res. 2014 Sep 1;74(17):4772-82. doi: 10.1158/0008-5472.CAN-14-0130. Epub 2014 Jul 3. Cancer Res. 2014. PMID: 24994712
-
The isomiR-140-3p-regulated mevalonic acid pathway as a potential target for prevention of triple negative breast cancer.Breast Cancer Res. 2018 Dec 11;20(1):150. doi: 10.1186/s13058-018-1074-z. Breast Cancer Res. 2018. PMID: 30537987 Free PMC article.
-
Targeting the mevalonate cascade as a new therapeutic approach in heart disease, cancer and pulmonary disease.Pharmacol Ther. 2014 Jul;143(1):87-110. doi: 10.1016/j.pharmthera.2014.02.007. Epub 2014 Feb 26. Pharmacol Ther. 2014. PMID: 24582968 Free PMC article. Review.
-
Mevalonate Pathway and Human Cancers.Curr Mol Pharmacol. 2017;10(2):77-85. doi: 10.2174/1874467209666160112123205. Curr Mol Pharmacol. 2017. PMID: 26758953 Review.
Cited by
-
Regulation of the Notch-ATM-abl axis by geranylgeranyl diphosphate synthase inhibition.Cell Death Dis. 2019 Sep 30;10(10):733. doi: 10.1038/s41419-019-1973-7. Cell Death Dis. 2019. PMID: 31570763 Free PMC article.
-
Mevalonate Pathway Enzyme HMGCS1 Contributes to Gastric Cancer Progression.Cancers (Basel). 2020 Apr 27;12(5):1088. doi: 10.3390/cancers12051088. Cancers (Basel). 2020. PMID: 32349352 Free PMC article.
-
A chest CT-based nomogram for predicting survival in acute myeloid leukemia.BMC Cancer. 2024 Apr 12;24(1):458. doi: 10.1186/s12885-024-12188-8. BMC Cancer. 2024. PMID: 38609917 Free PMC article.
-
Computational pharmacogenomic screen identifies drugs that potentiate the anti-breast cancer activity of statins.Nat Commun. 2022 Oct 24;13(1):6323. doi: 10.1038/s41467-022-33144-9. Nat Commun. 2022. PMID: 36280687 Free PMC article.
-
The interplay between cell signalling and the mevalonate pathway in cancer.Nat Rev Cancer. 2016 Nov;16(11):718-731. doi: 10.1038/nrc.2016.76. Epub 2016 Aug 26. Nat Rev Cancer. 2016. PMID: 27562463 Review.
References
-
- Zaidi N, Swinnen JV, Smans K. ATP-citrate lyase: a key player in cancer metabolism. Cancer research. 2012;72:3709–3714. - PubMed
-
- Mashimo T, Pichumani K, Vemireddy V, Hatanpaa KJ, Singh DK, Sirasanagandla S, Nannepaga S, Piccirillo SG, Kovacs Z, Foong C, Huang Z, Barnett S, Mickey BE, DeBerardinis RJ, Tu BP, Maher EA, et al. Acetate is a bioenergetic substrate for human glioblastoma and brain metastases. Cell. 2014;159:1603–1614. - PMC - PubMed
-
- Schug ZT, Peck B, Jones DT, Zhang Q, Grosskurth S, Alam IS, Goodwin LM, Smethurst E, Mason S, Blyth K, McGarry L, James D, Shanks E, Kalna G, Saunders RE, Jiang M, et al. Acetyl-CoA synthetase 2 promotes acetate utilization and maintains cancer cell growth under metabolic stress. Cancer cell. 2015;27:57–71. - PMC - PubMed
Publication types
MeSH terms
Substances
LinkOut - more resources
Full Text Sources
Other Literature Sources
