. 2015 Sep;17(9):1193-204.
doi: 10.1038/ncb3228. Epub 2015 Aug 24.

Combined CSL and p53 downregulation promotes cancer-associated fibroblast activation

Affiliations

Combined CSL and p53 downregulation promotes cancer-associated fibroblast activation

Maria-Giuseppina Procopio et al. Nat Cell Biol. 2015 Sep.

Erratum in

Abstract

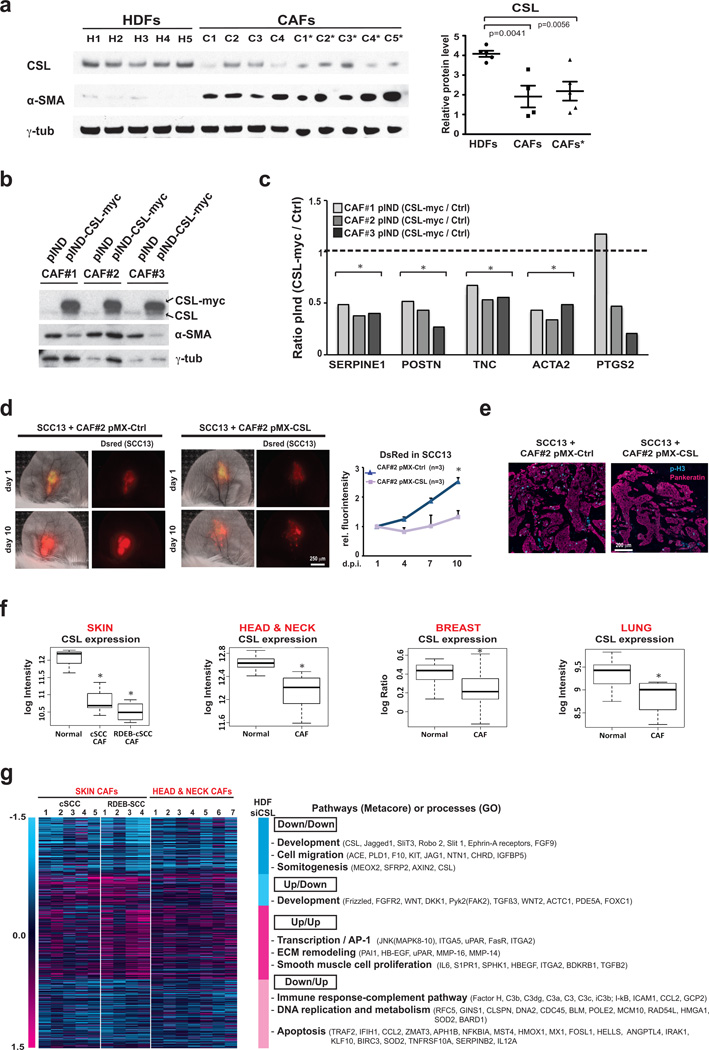
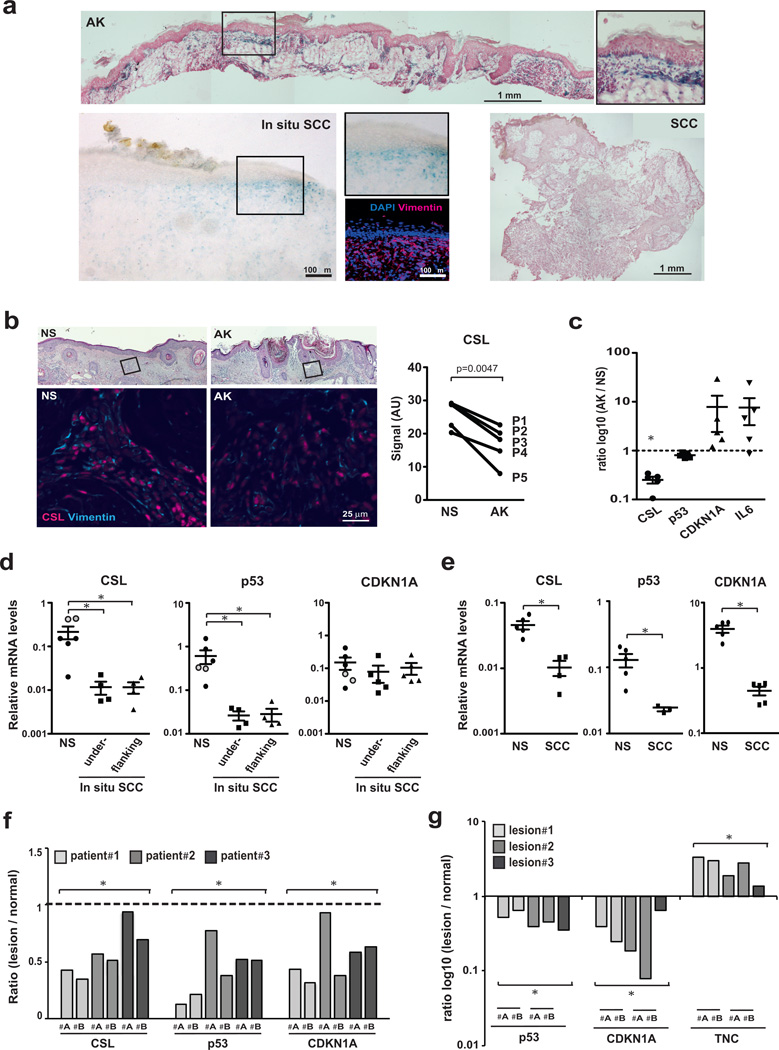
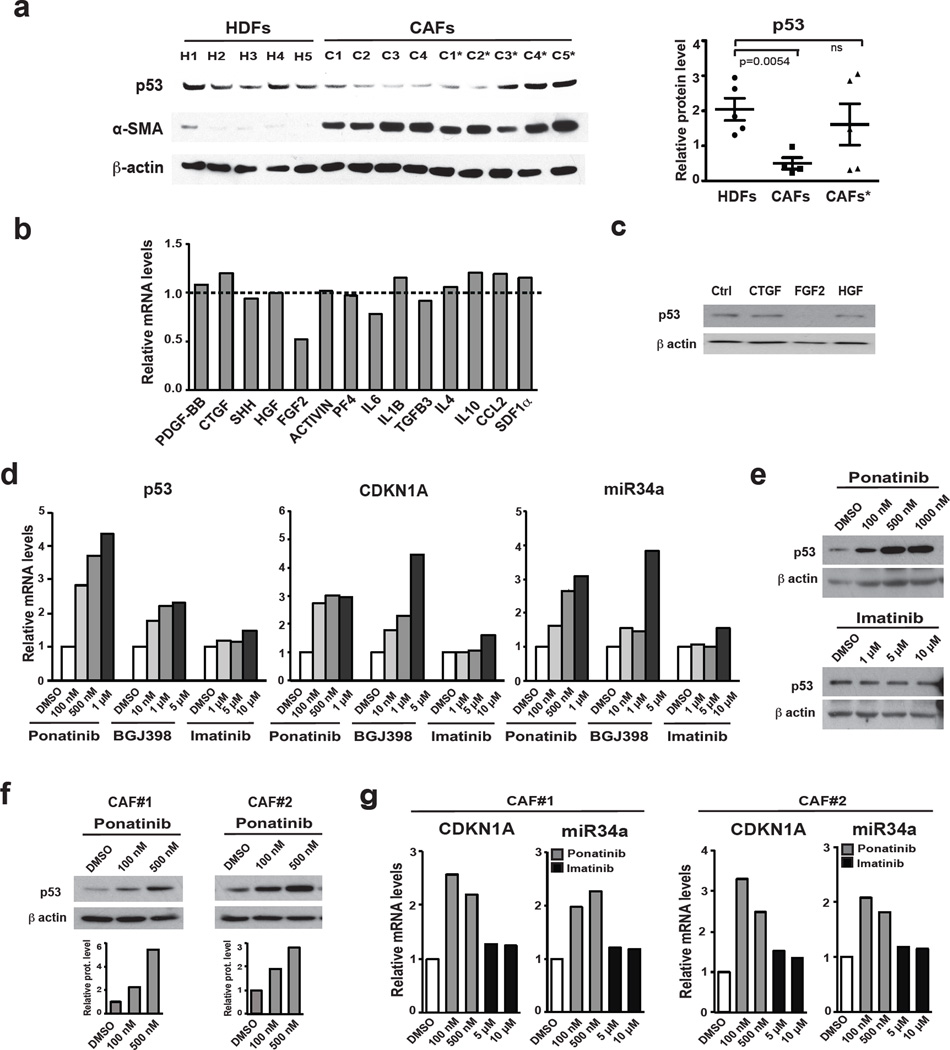
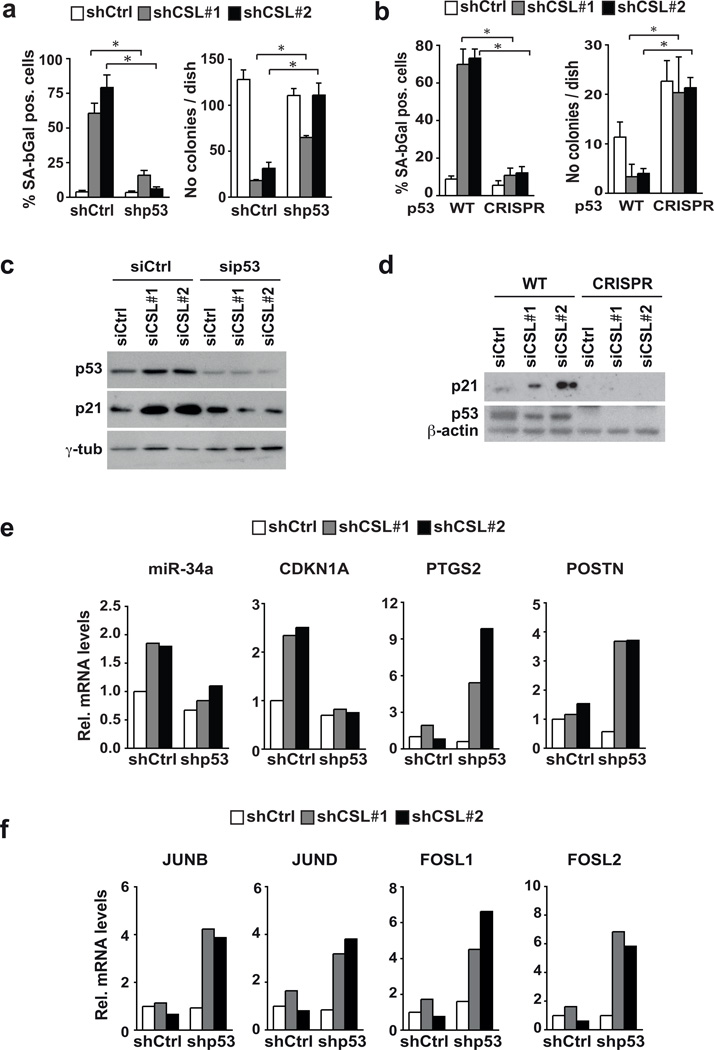
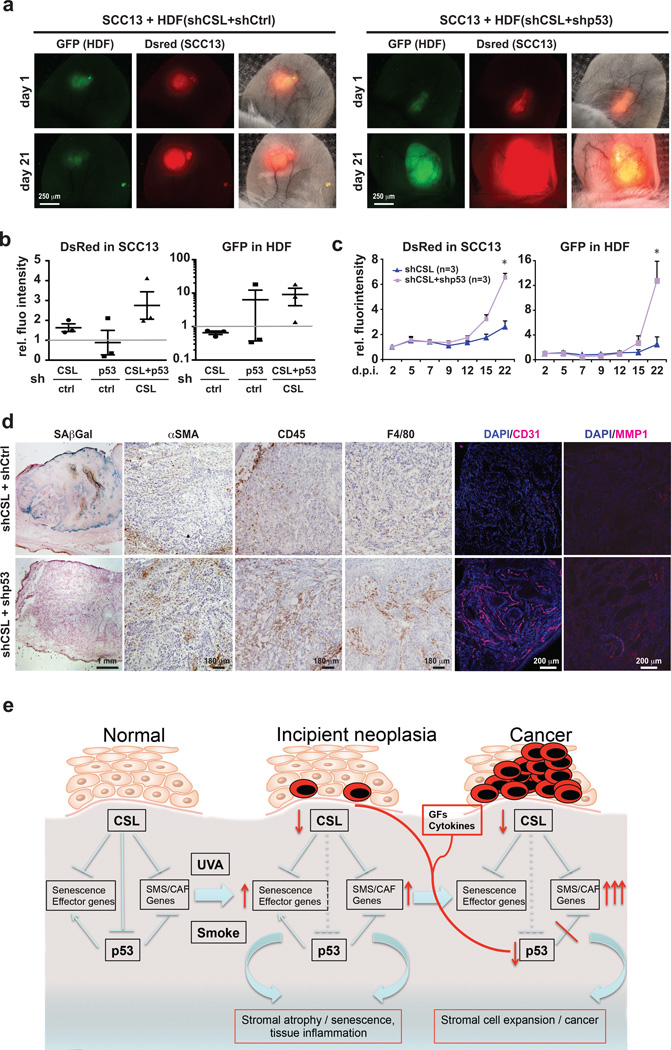
Stromal fibroblast senescence has been linked to ageing-associated cancer risk. However, density and proliferation of cancer-associated fibroblasts (CAFs) are frequently increased. Loss or downmodulation of the Notch effector CSL (also known as RBP-Jκ) in dermal fibroblasts is sufficient for CAF activation and ensuing keratinocyte-derived tumours. We report that CSL silencing induces senescence of primary fibroblasts from dermis, oral mucosa, breast and lung. CSL functions in these cells as a direct repressor of multiple senescence- and CAF-effector genes. It also physically interacts with p53, repressing its activity. CSL is downmodulated in stromal fibroblasts of premalignant skin actinic keratosis lesions and squamous cell carcinomas, whereas p53 expression and function are downmodulated only in the latter, with paracrine FGF signalling as the probable culprit. Concomitant loss of CSL and p53 overcomes fibroblast senescence, enhances expression of CAF effectors and promotes stromal and cancer cell expansion. The findings support a CAF activation-stromal co-evolution model under convergent CSL-p53 control.


Figures

Figure 1
Figure 1. CSL control of stromal fibroblast senescence and CAF gene expression
(a) Senescence Associated β-galactosidase (SA-β-Gal) staining of newborn mouse skin plus/minus mesenchymal CSL deletion (KO1/WT) with anti-vimentin immunofluorescence for fibroblast localization. (b) SA-β-Gal staining of lesions in 3-months old male mice with immunofluorescence for keratin 14 (K14), Tenascin-C (TNC), Vimentin, DAPI staining (lower panels, Supplementary Fig.1b). (c) Immunofluorescence of parallel sections for phospho-histone 3, vimentin, F4/80 and quantification of phospho-histone 3 positive fibroblasts (vimentin-positive, F4/80 negative); From left to right, n (cells) = 367, 603, 298, 453, 284, 493, assessed from 3, 4, 3, 4, 3, 4 fields, respectively; mean +/−s.d., two-tailed paired t-test. (d,e) SA-β-Gal staining (d) and clonogenicity assays (e) of second passage dermal fibroblasts from mice plus/minus CSL deletion with corresponding quantification. d: n(cells)=323(WT) and 135(KO), assessed from 4 and 7 fields respectively; e: n=3 biological replicates/condition. (f,g) SA-β–Gal (f) and clonogenicity (g) assays of HDFs plus/minus CSL silencing. f: from left to right n(cells)=118, 72, 111 assessed from 4, 6 and 6 fields, respectively; g: n=3 biological replicates/condition. Similar results were obtained with two other strains (Suppl. Fig.2b,c). (h,i) Independent HDF strains plus/minus CSL silencing by shRNA (h) and siRNA (i) analyzed by RT-qPCR; h: n(HDF strains)=8 shCSL1+2, 4 shCtrl, i: n(HDF strains)=8 siCSL1+2, 4 siCtrl. (j) HDFs plus/minus CSL silencing analyzed by immunoblotting. One blot probed for p53, p21WAF1/Cip1, CSL, γ-tubulin; another for IL6, β-actin, another for p16INK4a, γ-tubulin. Similar p21 induction was observed in two other independent experiments (Fig. 7c,d), with p21 and IL6 IF (Suppl. Fig.2h) as confirmation. For unprocessed blots see Suppl. Fig.9. (k) SA-β-Gal assays of fibroblasts from oral mucosa (HOF), breast (HBF), lung (HLF) plus/minus CSL silencing; from left to right n(cells)=207, 251, 274, 201, 206, 200, 223, 203, 200, 276, 222, 249, assessed from 4, 11, 11, 5, 8, 7, 3, 7, 10, 4, 7 and 4 fields, respectively. (l) Cells as in (k) were analyzed by RT-qPCR; n(fibroblast types)=4 shCtrl, 8 shCSL1+2. For (d-g) and (k) mean+/−s.d, two-tailed unpaired t-test; for (h-i) and (l) ratio log2(CSL/Ctrl), two-tailed one sample t-test. *p<0.05.
Figure 2
Figure 2. CSL expression and function in CAFs
(a) Immunoblotting of cancer associated fibroblasts (CAFs) from several skin SCCs soon after culturing (p2) and upon expansion (p4; *) in parallel with several HDF strains. Blot was probed for CSL, α-SMAand γ-tubulin with densitometric quantification; n(strains)= 5 HDF, 4 CAF, 5 CAF*, mean +/− s.e.m., two-tailed unpaired t-test. Similar results were obtained in a second independent experiment (right panel). (b) Same CAFs strains as in (a), transduced with lentiviral vector fordoxycyclin induciblemyc-tagged CSL or pIND vector control were analyzed by immunoblotting. (c) CAFs as in (b) were analyzed by RT-qPCR for indicated genes; n(CAF strains)=3 pInd-Ctrl, 3 pInd-CSL, ratio(CSL/Ctrl), two-tailed one sample t-tets. (d) DsRed2-expressing SCC13 cells admixed with CAFs (strain #2) plus/minus constitutive lentiviral CSL expression were injected in parallel into ears of 3 NOD/SCID Il2rg−/− 10-weeks-old male mice. Representative images and signal quantification relative to day 1; n=3 per condition, mean +/− s.e.m., two-tailed paired t-test at day 10. (e) Immunofluorescence for proliferation (phospho-histone 3) and epithelial (pankeratin) markers. (f) CSL levels in published gene expression profiles of CAFs from skin SCCs (from general populations (cSCC) and from patients with recessive dystrophic epidermolysis bullosa (RDEB-SCC); head/neck SCC, breast cancer and lung cancer; Skin (n=5 SCC, 4 RDEB-SCC, 3 healthy individuals), Head & Neck (n=7 SCC, 5 healthy individuals), Breast (n=23 carcinoma, 5 healthy individuals), Lung (n=4 NSCLC, 15 healthy individuals), two-class comparison with moderated t-statistic. Median, upper and lower quartiles are represented. Vertical whiskers indicate variability outside the upper and lower quartiles. (g) Heat maps of differentially expressed genes in HDFs plus/minus CSL silencing relative to data sets of CAFs from skin and head/neck SCCs. Genes modulated by CSL silencing in HDFs (> 1.4 folds) concordantly or discordantly down- or up-regulated in clinically occurring CAFs are indicated by dark and light turquoise and magenta colors, respectively. Selected pathways or processes with a statistically significant enrichment (p<0.05) are indicated along with representative genes. Complete list is provided in Supplementary Table 1. For (a) and (b) unprocessed original scans of blots are shown in Supplementary Fig. 9. *p<0.05.
Figure 3
Figure 3. CSL as a direct negative regulator of senescence- and CAF-effector genes
(a) Top: maps of the predicted CSL binding sites (positions indicated in blue) relative to the Transcription Start Site (TSS) and mapped within the proximal enhancers and promoter regions of the indicated genomic loci (grey and black boxes, respectively; obtained from ENCODE information). Each map is at a different scale, as indicated by bars. Bottom: Chromatin Immunoprecipitation (ChIP) assays with two different antibodies against CSL (HM = home made; CS = Cell Signaling; grey and black bars, respectively) were performed in parallel with non-immune IgG controls for the indicated chromosomal sites (numbers) containing predicted CSL recognition sequences. Independent ChIP assays with two other HDF strains are shown in Supplementary Fig. 3f. (b) List of CAF-related and AP1 family members that were found to be targeted by CSL by ChIP-seq analysis with two different antibodies against CSL. A more detailed list of genes with specific localization of CSL binding peaks is provided in Supplementary Table 2. (c) Graphic illustration of the position of CSL binding peaks revealed by ChIP-seq analysis with two different antibodies (red and blue colors) for the indicated genes, utilizing ENCODE information for promoter and enhancer localization, as indicated by islands of Histone H3 modifications (K4m3 and K27Ac, respectively), along with the respective position of Transcription Start Site (arrow) and coding exons (black boxes). For JUNB, the entire locus, as delimited by binding peaks of the CTCF insulator, is shown. Results for 2 additional loci (MMP13 and FOSL2) are shown in Supplementary Fig. 3g.
Figure 4
Figure 4. Convergent regulation and physical association of CSL and p53 proteins
(a) ChIP assays of HDFs plus/minus CSL silencing for p53 binding to CDKN1A (sites #3,5 in Fig. 3a) and MDM2 genes. For CDKN1A, assays with two HDF strains are shown. (b) Endogenous CSL and p53 immuno-precipitations from HDFs followed by immuno-blotting. For p53 immunoprecipitation, HDFs with lentiviral p53 expression were used. Similar results with another HDF strain were obtained (Suppl. Fig. 4a, b). (c) Hela cells expressing myc-tagged CSL and p53 were immunoprecipitated with anti-myc antibodies followed by immunoblotting with anti-myc and -p53antibodies. (d) Admixed CSL and p53 proteins were immune-precipitated with anti-CSL antibodies followed by immunoblotting forCSL and p53 (green and red, respectively). Anti-CSL secondaries recognized also heavy chains (h.c.). Similar results were obtained in a second independent experiment. (e) Binding of CSL and p53 proteins measured by microscale thermophoresis (MST). Inset: thermophoretic movement of fluorescently-labeled p53. Results of second experiment and specificity controls are shown in Supplementary Fig. 4c. (f) 293T cell extracts plus/minus CSL (CSL OE) or p53 (p53 OE) overexpression were incubated with biotinylated oligonucleotide with tandem CSL and p53 binding sites of CDKN1A gene (WT) or oligonucleotide with site disruption (mt). Pull-down samples were immunoblotted with antibodies against CSL and p53 (green and red, respectively). Lower panels: fluorescence signal quantification. (g) p53 luciferase reporter activity in HDFs co-transfected with two siRNAs against CSL (pooling siRNA samples for the assay) versus scrambled controls. Shown are composite results of 2 independent experiments; n=4 biological replicates, mean +/− s.d., two tailed paired t-test. *p<0.05. (h) p53 luciferase reporter activity in 293T cells plus/minus co-transfection of p53 and CSL expressing plasmid in increasing amounts. Similar results were obtained in three other independent experiments. (i) p300 immuno-precipitation from 293T cells co-transfected with p53 and CSL expressing plasmid in increasing amounts followed by immuno-blotting for p53, p300, and CSL. Similar results were obtained in two other independent experiments as shown in Supplementary Fig. 4d. For (b-d), (f) and (i) unprocessed original scans of blots are shown in Supplementary Fig. 9.
Figure 5
Figure 5. CSL and p53 expression in premalignant (AK) versus malignant (SCC) stroma
(a) SA-β–Gal staining of AKs, in situ and invasive skin SCCs. For in situ SCCs, immunofluorescence for vimentin and CD68, for fibroblast and macrophage localization. CD68-positive cells were only in deeper stromal regions (Supplementary Fig.5d). For additional lesions see Supplementary Fig.5a–d. (b) Double immuno-fluorescence of AKs and flanking normal skin (NS) from 5 patients for CSL and vimentin. Representative images and CSL signal quantification in vimentin-positive cells in AKs versus flanking skin. Only minority of cells double stained for vimentin and CD68 macrophage marker (Supplementary Fig.5e). n(vimentin-positive cells in P1-5)=345, 397, 310, 183, 111 (NS) and 345, 397, 310, 183, 111 (AK), mean signal intensity as individual data points, two tailed paired t-test. (c) LCM of AK-underlying stroma versus flanking normal stroma (NS) and RT-qPCR analysis; n=5 AKs and 5 flanking regions, mean of ratio log10(AK/NS) +/−s.e.m. Significance of differences in CSL expression was calculated by two-tailed one sample t-test (*p<0.0001), and of inverse relation between CSL and CDKN1A or IL6 expression by Pearson coeff. (−0.92 and −0.88, respectively; *p<0.05). (d) LCM-obtained PDGFRα positive cells (Supplementary Fig. 5j) from stroma underlying (n=5) and flanking (n=5) in situ SCC lesions and unaffected stroma (n=6) from other individuals (face- and abdomen-derived; black and grey circles) were analyzed by RT-qPCR for indicated genes; mean +/−s.e.m., two-tailed unpaired t-test, *p<0.05. (e) LCM-obtained stroma from invasive SCC (n=5) and normal skin (NS, n=5) samples from different individuals was analyzed by RT-qPCR for indicated genes; mean +/−s.e.m., two-tailed unpaired t-test, *p<0.05. (f) LCM-obtained stroma from skin SCCs (two lesion areas #A,B) and matching surgically discarded normal skin from three patients were analyzed by RT-qPCR; n=6 SCC and 3 normal regions, ratio (SCC/normal), one sample t-test, *p<0.005). (g) LCM-obtained stroma from skin lesions (two lesion areas #A, B) of 3 months old mice with mesenchymal CSL deletion (the same of Fig. 1b, c; Supplementary Fig. 1b, c) and matching stroma of unaffected skin was analyzed by RT-qPCR for indicated genes; n=5 affected and 3 unaffected regions, ratio log10(affected/unaffected), one sample t-test, *p<0.005.
Figure 6
Figure 6. Modulation of p53 gene transcription and activity in dermal fibroblasts and CAFsas function of FGFR signaling
(a) Immunoblot analysis of p53 expression in cancer associated fibroblasts (CAFs) from several skin SCCs soon after culturing (passage 2) and upon expansion (passage 4; *) in parallel with a set of HDF strains under similar growth and passage conditions. The p53 blot was re-probed with antibodies against α–SMA (left panel). Results were quantified by densitometric scanning after signal normalization for the housekeeping protein (right panel); n(strains)= 5 HDF, 4 CAF, 5 CAF*, mean +/− s.e.m., two-tailed unpaired t-test. (b) Early passage HDFs were treated with the indicated growth factors / cytokines (at the concentrations specified in methods) followed, 72 hours later, by RT-qPCR analysis of p53 expression. Results of a similar experiment with a second HDF strain of different origin are shown in Supplementary Fig. 6a. (c) Same cells as in the previous panel were treated with the indicated growth factors followed by immunoblot analysis of p53 expression. (d) Early passage HDFs were treated with a multi targeted tyrosine kinase inhibitor with potent anti-FGFR activity (Ponatinib) or a more FGFR-selective inhibitor (BGJ398) versus one devoid of such activity (Imatinib) followed, 72 hours later, by analysis of p53, CDKN1A and miR34a expression by RT-qPCR. Similar results were obtained with a second independent strain (Supplementary Fig. 6b). (e) HDFs treated as in the previous panel were analyzed for levels of p53 expression by immunoblotting, with similar results with a second HDF strain shown in Supplementary Fig. 6c. (f) Two independent CAF strains were treated with Ponatinib at the indicated concentrations for 72 hours followed by immunoblot analysis of p53 expression. (g) Similar CAF cultures treated as in the previous panel were analyzed for CDKN1A and miR-34a levels by RT-qPCR.For (a), (c) and (e-f) unprocessed original scans of blots are shown in Supplementary Fig. 9.
Figure 7
Figure 7. Escape from senescence and enhanced CAF marker expression in stromal fibroblasts with concomitant CSL and p53 gene silencing
(a) HDFs were infected with control versus p53 silencing retroviruses, followed by infection with either control or CSL silencing lentiviruses. Number of cells positive for SA-β-Gal activity was determined a week later (right panel). The same cells were also plated under sparse conditions, followed by determination of colony formation 10 days later (left panel). For SA-β–Gal activity n=131 (shCtrl+shCtrl), 127 (shCSL1+shCtrl), 130 (shCSL2+shCtrl), 314 (shp53+shCtrl), 151 (shp53+shCSL1), 184 (shp53+shCSL2) cells assessed from 4 fields for each condition, except for shCSL1+shCtrl and shCSL2+shCtrl from 6 and 8 fields, respectively; for clonogenicity assay n=3 biological replicates/condition. Results of a similar experiment with an independent strain of HDFs are shown in Supplementary Fig. 7b. (b) HDFs plus/minus CRISPR-mediated disruption of the p53 gene (obtained and characterized as shown in Supplementary Fig. 7a) were infected with control versus CSL silencing lentiviruses, followed by determination of SA-β–Gal activity and colony forming ability. For SA-β–Gal activity n=159 (p53-WT+shCtrl), 126 (p53-WT+shCSL1), 201 (p53-WT+shCSL2), 164 (p53-CRISPR+shCtrl), 186 (p53-CRISPR+shCSL1), 207 (p53-CRISPR+shCSL2) cells assessed from 5 fields for each condition, except for (p53-WT+shCSL1) and (p53-WT+shCSL2) assessed from 7 fields; for clonogenicity assay n=3 biological replicates/condition. (c)Same strain of HDFs as in panel (a) were transfected with siRNAs against CSL plus/minus siRNAs for p53, followed, 3 days later, by a repeat transfection. Cell extracts were analyzed 3 days later by immuno-blotting against the indicated proteins. (d) HDFs with CRISPR-mediated p53 gene disruption were transfected, in parallel with control parental cells, with siRNAs against CSL followed by immunoblot analysis of the indicated proteins. (e, f) HDFs plus/minus CSL and p53 gene silencing as in (a) were analysed by RT-qPCR for expression of the indicated genes. Results of a similar experiment with an independent strain of HDFs are shown in Supplementary Fig. 7c. For (a) and (b) mean +/− s.d., two-tailed unpaired t-test is shown; *p<0.05. For (c) and (d) unprocessed original scans of blots are shown in Supplementary Fig. 9.
Figure 8
Figure 8. Tumor and stromal cell expansion as a result of CSL and p53 suppression
(a) DsRed2 expressing SCC13 cells were admixed with GFP expressing HDFs with shRNA-mediated silencing of CSL or p53 individually or in combination, followed by parallel injections into mouse ears and imaging every 2–3 days under a fluorescence dissection microscope. Shown are representative images from one pair of mouse ears at the indicated times after injection. Similar images from another mouse are shown in Supplementary Fig. 8a. (b) Quantification of digital images for relative red (SCC cells) and green (stromal cells) fluorescence intensity values (intensity×surface area) for each combination of cells, at the end of the experiments (Day 21). Experimental conditions included SCC cells admixed with: (i) HDFs with individual CSL or (ii) p53 silencing versus HDFs control; (iii) HDFs with combined CSL and p53 silencing versus HDFs with CSL silencing only; for each conditions n=3 experimental and 3 control lesions (9 NOD/SCID Il2rg−/− 10-weeks-old male mice). To take into account individual animal variations, for each mouse ear pair, the signal increase in the ear injected with control cells was set to 1. Quantification was done by software (ImageJ) analysis of the digitally acquired images. (c) Quantification of changes in red and green fluorescence signal for 3 pairs of ear injections with SCC cells admixed with HDFs with combined silencing of CSL and p53 versus CSL alone; n=3 lesions per condition, mean +/− s.e.m., two-tailed paired t-test at day 22, *p>0.05. (d) SA-β-Gal assays and immuno-histochemical analysis with antibodies against the indicated markers in lesions formed by ear injections of SCC13 cells admixed with HDFs with combined silencing of CSL and p53 versus silencing of CSL alone. Similar results with lesions from an additional pair of mouse ear injections are shown in Supplementary Fig. 8b. (e) Diagrammatic illustration of the process leading from normal fibroblasts to CAFs with CSL and p53 as critical determinants, as proposed in the discussion.

Similar articles

Cited by

References

    1. Bissell MJ, Hines WC. Why don't we get more cancer? A proposed role of the microenvironment in restraining cancer progression. Nat Med. 2011;17:320–329. - PMC - PubMed
    1. Gatenby R. Perspective: Finding cancer's first principles. Nature. 2012;491:S55. - PubMed
    1. Martincorena I, et al. Tumor evolution. High burden and pervasive positive selection of somatic mutations in normal human skin. Science. 2015;348:880–886. - PMC - PubMed
    1. Lopez-Otin C, Blasco MA, Partridge L, Serrano M, Kroemer G. The hallmarks of aging. Cell. 2013;153:1194–1217. - PMC - PubMed
    1. Campisi J, Andersen JK, Kapahi P, Melov S. Cellular senescence: a link between cancer and age-related degenerative disease? Semin Cancer Biol. 2011;21:354–359. - PMC - PubMed

Publication types

MeSH terms

Substances