. 2015 Aug 18:6:7967.
doi: 10.1038/ncomms8967.

Breaking immune tolerance by targeting Foxp3(+) regulatory T cells mitigates Alzheimer's disease pathology

Affiliations

Breaking immune tolerance by targeting Foxp3(+) regulatory T cells mitigates Alzheimer's disease pathology

Kuti Baruch et al. Nat Commun. .

Abstract

Alzheimer's disease (AD) is a neurodegenerative disorder in which chronic neuroinflammation contributes to disease escalation. Nevertheless, while immunosuppressive drugs have repeatedly failed in treating this disease, recruitment of myeloid cells to the CNS was shown to play a reparative role in animal models. Here we show, using the 5XFAD AD mouse model, that transient depletion of Foxp3(+) regulatory T cells (Tregs), or pharmacological inhibition of their activity, is followed by amyloid-β plaque clearance, mitigation of the neuroinflammatory response and reversal of cognitive decline. We further show that transient Treg depletion affects the brain's choroid plexus, a selective gateway for immune cell trafficking to the CNS, and is associated with subsequent recruitment of immunoregulatory cells, including monocyte-derived macrophages and Tregs, to cerebral sites of plaque pathology. Our findings suggest targeting Treg-mediated systemic immunosuppression for treating AD.


Figures

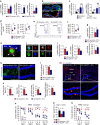
Figure 1
Figure 1. Choroid plexus gateway dysfunction in AD-Tg mice.
(a) mRNA expression levels for the genes icam1, vcam1, cxcl10 and ccl2, measured by RT-qPCR, in CPs isolated from 1-, 2-, 4- and 8-month-old AD-Tg mice, shown as fold-change compared with age-matched WT controls (n=6–8 per group; Student's t-test for each time point). (b) Representative microscopic images of CPs of 8-month-old AD-Tg mice and age-matched WT controls, immunostained for the epithelial tight junction molecule Claudin-1 (green), Hoechst nuclear staining (blue) and the integrin ligand, ICAM-1 (red; scale bar, 50 μm). Inserts showing Claudin-1 (green) and ICAM-1 (red) double staining. (cd) Representative micrographs (c), and quantification (d), of ICAM-1 immunoreactivity in human postmortem CP of young and aged non-CNS-diseased and AD patients (scale bar, 50 μm). (e) Flow cytometry analysis of IFN-γ-expressing immune cells (intracellularly stained, and pre-gated on CD45) in CPs of 8-month-old AD-Tg mice and age-matched WT controls. Shaded histogram represents isotype control (n=4–6 per group; Student's t-test). (f) mRNA expression levels of ifn-γ, measured by RT-qPCR, in CP tissues isolated from 4- and 8-month-old AD-Tg mice, compared with age-matched WT controls (n=5–8 per group; Student's t-test for each time point). In all panels, error bars represent mean±s.e.m.; *P<0.05; **P<0.01; ***P<0.001.
Figure 2
Figure 2. Transient conditional depletion of Foxp3+ Tregs activates the CP for leukocyte trafficking and mitigates AD pathology.
(a) AD-Tg/Foxp3-DTR+ and non-DTR-expressing AD-Tg littermates (AD-Tg/Foxp3-DTR; AD-Tg control) were treated with DTx for 4 consecutive days. mRNA levels of icam1, cxcl10 and ccl2 in the CP of 6-month-old AD-Tg/Foxp3-DTR+ mice, 1 day after last injection (n=6–8 per group; Student's t-test). (b) Representative images of the CP, immunostained for E-Cadherin (green), ICAM-1 (red) and Hoechst, in 6-month-old AD-Tg/Foxp3-DTR+ mice, 1 day after last DTx injection (Scale bar, 25 μm). (c) mRNA levels of icam1 and vcam1, in cultured CP cells, 24 h after addition of ex vivo differentiated Tregs, IFN-γ or their combination, relative to untreated (UT) cells (n=3–4 per group; one-way ANOVA followed by Newman–Keuls post hoc test; NS, not significant). (df) Flow cytometry analysis of the brain of 6-month-old AD-Tg/Foxp3-DTR+ mice, 3 weeks following last DTx injection, showing increased numbers of CD11bhigh/CD45high mo-MΦ and CD4+ T cells (d), and increased CD4+Foxp3+ (e,f) Treg frequencies (n=4–7 per group; Student's t-test). (g) mRNA levels of foxp3 and il10 in the brain of 6-month-old AD-Tg/Foxp3-DTR+ mice, 3 weeks after last DTx injection (n=6–8 per group; Student's t-test). (h,i) Representative images of Aβ (green) and CD3 (red) (h), or Foxp3 and IL-10 (in red) immunostaining (i) in 6-month-old AD-Tg/Foxp3-DTR+, 3 weeks following last DTx injection (scale bar, 10 μm). (j) mRNA levels of il-12p40 and tnf-a in the brain of 6-month-old AD-Tg/Foxp3-DTR+ mice, 3 weeks after last DTx injection (n=6–8 per group; Student's t-test). (k,l) Representative images (k) and analysis (l) of GFAP immunostaining in hippocampal sections of 6-month-old AD-Tg/Foxp3-DTR+ mice, 3 weeks following the last DTx injection (scale bar, 250 μm; n=3–5 per group; Student's t-test). (m,n) Representative images (m) and analysis (n), of 5-month-old AD-Tg/Foxp3-DTR+ mice brains, immunostained for Aβ (in red) and Hoechst, 3 weeks after the last DTx injection (scale bar, 250 μm). Mean Aβ area and plaque numbers in the dentate gyrus (DG) and the cortex fifth layer (n=5–6 per group; Student's t-test). (oq) Morris water maze (MWM) of 6-month-old AD-Tg/Foxp3-DTR+, 3 weeks after last DTx injection. DTx-treated mice showed improved spatial learning/memory in the acquisition (o), probe (p) and reversal (q) phases, relative to AD-Tg controls (n=7–9 per group; two-way repeated measures ANOVA followed by Bonferroni post hoc test; *P<0.05 for overall acquisition, probe and reversal). In all panels, error bars represent mean±s.e.m.; *P<0.05; **P<0.01; ***P<0.001.
Figure 3
Figure 3. Immunomodulation that reduces systemic Treg levels activates the CP for mo-MΦ trafficking and mitigates AD pathology.
(a) mRNA expression levels of ifn-γ, measured by RT-qPCR, in CPs isolated from 6- and 12-month-old APP/PS1 AD-Tg mice, compared with age-matched WT controls (n=5–8 per group; Student's t-test). (b,c) 5XFAD AD-Tg mice were treated with either weekly GA or vehicle (PBS), and were examined at the end of the 1st week of the administration regimen (after a total of two GA injections). Flow cytometry analysis of CD4+Foxp3+ splenocyte frequencies (b) and CP-resident IFN-γ-expressing immune cells (intracellularly stained and pre-gated on CD45) (c), in treated 6-month-old AD-Tg mice, compared with age-matched WT controls (n=4–6 per group; one-way ANOVA followed by Newman–Keuls post hoc analysis). (d) mRNA expression levels for the genes icam1, cxcl10 and ccl2, measured by RT-qPCR, in CPs of 4-month-old AD-Tg mice, treated with either weekly GA or vehicle, and examined either at the end of the 1st or 4th week of the weekly GA regimen (n=6–8 per group; one-way ANOVA followed by Newman–Keuls post hoc analysis). (e) Representative microscopic images of 6-month-old AD-Tg mice following weekly GA, stained for ICAM-1 (in red) and Claudin-1 (in green; epithelial tight junctions), showing elevated levels of ICAM-1 immunoreactivity, as compared with vehicle-treated AD-Tg (scale bar, 50 μm). (f) Representative images of brain sections from 6-month-old AD-Tg/CX3CR1GFP/+ BM chimeras following weekly GA. CX3CR1GFP cells were localized at the CP of the third ventricle (3V; i), the adjacent ventricular spaces (ii), and the CP of the lateral ventricles (LV; iii) in AD-Tg mice treated with weekly GA (scale bar, 25 μm). (g) Representative orthogonal projections of confocal z-axis stacks, showing co-localization of GFP+ cells (in green) with the myeloid marker, CD68 (in red), in the CP of 7-month-old AD-Tg/CX3CR1GFP/+ mice treated with weekly GA, but not in control PBS-treated AD-Tg/CX3CR1GFP/+ mice (scale bar, 25 μm). (h) CX3CR1GFP cells (in green) are co-localized with the myeloid marker IBA-1 in brains of GA-treated AD-Tg/CX3CR1GFP/+ mice in the vicinity of Aβ plaques, and co-express the myeloid marker, IBA-1 (in red). Arrowheads indicate co-labelled IBA-1+/GFP+ cells (scale bar, 25 μm). In all panels, error bars represent mean±s.e.m.; *P<0.05; **P<0.01; ***P<0.001.
Figure 4
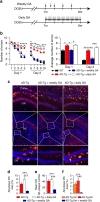
Figure 4. Distinct effects of weekly versus daily-administration regimens of GA on disease pathology and cognitive performance in AD-Tg mice.
(a) Schematic representation of daily-GA treatment regimen compared with the weekly GA regimen. In the daily-GA-treated group, mice were s.c. injected daily with 100 μg of GA for a period of 1 month (DOB, day of birth). (b) Cognitive performance of daily-GA and weekly GA-treated 7-month-old AD-Tg mice, compared with age-matched WT and untreated AD-Tg mice, as assessed by the average numbers of errors per day in the RAWM learning and memory task (n=6–8 per group; two-way repeated measures ANOVA followed by Bonferroni post hoc analysis, and one-way ANOVA followed by Newman–Keuls post hoc analysis for individual pair comparisons of average numbers of errors). (c) Representative microscopic images of the cerebral cortex and the hippocampus (HC) of untreated AD-Tg, and daily or weekly GA-treated AD-Tg mice, immunostained for Aβ plaques (red) and with Hoechst nuclear staining (blue) (scale bar, 250 μm). (d,e) Quantification of Aβ plaque size and numbers (per 6-μm slices) in GA-treated (daily-GA and weekly GA groups) and untreated AD-Tg mice. Weekly GA-treated AD-Tg mice showed reduction in Aβ plaque load as a percentage of the total area of their hippocampal dentate gyrus (DG), and in mean Aβ plaque numbers (n=6 per group; one-way ANOVA followed by Newman–Keuls post hoc analysis). (f) Five-month-old AD-Tg were either left untreated for 1 month, and evaluated for their plaque pathology, or treated for 1 month with weekly GA and then examined. Mean Aβ plaque area as percentage of the dentate gyrus showed clearance of Aβ plaques in the GA-treated mice group (n=3–4 per group; one-way ANOVA followed by Newman–Keuls post hoc analysis). In all panels, error bars represent mean±s.e.m.; *P<0.05; **P<0.01; ***P<0.001.
Figure 5
Figure 5. Interference with Foxp3+ Treg cell activity using p300 inhibitor mitigates AD pathology.
(a,b) Aged WT mice (18 months) were used to test the effect of p300i on IFN-γ-expressing cell levels in the CP and spleen. Mice were treated with either p300i or vehicle (DMSO) for a period of 1 week, and examined a day after cessation of treatment. Representative flow cytometry plots showing elevation in the frequencies of CD4+ T cells expressing IFN-γ in the spleen (a), and IFN-γ-expressing immune cell numbers in the CP (b), following p300i treatment. (ce) Representative microscopic images (c), and quantitative analysis, of Aβ plaque burden in the brains of 10-month-old AD-Tg mice that received either p300i or vehicle (DMSO) for a period of 1 week, and were subsequently examined after 3 additional weeks. Brains were immunostained for Aβ plaques (red) and by Hoechst nuclear staining (n=5 per group; Scale bar, 250 μm). Mean Aβ plaque area and plaque numbers were quantified in the hippocampal DG (d) and the fifth layer of the cerebral cortex (e), in 6 μm brain slices (n=5–6 per group; Student's t-test). (fh) Schematic representation (f) of the p300i treatment (or DMSO, vehicle) regimen to the different groups of AD-Tg mice at the age of 7 months, in either one or two treatment courses. Change in mean of Aβ plaque percentage coverage of the cerebral cortex (fifth layer) (g), and the change in mean cerebral soluble Aβ1-40 and Aβ1-42 protein levels (h), relative to the untreated AD-Tg group (Aβ1-40 and Aβ1-42 mean level in untreated group, 90.5±11.2 and 63.8±6.8 pg/mg total portion, respectively; n=5–6 per group; one-way ANOVA followed by Newman–Keuls post hoc analysis). In all panels, error bars represent mean±s.e.m.; *P<0.05; **P<0.01.
Figure 6
Figure 6. Augmenting systemic immune suppression in AD-Tg mice exacerbates disease pathology.
(a,b) Representative flow cytometry plots (a), and quantitative analysis (b), showing elevation in frequencies of CD4+/Foxp3+/CD25+ Treg splenocytes in 5-month-old AD-Tg mice that received either ATRA or vehicle (DMSO) for a period of 1 week (n=5 per group; Student's t-test). (cf) Representative microscopic images (c) and quantitative analysis (df) of Aβ plaque burden and astrogliosis in the brains of AD-Tg mice that were treated at the age of 5 months with either ATRA or vehicle (DMSO) for a period of 1 week, and subsequently examined after 3 additional weeks. Brains were immunostained for Aβ plaques (in red), GFAP (marking astrogliosis, in green) and by Hoechst nuclear staining (n=4–5 per group; Scale bar, 250 μm). Mean Aβ plaque area and plaque numbers were quantified in the hippocampal DG and the fifth layer of the cerebral cortex, and GFAP immunoreactivity was measured in the hippocampus (in 6 μm brain slices; n=5–6 per group; Student's t-test). (g) Levels of soluble Aβ1–40 and Aβ1–42, quantified by ELISA, in the cerebral brain parenchyma of AD-Tg mice, that were treated at the age of 5-months with either ATRA or vehicle (DMSO) for a period of 1 week, and subsequently examined after 3 additional weeks (n=5–6 per group; Student's t-test). (h) Cognitive performance in the RAWM task of AD-Tg mice, which were treated at the age of 5-months with either ATRA or vehicle (DMSO) for a period of 1 week, and subsequently examined after 3 additional weeks (n=5 per group; two-way repeated measures ANOVA followed by Bonferroni post hoc for individual pair comparisons). In all panels, error bars represent mean±s.e.m.; *P<0.05; **P<0.01; ***P<0.001.

Similar articles

Cited by

References

    1. Akiyama H. et al.. Inflammation and Alzheimer's disease. Neurobiol. Aging 21, 383–421 (2000). - PMC - PubMed
    1. Hardy J. & Selkoe D. J. The amyloid hypothesis of Alzheimer's disease: progress and problems on the road to therapeutics. Science 297, 353–356 (2002). - PubMed
    1. Weiner H. L. & Frenkel D. Immunology and immunotherapy of Alzheimer's disease. Nat. Rev. Immunol. 6, 404–416 (2006). - PubMed
    1. Anti-inflammatory drugs fall short in Alzheimer's disease. Nat. Med. 14, 916 (2008). - PubMed
    1. Group A. R. et al.. Naproxen and celecoxib do not prevent AD in early results from a randomized controlled trial. Neurology 68, 1800–1808 (2007). - PubMed

Publication types

MeSH terms