. 2015 Aug 7;16(1):152.
doi: 10.1186/s13059-015-0728-8.

Bipartite structure of the inactive mouse X chromosome

Affiliations

Bipartite structure of the inactive mouse X chromosome

Xinxian Deng et al. Genome Biol. .

Abstract

Background: In mammals, one of the female X chromosomes and all imprinted genes are expressed exclusively from a single allele in somatic cells. To evaluate structural changes associated with allelic silencing, we have applied a recently developed Hi-C assay that uses DNase I for chromatin fragmentation to mouse F1 hybrid systems.

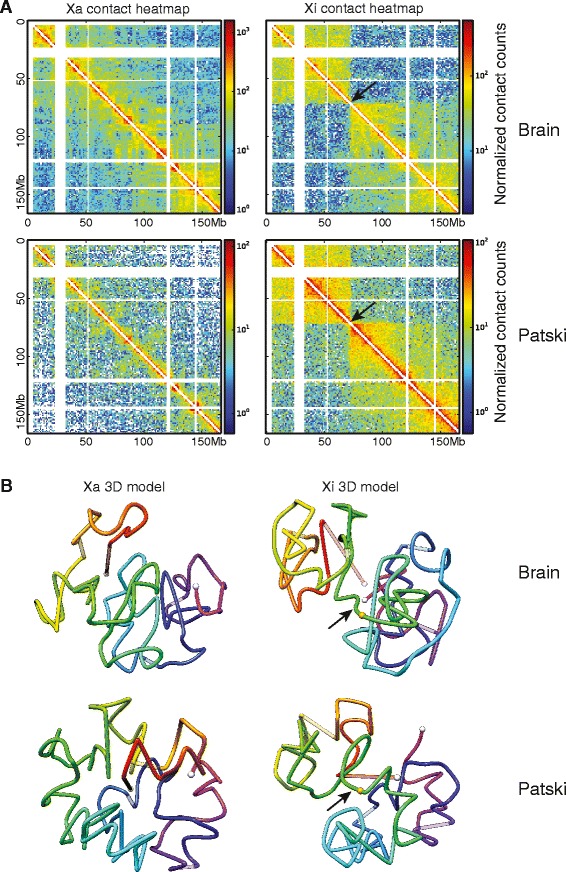
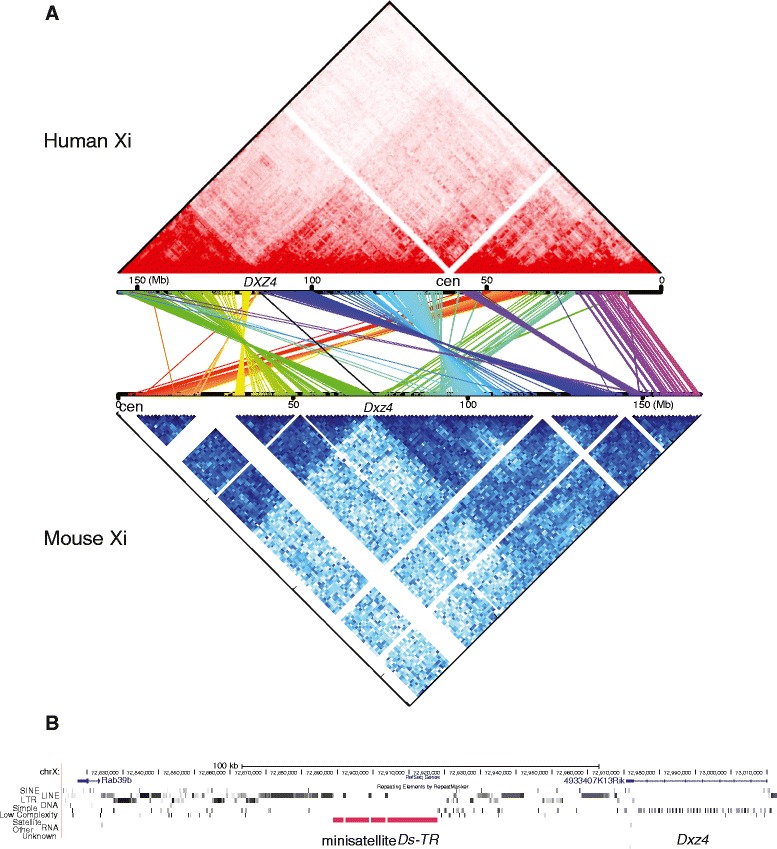
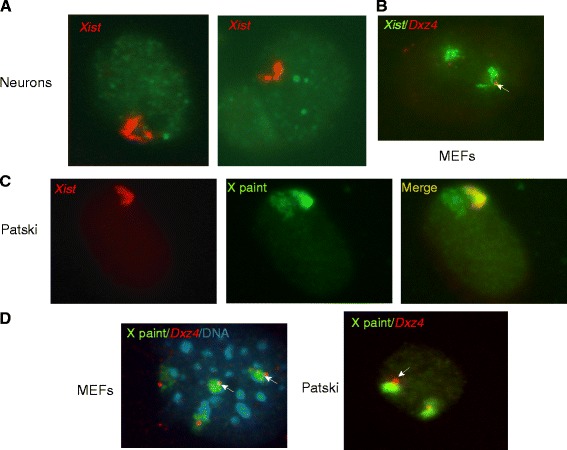
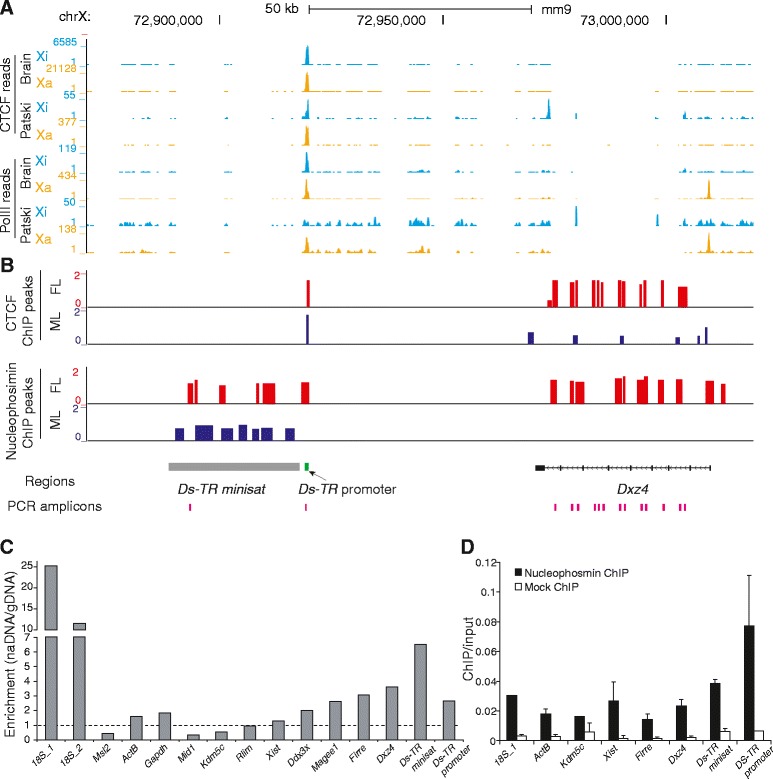
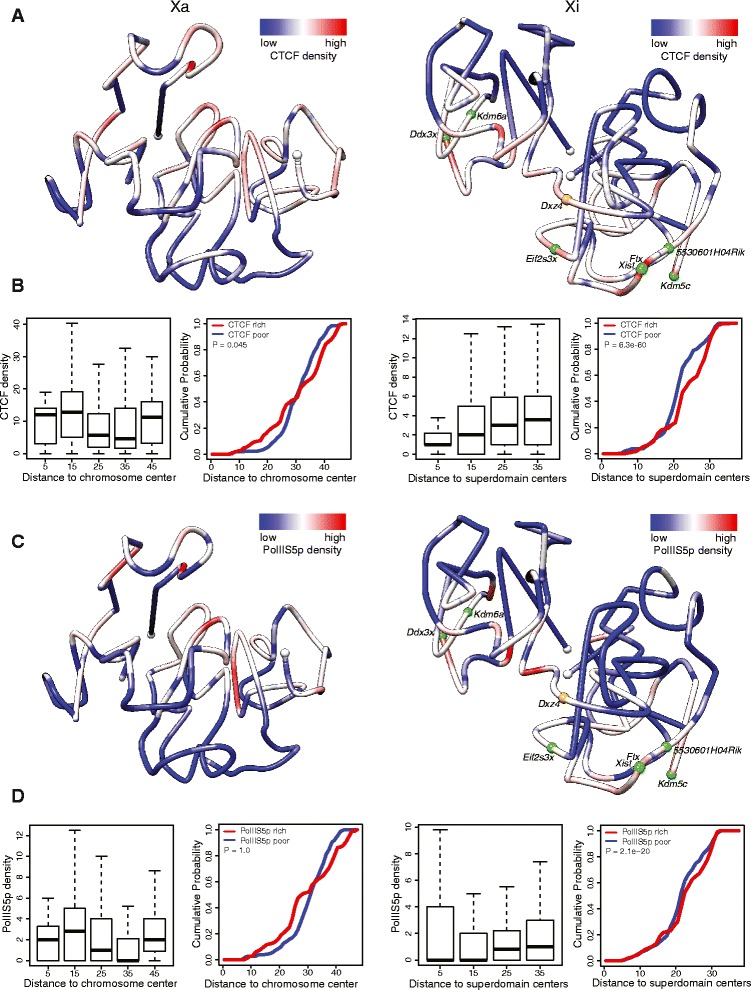
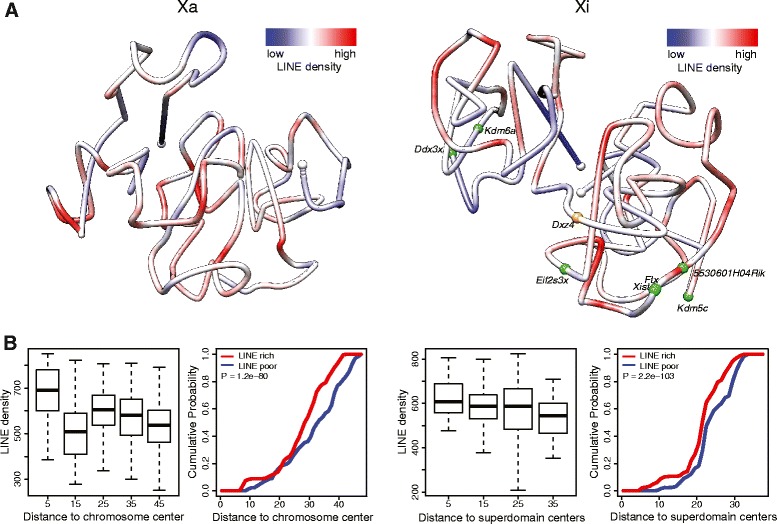
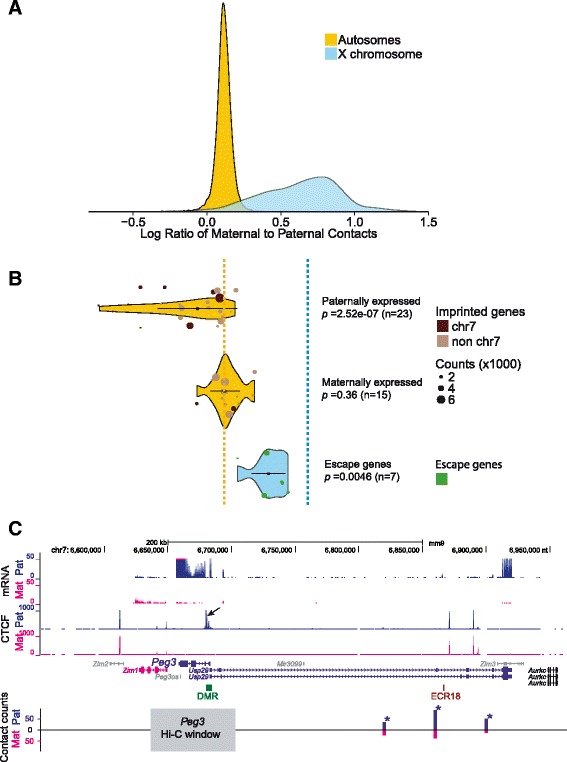
Results: We find radically different conformations for the two female mouse X chromosomes. The inactive X has two superdomains of frequent intrachromosomal contacts separated by a boundary region. Comparison with the recently reported two-superdomain structure of the human inactive X shows that the genomic content of the superdomains differs between species, but part of the boundary region is conserved and located near the Dxz4/DXZ4 locus. In mouse, the boundary region also contains a minisatellite, Ds-TR, and both Dxz4 and Ds-TR appear to be anchored to the nucleolus. Genes that escape X inactivation do not cluster but are located near the periphery of the 3D structure, as are regions enriched in CTCF or RNA polymerase. Fewer short-range intrachromosomal contacts are detected for the inactive alleles of genes subject to X inactivation compared with the active alleles and with genes that escape X inactivation. This pattern is also evident for imprinted genes, in which more chromatin contacts are detected for the expressed allele.

Conclusions: By applying a novel Hi-C method to map allelic chromatin contacts, we discover a specific bipartite organization of the mouse inactive X chromosome that probably plays an important role in maintenance of gene silencing.


Figures

Fig. 1
Fig. 1
Bipartite structure of the inactive X chromosome in mouse F1 brain and Patski cells. a Allelic intrachromosomal chromatin contact heatmaps of the Xa and Xi based on SNP reads at 1 Mb resolution obtained by DNase Hi-C and in situ DNase Hi-C in female F1 brain (spretus Xi) and in Patski cells (BL6 Xi). b 3D models of the Xa and Xi built on contact frequency at 1 Mb resolution. White dots represent chromosome ends; lines are colored from red to purple in the direction from centromere to telomere; unmappable regions (corresponding to the white strips in the heatmaps) are set at 75 % transparency; the arrow indicates the hinge region of transition between the two condensed superdomains; the orange dot indicates the position of Dxz4
Fig. 2
Fig. 2
Comparison between superdomains on the Xi in human and mouse. a Topological domains on the Xi compared between human and mouse. An allelic contact map of the human Xi generated based on published Hi-C data obtained in human lymphoblastoid cell line GM12878 [6] is shown on top (red) and aligned to a contact map of the mouse Xi based on our data obtained in mouse F1 brain by DNase Hi-C and in situ DNase Hi-C at bottom (blue). The Xi maps are compared based on the position of homologous genes between human (hg19) and mouse (mm9) (see “Materials and methods”). The human and mouse X chromosomes were oriented such that the position of DXZ4/Dxz4 and the adjacent PLS3/Pls3 genes are in the same orientation at the right extremity of the hinge region. Each pair of homologous genes is connected by a colored line between the contact maps and genes within blocks of conserved regions are indicated in a similar color. Several inversions and transpositions are apparent and the content of the superdomains is only partially conserved. b Gene content of the hinge region in mouse (~72.8–72.9 Mb). Dxz4 is located at one extremity of the hinge region, which also contains the minisatellite Ds-TR. The size and location of the hinge region were estimated as described in the text (see also Additional file 5)
Fig. 3
Fig. 3
FISH analysis of the mouse Xi. a Examples of nuclei after RNA-FISH for Xist (red) in neuronal cells show a bipartite structure for the Xi, consistent with the 3D structure detected by DNase Hi-C. b DNA-FISH for Dxz4 (red) following RNA-FISH for Xist (green) in MEFs shows that Dxz4 is located between the two regions coated by Xist RNA, consistent with Dxz4 location at the hinge region. Note that there are two inactive Xs marked by Xist RNA clouds in this MEF line. c While RNA-FISH for Xist (red) in Patski cells shows the bipartite structure, DNA-FISH using a mouse X chromosome paint probe (green) shows only a condensed structure for the Xi. d DNA-FISH using both a mouse X paint (green) and Dxz4 (red) shows that Dxz4 is located at the edge of the condensed Xi in MEFs and Patski cells. MEF nucleus is stained with DAPI (blue). The arrows mark Dxz4 on the Xi
Fig. 4
Fig. 4
The mouse hinge region binds CTCF and associates with the nucleolus. a Allelic profiles of CTCF and PolII binding in F1 brain and Patski cells are shown for the Xi (blue) and Xa (orange) at the minisatellite Ds-TR, its adjacent promoter region, and at Dxz4. The Ds-TR promoter binds CTCF on the Xa and Xi. No reads were mapped within the minisatellite Ds-TR or at Dxz4 due to low mappability. Different y-axis scales were used for the Xi and Xa in order to show the significant peaks on the Xi, given that there are about threefold more reads at the Ds-TR promoter peak region on the Xa compared with the Xi. b ChIP-chip analysis for CTCF and nucleophosmin in female (FL) and male liver (ML). CTCF binds at the Ds-TR promoter region in female and male liver, and at Dxz4 in female but not male liver. Nucleophosmin binds to Ds-TR, its promoter, and Dxz4 in female liver, while in male liver lower binding is present at Ds-TR. c Enrichment in DNA sequences representing nucleolus-associated domains measured by quantitative PCR in the nucleolus-associated fraction (naDNA) versus genomic DNA (gDNA) is seen at the minisatellite Ds-TR, its promoter and at Dxz4 in Patski cells. The positions of quantitative PCR amplicons used to measure enrichment at these three regions are indicated in (b). Enrichment at control autosomal and X-linked genes is shown. Two primer pairs for different regions of the 18S ribosomal RNA gene known to be associated with the nucleolus serve as positive controls. The dashed line indicates no enrichment (naDNA/gDNA ratio of 1). d Quantitative PCR analysis of chromatin immunoprecipitation (ChIP) for nucleophosmin confirms high enrichment at Ds-TR and adjacent promoter. Error bars indicate s.e.m.
Fig. 5
Fig. 5
Distribution of CTCF and PolII binding on 3D models of the Xa and Xi. a 3D models of the Xa (left) and Xi (right) at 1 Mb resolution in mouse F1 brain colored to display the density of allelic CTCF binding (red indicates more binding). CTCF binding tends to be denser at the periphery of the Xi 3D structure, possibly on one face of the model. White dots indicate chromosome ends, orange dot Dxz4, green dots escape genes. b Box plots for the Xa (left) and the Xi (right) showing allele-specific CTCF-peak density at 1 Mb resolution grouped by the corresponding distances of the 1 Mb regions to the Xa chromosomal center or to the Xi superdomain centers, and empirical cumulative curves of 1 Mb regions binned based on their distance to the Xa chromosomal center or to the Xi superdomain centers for the CTCF-rich (red line, top 25 % CTCF-binding regions) and CTCF-poor regions (blue line, bottom 25 %). The empirical cumulative density as a function of the distance to the chromosome or superdomain centers for the feature-rich and feature-poor regions were compared using one-side Wilcoxon rank-sum test. c, d Same analysis for allelic PolII occupancy. Like CTCF, PolII occupancy tends to be higher at the periphery of the Xi 3D structure
Fig. 6
Fig. 6
Distribution of L1 elements on 3D models of the Xa and Xi. a 3D models of the Xa and Xi at 1 Mb resolution in mouse F1 brain colored to display the density of L1 elements (red indicates more L1 elements). L1 elements tend to be located at the inside of the Xi 3D structure. b Box plots for the Xa (left) and the Xi (right) showing L1 density at 1 Mb resolution grouped by the corresponding distances of the 1 Mb regions to the Xa chromosomal center or to the Xi superdomain centers, and empirical cumulative curves of 1 Mb regions binned based on their distance to the Xa chromosomal center or to the Xi superdomain centers for the L1-rich (red line, top 25 %) and L1-poor regions (blue line, bottom 25 %). The empirical cumulative density as a function of the distance to the chromosome or superdomain centers for the feature-rich and feature-poor regions were compared using one-side Wilcoxon rank-sum test
Fig. 7
Fig. 7
Intrachromosomal contacts at X-linked genes and at imprinted genes. a Distribution of maternal-to-paternal allelic contacts at autosomal genes and X-linked genes determined by DNase Hi-C at 40 kb resolution in mouse F1 brain in which the paternal autosomes and the Xi are from spretus. Compared with autosomal genes, X-linked genes show high maternal-to-paternal ratios, indicating less frequent contacts at silent genes on the Xi. b Violin plots show the distribution of maternal-to-paternal allelic contacts at maternally and paternally imprinted genes and at genes that escape XCI at 40 kb resolution in F1 brain. Compared with other autosomal genes paternally expressed imprinted genes have a lower maternal-to-paternal contact ratio as shown by a long tail. These genes are preferentially located on chromosome 7 and when they are removed from the analysis, the shape of the distribution changes (as shown by a shorter tail in Additional file 8). The chromosomal location of imprinted genes is indicated by dots color-coded to indicate the chromosome of origin. The distribution of maternal-to-paternal allelic contacts for genes that escape XCI differs from the rest of X-linked genes, reflecting a higher number of contacts at expressed alleles. Dotted lines indicate median ratios of maternal-to-paternal contacts at autosomal and X-linked genes. c Significant contacts are detected between the imprinted paternally expressed gene Peg3 and neighboring regions on the paternal allele. Allelic RNA-seq confirms Peg3 expression on the paternal allele. Allelic CTCF profiles show binding to the differentially methylated region (DMR) adjacent to Peg3 promoter region only on the paternal allele (arrow), presumably facilitating the formation of contacts between the Peg3 promoter region and the distant enhancer ECR18 (evolutionarily conserved region 18) [63]. The needle plot of contacts counts between a 40 kb window that overlaps Peg3 (grey bar) and nearby regions shows more interactions on the paternal (blue, Pat) than the maternal allele (pink, Mat). Genes with maternal or paternal expression are colored in pink or blue, non-imprinted genes in black, and non-expressed genes in grey. Contact regions showing significant allelic biases are marked by asterisks

Similar articles

Cited by

References

    1. Bickmore WA. The spatial organization of the human genome. Annu Rev Genomics Hum Genet. 2013;14:67–84. doi: 10.1146/annurev-genom-091212-153515. - DOI - PubMed
    1. Lyon M. Gene action in the X-chromosome of the mouse (Mus musculus L) Nature. 1961;190:372–3. doi: 10.1038/190372a0. - DOI - PubMed
    1. Bartolomei MS, Ferguson-Smith AC. Mammalian genomic imprinting. Cold Spring Harb Perspect Biol. 2011;3:a002592. doi: 10.1101/cshperspect.a002592. - DOI - PMC - PubMed
    1. Nora EP, Lajoie BR, Schulz EG, Giorgetti L, Okamoto I, Servant N, et al. Spatial partitioning of the regulatory landscape of the X-inactivation centre. Nature. 2012;485:381–5. doi: 10.1038/nature11049. - DOI - PMC - PubMed
    1. Splinter E, de Wit E, Nora EP, Klous P, van de Werken HJ, Zhu Y, et al. The inactive X chromosome adopts a unique three-dimensional conformation that is dependent on Xist RNA. Genes Dev. 2011;25:1371–83. doi: 10.1101/gad.633311. - DOI - PMC - PubMed

Publication types