Comparative Study
. 2015 Jul 30;11(7):e1005063.
doi: 10.1371/journal.ppat.1005063. eCollection 2015 Jul.

An In-Depth Comparison of Latency-Reversing Agent Combinations in Various In Vitro and Ex Vivo HIV-1 Latency Models Identified Bryostatin-1+JQ1 and Ingenol-B+JQ1 to Potently Reactivate Viral Gene Expression

Affiliations
Comparative Study

An In-Depth Comparison of Latency-Reversing Agent Combinations in Various In Vitro and Ex Vivo HIV-1 Latency Models Identified Bryostatin-1+JQ1 and Ingenol-B+JQ1 to Potently Reactivate Viral Gene Expression

Gilles Darcis et al. PLoS Pathog. .

Abstract

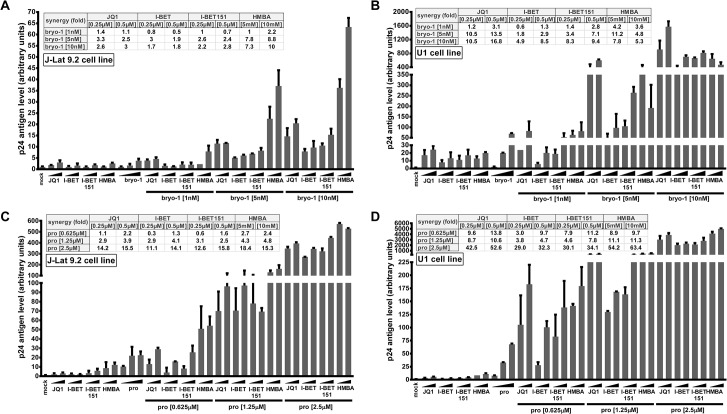
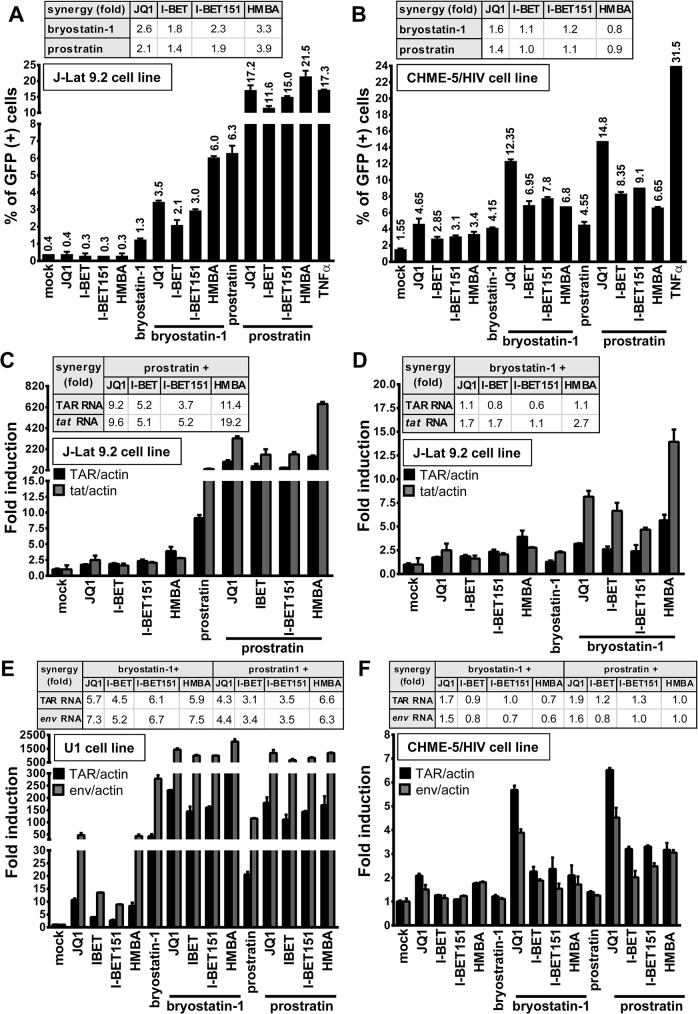
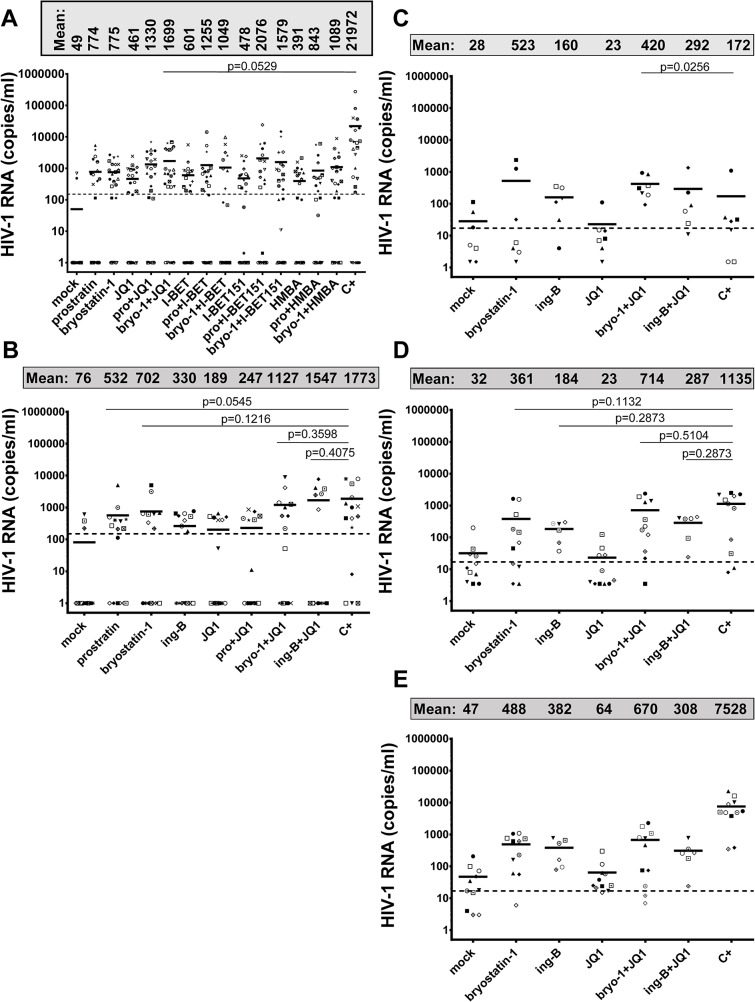
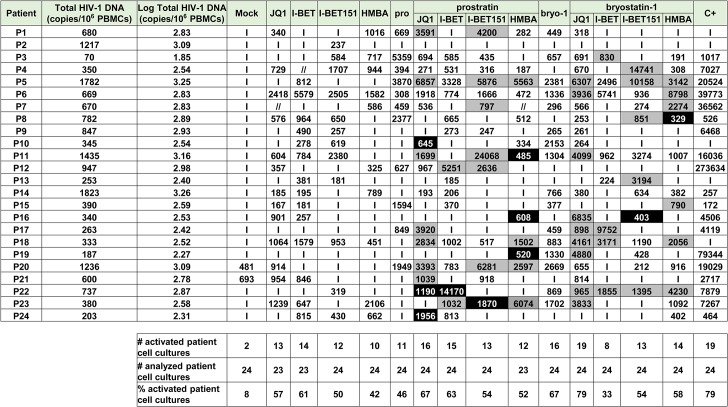
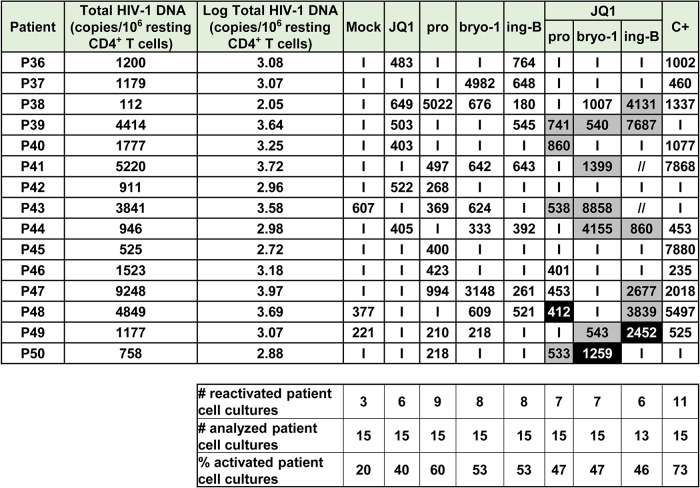
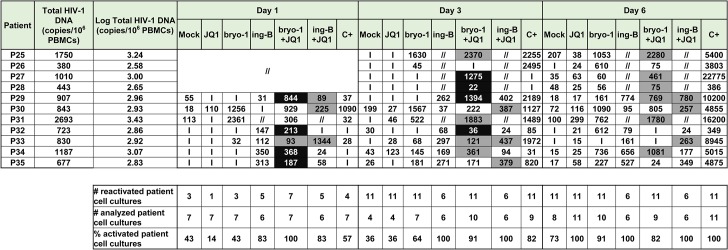
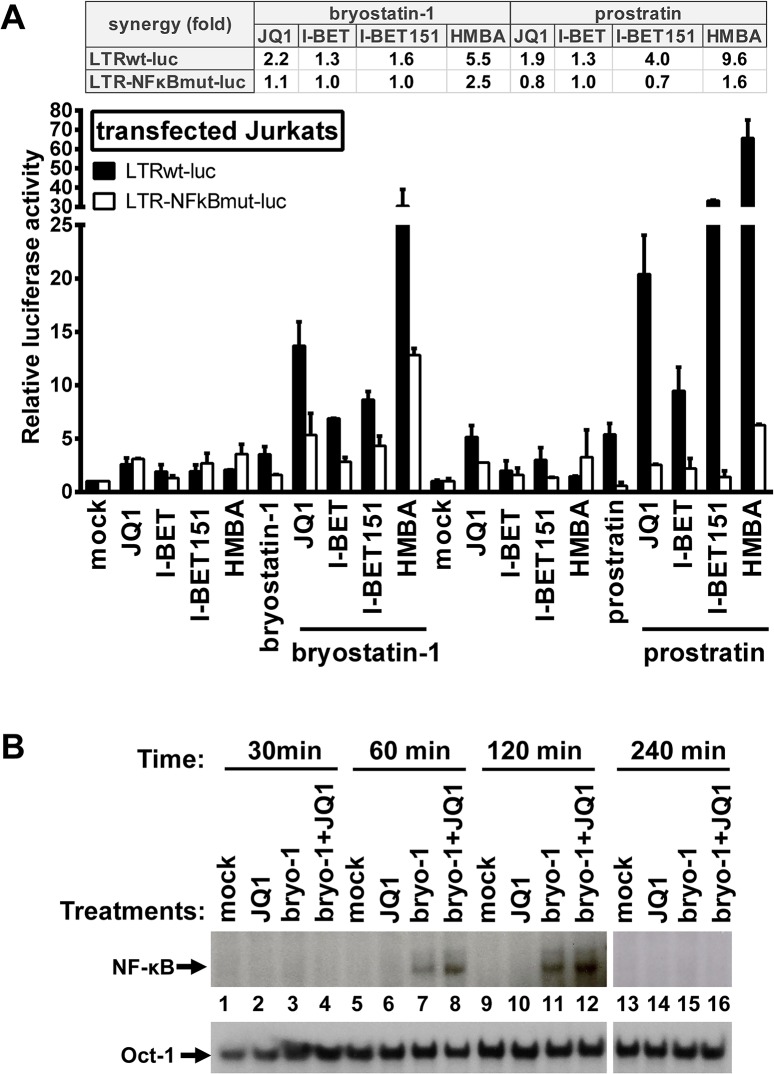
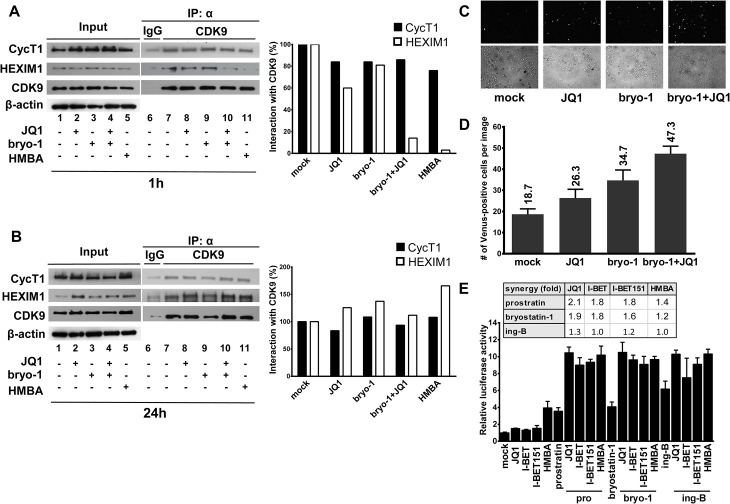
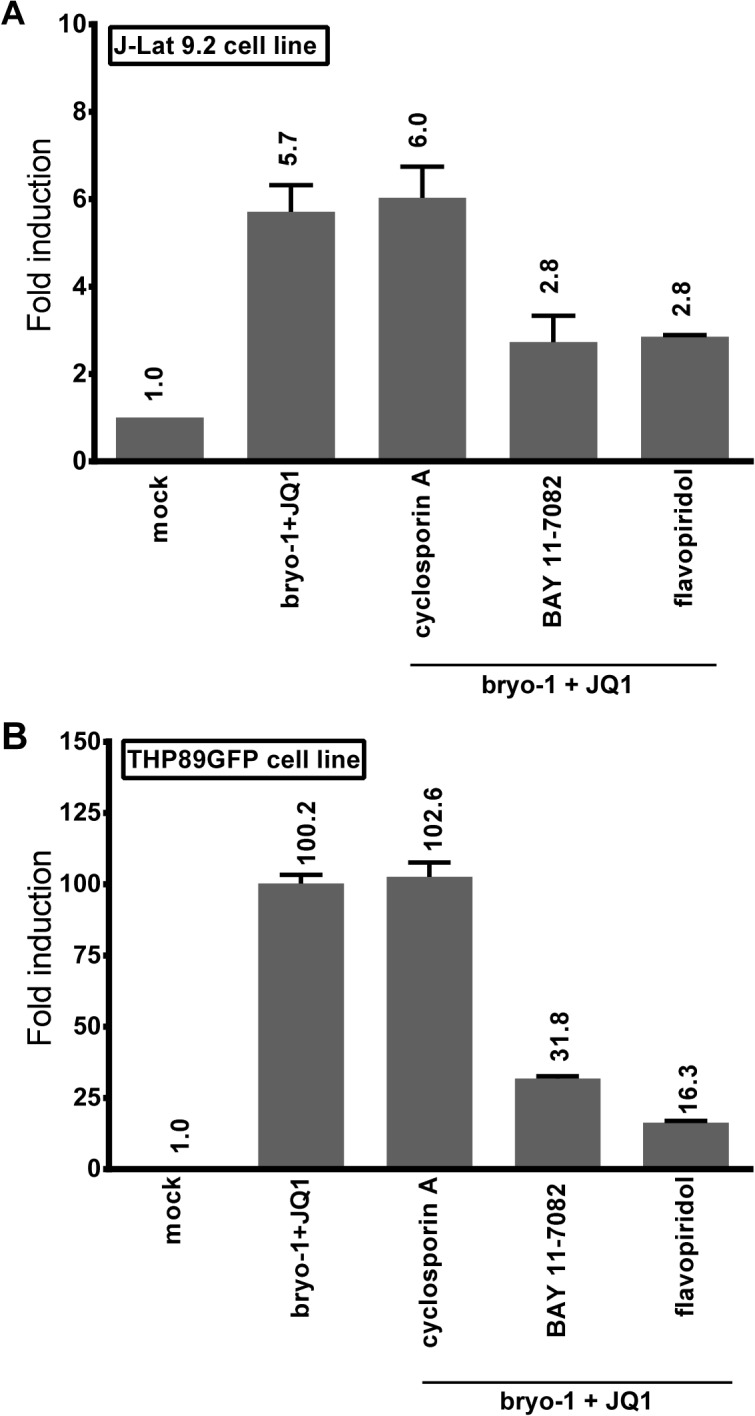
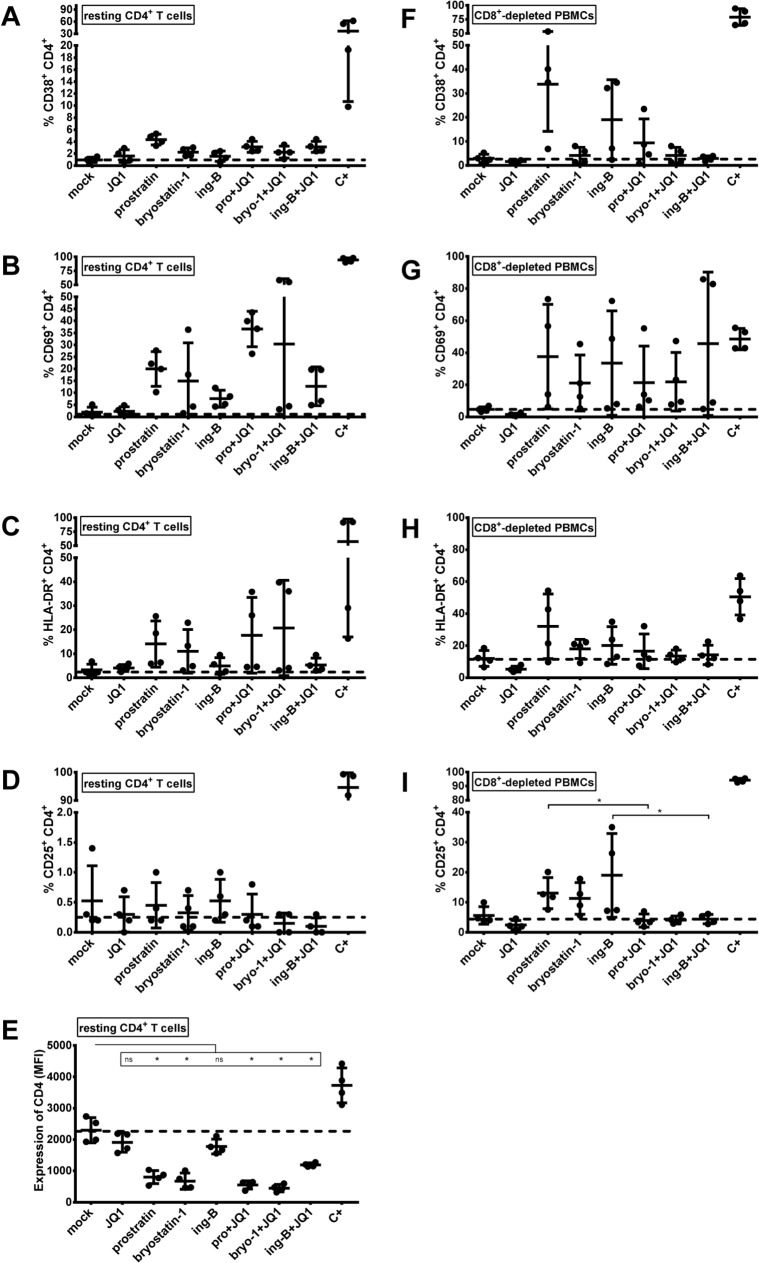
The persistence of latently infected cells in patients under combinatory antiretroviral therapy (cART) is a major hurdle to HIV-1 eradication. Strategies to purge these reservoirs are needed and activation of viral gene expression in latently infected cells is one promising strategy. Bromodomain and Extraterminal (BET) bromodomain inhibitors (BETi) are compounds able to reactivate latent proviruses in a positive transcription elongation factor b (P-TEFb)-dependent manner. In this study, we tested the reactivation potential of protein kinase C (PKC) agonists (prostratin, bryostatin-1 and ingenol-B), which are known to activate NF-κB signaling pathway as well as P-TEFb, used alone or in combination with P-TEFb-releasing agents (HMBA and BETi (JQ1, I-BET, I-BET151)). Using in vitro HIV-1 post-integration latency model cell lines of T-lymphoid and myeloid lineages, we demonstrated that PKC agonists and P-TEFb-releasing agents alone acted as potent latency-reversing agents (LRAs) and that their combinations led to synergistic activation of HIV-1 expression at the viral mRNA and protein levels. Mechanistically, combined treatments led to higher activations of P-TEFb and NF-κB than the corresponding individual drug treatments. Importantly, we observed in ex vivo cultures of CD8+-depleted PBMCs from 35 cART-treated HIV-1+ aviremic patients that the percentage of reactivated cultures following combinatory bryostatin-1+JQ1 treatment was identical to the percentage observed with anti-CD3+anti-CD28 antibodies positive control stimulation. Remarkably, in ex vivo cultures of resting CD4+ T cells isolated from 15 HIV-1+ cART-treated aviremic patients, the combinations bryostatin-1+JQ1 and ingenol-B+JQ1 released infectious viruses to levels similar to that obtained with the positive control stimulation. The potent effects of these two combination treatments were already detected 24 hours post-stimulation. These results constitute the first demonstration of LRA combinations exhibiting such a potent effect and represent a proof-of-concept for the co-administration of two different types of LRAs as a potential strategy to reduce the size of the latent HIV-1 reservoirs.


Conflict of interest statement

I have read the journal's policy and the authors of this manuscript have the following competing interests: LFP is a share holder of Kyolab laboratories. He also has a contact with Amazonia Fitomedicamentos to develop the ingenol derivatives. This does not alter the authors' adherence to Plos Pathogens policies on sharing data and materials.

Figures

Fig 1
Fig 1. Compounds releasing active P-TEFb and PKC agonists act synergistically to increase HIV-1 production.
J-Lat 9.2 (panels A and C) and U1 (panels B and D) cell lines were mock-treated or treated with two doses of JQ1, I-BET, I-BET151, HMBA alone or in combination with three doses of either bryostatin-1 or prostratin as indicated. At 24 hours post-treatment, viral production was estimated by measuring CA-p24 antigen concentration in culture supernatants. The mock-treated value was arbitrarily set at a value of 1. Means and standard errors of the means from duplicate samples are indicated. One representative experiment from three is represented. For each combinatory treatment, the fold-synergy was calculated by dividing the effect observed after co-treatments by the sum of the effects obtained after the individual treatments.
Fig 2
Fig 2. PKC agonist+BETi/HMBA combined treatments increase HIV-1 expression in a higher proportion of cells than the drug alone and synergistically enhance viral transcription.
The J-Lat 9.2 cells (panel A) or CHME-5/HIV microglial cells (panel B) harbor latent HIV-1 provirus containing gfp gene. The cells were mock-treated, treated with JQ1 (0.5μM), I-BET (0.5μM), I-BET151 (0.5μM), HMBA (5mM), bryostatin-1 (10nM) and prostratin (2.5μM) alone or in combination as indicated. At 24 hours post-treatment, cells were analyzed by flow cytometry to quantify the proportion of cells expressing GFP. Means and standard errors of the means from duplicate samples are indicated. One representative experiment from three is represented. For each combinatory treatment, the fold-synergy was calculated by dividing the effect observed after co-treatments by the sum of the effects obtained from individual treatments. Panels C-F. Measurement of initiated and elongated HIV-1 transcripts following drug treatment. Total RNA was extracted from J-Lat 9.2 (panels C and D), U1 (panel E), CHME-5/HIV (panel F) cells which were mock-treated or treated with BETi, HMBA, bryostatin-1 and prostratin for 24 hours at concentrations described in Fig 2A and 2B. Initiated (primers TAR) or elongated (primers tat or env) transcripts were quantified by quantitative real-time RT-PCR. Values were normalized using β-actin gene primers and were presented as fold inductions relative to the values measured in mock-treated cells, which were arbitrarily set at a value of 1. Means and standard errors of the means from duplicate samples are indicated. One representative experiment from two is represented. For each combinatory treatment, the fold-synergy was calculated by dividing the effect observed after co-treatments by the sum of the effects after the individual treatments.
Fig 3
Fig 3. PKC agonists and compounds releasing active P-TEFb induce HIV-1 recovery in CD8+-depleted PBMCs and in resting CD4+ T cells from cART-treated HIV+ aviremic patients.
Panel A. Ex vivo cultures of CD8+-depleted PBMCs purified from blood of 24 patients were mock-treated, treated with anti-CD3+anti-CD28 antibodies (C+), prostratin (0.5μM), bryostatin-1 (5nM), JQ1 (0.25μM), I-BET (0.25μM), I-BET151 (0.25μM) or HMBA (5mM) alone or in combination as indicated. Six days post-treatment, concentrations of genomic viral RNA were measured in culture supernatants. Statistical comparisons to positive control are indicated if p<0.05 (superiority to positive control). Panel B. Ex vivo cultures of resting CD4+ T cells purified from blood of 15 patients were mock-treated, treated with anti-CD3+anti-CD28 antibodies (C+), prostratin (0.5μM), bryostatin-1 (5nM), ing-B (10nM), JQ1 (0.25μM), alone or in combination as indicated. Six days post-treatment, concentrations of genomic viral RNA in culture supernatants were determined. Statistical comparisons to positive control are indicated if p>0.05 (non-inferiority). Panels A and B. Dashed line indicates the 150 HIV-1 RNA copies/ml limit of detection. Panel C. Ex vivo cultures of CD8+-depleted PBMCs purified from blood of 7 HIV+ patients were mock-treated, treated with anti-CD3+anti-CD28 antibodies (C+), bryostatin-1 (5nM), JQ1 (0.25μM) or ing-B (10nM) alone or in combination in the presence of cART. One day post-treatment, concentrations of genomic viral RNA in culture supernatants were determined. Statistical comparisons to positive control are indicated if p<0.05 (superiority to positive control). Panel D. Ex vivo cultures of CD8+-depleted PBMCs purified from blood of 11 HIV+ patients were mock-treated, treated with anti-CD3+anti-CD28 antibodies (C+), bryostatin-1 (5nM), JQ1 (0.25μM) or ing-B (10nM) alone or in combination in the presence of cART. Three days post-treatment, concentrations of genomic viral RNA in culture supernatants were determined. Statistical comparisons to positive control are indicated if p>0.05 (non-inferiority to positive control). Panel E. Ex vivo cultures of CD8+-depleted PBMCs purified from blood of 11 HIV+ patients were mock-treated, treated with anti-CD3+anti-CD28 antibodies (C+), bryostatin-1 (5nM), ing-B (10nM) or JQ1 (0.25μM) alone or in combination in the presence of cART. Six days post-treatment, concentrations of genomic viral RNA in culture supernatants were determined. Statistical comparisons to positive control are not indicated because p<0.05 for all the conditions (superiority of the positive control). Panels C-E. Dashed line indicates the 15 HIV-1 RNA copies/ml limit of detection. Panels A-E. Each symbol represents one cART-treated HIV+ patient. The means are represented.
Fig 4
Fig 4. PKC agonists and compounds releasing active P-TEFb induce HIV-1 recovery in CD8+-depleted PBMCs from cART-treated HIV+ aviremic patients.
Ex vivo cultures of CD8+-depleted PBMCs purified from blood of 24 patients were mock-treated or treated with anti-CD3+anti-CD28 antibodies, prostratin (0.5μM), bryostatin-1 (5nM), JQ1 (0.25μM), I-BET (0.25μM), I-BET151 (0.25μM) or HMBA (5mM) alone or in combination as indicated. Six days post-treatment, concentrations of genomic viral RNA in culture supernatants were determined and the values were expressed as HIV-1 RNA copies/ml. Total HIV-1 DNA was expressed as HIV-1 DNA copies/106 CD8+-depleted PBMCs. Values representing higher viral production after the combined treatment than after the single drug treatments are shown in grey. Values representing reactivation of the virus observed exclusively after combined treatments are shown in black. ‘I’ indicates below the 150 HIV-1 RNA copies/ml limit of detection. ‘//’ indicates not tested conditions.
Fig 5
Fig 5. PKC agonists and JQ1 induce HIV-1 recovery in resting CD4+ T cells from cART-treated HIV+ aviremic patients.
Ex vivo cultures of resting CD4+ T cells purified from blood of 15 patients were mock-treated or treated with anti-CD3+anti-CD28 antibodies, JQ1(0.25μM), prostratin (0.5μM), bryostatin-1 (5nM) or ing-B (10nM) alone or in combination as indicated. Six days post-treatment, concentrations of viral RNA in culture supernatants were determined and the values were expressed as HIV-1 RNA copies/ml. Total HIV-1 DNA was expressed as HIV-1 DNA copies/106 resting CD4+ T cells. Values representing higher viral production after a combinatory treatment than after the corresponding single drug treatments are shown in grey. Values representing reactivation of viral production observed exclusively after combined treatment are shown in black. ‘I’ indicates below the 150 HIV-1 RNA copies/ml limit of detection. ‘//’ indicates not tested conditions.
Fig 6
Fig 6. PKC agonists and JQ1 induce HIV-1 recovery in CD8+-depleted PBMCs from cART-treated HIV+ aviremic patients in the presence of cART.
Ex vivo cultures of CD8+-depleted PBMCs purified from blood of 11 patients were mock-treated or treated with anti-CD3+anti-CD28 antibodies, JQ1 (0.25μM), bryostatin-1 (5nM) or ing-B (10nM) alone or in combination as indicated. Concentrations of viral RNA in culture supernatants were determined one day, three days or six days post-treatment. The values were expressed as HIV-1 RNA copies/ml. Total HIV-1 DNA was expressed as HIV-1 DNA copies/106 CD8+-depleted PBMCs. Values representing higher viral production after a combinatory treatment than after the corresponding single drug treatments are shown in grey. Values representing reactivation of virus production observed exclusively after combined treatments are shown in black. ‘I’ indicates below the 15 HIV-1 RNA copies/ml limit of detection, ‘//’ indicates not tested conditions.
Fig 7
Fig 7. Synergistic inducibility of HIV-1 LTR promoter by PKC agonist+BETi/HMBA combinatory treatments depends on NF-κB.
Panel A. Jurkat cells were transiently transfected with the episomal plasmid containing the luciferase reporter gene driven either by the wild-type HIV LTR promoter (LTRwt-luc) or by the LTR promoter mutated in the two NF-κB binding sites (LTR-NFκBmut-luc). Twenty-four hours later, cells were mock-treated, treated with JQ1 (0.5μM), I-BET (0.5μM), I-BET151 (0.5μM), HMBA (5mM), bryostatin-1 (10nM) and prostratin (2.5μM) alone or in combination. Luciferase activities in cell extracts were measured 24 hours after drug treatments and reported as fold increases over the activity observed in mock-treated conditions (transfection of the reporter plasmid without drug treatment) and arbitrarily set at values of 1. An experiment performed in triplicates representative of two independent experiments is shown. Panel B. Nuclear extracts were prepared from Jurkat cells which were mock-treated, treated with bryostatin-1 (10nM), JQ1 (0.5μM) or with bryostatin-1+JQ1 for different time periods. An oligonucleotide corresponding to the HIV-1 LTR NF-κB sites was used as probe in EMSAs. As control for equal loading, the bottom panel shows comparability of the various nuclear extracts assessed by EMSA with an Oct-1 consensus probe.
Fig 8
Fig 8. PKC agonists synergize with BETi in releasing active P-TEFb.
Jurkat cells were mock-treated, treated with JQ1 (0.25μM), bryostatin-1 (5nM) alone or in combination for 1 hour (Panel A) or 24 hours (Panel B). Nuclear extracts were prepared from treated cells and subjected to immunoprecipitations (IP) with an anti-CDK9 antibody or the control IgG. The complexes were immunodetected for the presence of CycT1 and HEXIM-1 by Western blotting (right panels). Input controls for CDK9, CycT1 and HEXIM1 are presented (left panels). Levels of β-actin were measured to control protein loading. Panels A and B. Histograms represent quantification of band intensities normalized to CDK9 levels in the IP and then normalized to mock-treated condition. Panel C. HeLa cells expressing YC.P-TEFb and VN.CTD were left untreated or were treated as indicated for 1 hour. Venus-positive cells were detected by fluorescence microscopy (upper panels). Bright-field images were also taken (lower panels). Panel D. HeLa cells expressing YC.P-TEFb and VN.CTD were treated as outlined in C and Venus-positive cells were counted and averaged from three different areas. Error bars represent differences between counts of Venus-positive cells from the randomly chosen fields under the microscope. Panel E. Hela cells were transfected with the Hex1(-104)Luc reporter plasmid. At 24 hours post-transfection, cells were mock-treated or treated with the different compounds as indicated. Luciferase activities in cell extracts were measured 24 hours after drug treatments and reported as fold increases over the activity observed in mock-treated condition (transfection of the reporter plasmid without drug treatment) and arbitrarily set at a value of 1. An experiment performed in duplicate representative of two independent experiments is shown.
Fig 9
Fig 9. Bryostatin-1+JQ1-mediated HIV-1 reactivation is dependent on NF-κB and P-TEFb and independent from NFAT.
The T-lymphoid J-Lat 9.2 (panel A) and monocytic THP89GFP (panel B) cell lines harbor latent HIV-1 provirus containing gfp gene. The cells were pre-treated with the indicated inhibitors for 2 hours and then either mock-treated or treated with the combination bryostatin-1 [10nM]+JQ1 [0.5μM]. At 24 hours post-treatment, cells were analyzed by flow cytometry to quantify the proportion of cells expressing GFP. Means and standard errors of the means from duplicate samples are indicated. One representative experiment from two is represented.
Fig 10
Fig 10. Expression of cell surface activation markers following PKC agonists and JQ1 treatments.
Blood from 4 uninfected donors was split and one half was used to purify resting CD4+ T cells (panels A-E) and the other half was used to purify CD8+-depleted PBMCs (panels F-I). Cell cultures were mock-treated, treated with anti-CD3+anti-CD28 antibodies (C+), JQ1 [0.25μM], bryostatin-1 [5nM], prostratin [0.5μM] or ing-B [10nM] alone or in combination for 6 days. Cells were incubated with anti-CD38 (panels A and F), anti-CD69 (panels B and G), anti-HLA-DR (panels C and H), anti-CD25 (panels D and I) or anti-CD4 (panel E) antibodies prior to flow cytometry analysis. The results are presented as percentage of marker expression in the population of CD4+ cells (panels A-D and panels F-I) and as median fluorescence intensity (MFI) of CD4+ cells (panel E). Dashed line indicates the percentage of expression obtained in mock-treated cells. The means are represented. Statistical comparisons are indicated. Statistically relevant and not statistically relevant comparisons are indicated by asterisk and “ns”, respectively.

Similar articles

Cited by

References

    1. Smit C, Geskus R, Walker S, Sabin C, Coutinho R, et al. (2006) Effective therapy has altered the spectrum of cause-specific mortality following HIV seroconversion. AIDS 20: 741–749. - PubMed
    1. Friis-Moller N, Sabin CA, Weber R, d'Arminio Monforte A, El-Sadr WM, et al. (2003) Combination antiretroviral therapy and the risk of myocardial infarction. N Engl J Med 349: 1993–2003. - PubMed
    1. Blankson JN, Persaud D, Siliciano RF (2002) The challenge of viral reservoirs in HIV-1 infection. Annu Rev Med 53: 557–593. - PubMed
    1. Crowe S, Zhu T, Muller WA (2003) The contribution of monocyte infection and trafficking to viral persistence, and maintenance of the viral reservoir in HIV infection. J Leukoc Biol 74: 635–641. - PubMed
    1. Lewin SR, Kirihara J, Sonza S, Irving L, Mills J, et al. (1998) HIV-1 DNA and mRNA concentrations are similar in peripheral blood monocytes and alveolar macrophages in HIV-1-infected individuals. AIDS 12: 719–727. - PubMed

Publication types

MeSH terms

Grants and funding

We acknowledge grant support from the “Agence Nationale de Recherches sur le SIDA” (ANRS, France), the Belgian Fund for Scientific Research (FRS-FNRS, Belgium), the “Fondation Roi Baudouin”, the NEAT program, the Walloon Region (the Excellence Program “Cibles”) and the “Institut Universitaire de France (IUF)” (to OR). AK is a post-doctoral fellow of "Les Amis des Instituts Pasteur à Bruxelles, asbl". SB is a fellow of the Belgian « Fonds pour la Recherche dans l’Industrie et l’Agriculture (FRIA) ». BVD is an ANRS post-doctoral fellow. GD and CVL are Aspirant fellow and Research Director of the FRS-FNRS, respectively. The funders had no role in study design, data collection and analysis, decision to publish, or preparation of the manuscript.