miR-126 Is Involved in Vascular Remodeling under Laminar Shear Stress
- PMID: 26221595
- PMCID: PMC4499382
- DOI: 10.1155/2015/497280
miR-126 Is Involved in Vascular Remodeling under Laminar Shear Stress
Abstract
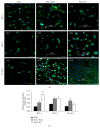
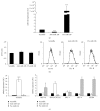
Morphology and changes in gene expression of vascular endothelium are mainly due to shear stress and inflammation. Cell phenotype modulation has been clearly demonstrated to be controlled by small noncoding micro-RNAs (miRNAs). This study focused on the effect of laminar shear stress (LSS) on human endothelial cells (HUVECs), with an emphasis on the role of miRNA-126 (miR-126). Exposure of HUVECs in vitro to LSS modified the shape of HUVECs and concomitantly regulated the expression of miR-126, vascular cell adhesion molecule 1 (VCAM-1), and syndecan-4 (SDC-4). A significant upregulation of miR-126 during long-term exposure to flow was shown. Interestingly, LSS enhanced SDC-4 expression on the HUVEC membranes. Overexpression of miR-126 in HUVECs decreased the levels of targets stromal cell-derived factor-1 SDF-1/CXCL12 and VCAM-1 but increased the expression of RGS16, CXCR4, and SDC-4. No significant difference in terms of cell proliferation and apoptosis was observed between scramble, anti-miR-126, and pre-miR-126 transfected HUVECs. In Apo-E KO/CKD mice aortas expressing a high level of miR-126, SDC-4 was concomitantly increased. In conclusion, our results suggest that miR-126 (i) is overexpressed by long-term LSS, (ii) has a role in up- and downregulation of genes involved in atherosclerosis, and (iii) affects SDC-4 expression.
Figures


Similar articles
-
Possible involvement of microRNAs in vascular damage in experimental chronic kidney disease.Biochim Biophys Acta. 2014 Jan;1842(1):88-98. doi: 10.1016/j.bbadis.2013.10.005. Epub 2013 Oct 16. Biochim Biophys Acta. 2014. PMID: 24140891
-
MicroRNA-101 mediates the suppressive effect of laminar shear stress on mTOR expression in vascular endothelial cells.Biochem Biophys Res Commun. 2012 Oct 12;427(1):138-42. doi: 10.1016/j.bbrc.2012.09.026. Epub 2012 Sep 16. Biochem Biophys Res Commun. 2012. PMID: 22989749
-
MicroRNA-30 mediates anti-inflammatory effects of shear stress and KLF2 via repression of angiopoietin 2.J Mol Cell Cardiol. 2015 Nov;88:111-9. doi: 10.1016/j.yjmcc.2015.10.009. Epub 2015 Oct 9. J Mol Cell Cardiol. 2015. PMID: 26456066
-
Atheroprotective mechanisms of shear stress-regulated microRNAs.Thromb Haemost. 2012 Oct;108(4):616-20. doi: 10.1160/TH12-07-0491. Epub 2012 Sep 5. Thromb Haemost. 2012. PMID: 22955103 Review.
-
"Go with the flow": how Krüppel-like factor 2 regulates the vasoprotective effects of shear stress.Antioxid Redox Signal. 2011 Sep 1;15(5):1449-61. doi: 10.1089/ars.2010.3647. Epub 2011 Apr 15. Antioxid Redox Signal. 2011. PMID: 20919941 Free PMC article. Review.
Cited by
-
Evaluation of microRNA Expression Features in Patients with Various Types of Arterial Damage: Thoracic Aortic Aneurysm and Coronary Atherosclerosis.J Pers Med. 2023 Jul 20;13(7):1161. doi: 10.3390/jpm13071161. J Pers Med. 2023. PMID: 37511774 Free PMC article.
-
New Insight into Mechanisms of Cardiovascular Diseases: An Integrative Analysis Approach to Identify TheranoMiRNAs.Int J Mol Sci. 2023 Apr 5;24(7):6781. doi: 10.3390/ijms24076781. Int J Mol Sci. 2023. PMID: 37047756 Free PMC article.
-
miR-126 promotes M1 to M2 macrophage phenotype switching via VEGFA and KLF4.PeerJ. 2023 Mar 31;11:e15180. doi: 10.7717/peerj.15180. eCollection 2023. PeerJ. 2023. PMID: 37020848 Free PMC article.
-
Vaccine Formulation Strategies and Challenges Involved in RNA Delivery for Modulating Biomarkers of Cardiovascular Diseases: A Race from Laboratory to Market.Vaccines (Basel). 2023 Jan 21;11(2):241. doi: 10.3390/vaccines11020241. Vaccines (Basel). 2023. PMID: 36851119 Free PMC article. Review.
-
Vascular mechanotransduction.Physiol Rev. 2023 Apr 1;103(2):1247-1421. doi: 10.1152/physrev.00053.2021. Epub 2023 Jan 5. Physiol Rev. 2023. PMID: 36603156 Free PMC article. Review.
References
Publication types
MeSH terms
Substances
LinkOut - more resources
Full Text Sources
Other Literature Sources
Research Materials
Miscellaneous

