A comprehensive, genome-wide analysis of autophagy-related genes identified in tobacco suggests a central role of autophagy in plant response to various environmental cues
- PMID: 26205094
- PMCID: PMC4535619
- DOI: 10.1093/dnares/dsv012
A comprehensive, genome-wide analysis of autophagy-related genes identified in tobacco suggests a central role of autophagy in plant response to various environmental cues
Abstract
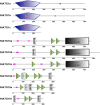
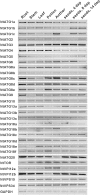
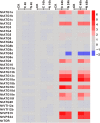
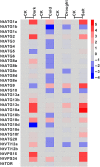
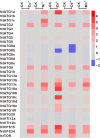
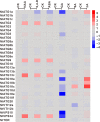
Autophagy is an evolutionarily conserved mechanism in both animals and plants, which has been shown to be involved in various essential developmental processes in plants. Nicotiana tabacum is considered to be an ideal model plant and has been widely used for the study of the roles of autophagy in the processes of plant development and in the response to various stresses. However, only a few autophagy-related genes (ATGs) have been identified in tobacco up to now. Here, we identified 30 ATGs belonging to 16 different groups in tobacco through a genome-wide survey. Comprehensive expression profile analysis reveals an abroad expression pattern of these ATGs, which could be detected in all tissues tested under normal growth conditions. Our series tests further reveal that majority of ATGs are sensitive and responsive to different stresses including nutrient starvation, plant hormones, heavy metal and other abiotic stresses, suggesting a central role of autophagy, likely as an effector, in plant response to various environmental cues. This work offers a detailed survey of all ATGs in tobacco and also suggests manifold functions of autophagy in both normal plant growth and plant response to environmental stresses.
Keywords: autophagy; environmental stresses; gene expression; signalling; tobacco.
© The Author 2015. Published by Oxford University Press on behalf of Kazusa DNA Research Institute.
Figures



Similar articles
-
Genome-wide evolutionary characterization and analysis of bZIP transcription factors and their expression profiles in response to multiple abiotic stresses in Brachypodium distachyon.BMC Genomics. 2015 Mar 22;16(1):227. doi: 10.1186/s12864-015-1457-9. BMC Genomics. 2015. PMID: 25887221 Free PMC article.
-
Comprehensive Analysis of Autophagy-Related Genes in Sweet Orange (Citrus sinensis) Highlights Their Roles in Response to Abiotic Stresses.Int J Mol Sci. 2020 Apr 13;21(8):2699. doi: 10.3390/ijms21082699. Int J Mol Sci. 2020. PMID: 32295035 Free PMC article.
-
Network and role analysis of autophagy in Phytophthora sojae.Sci Rep. 2017 May 12;7(1):1879. doi: 10.1038/s41598-017-01988-7. Sci Rep. 2017. PMID: 28500315 Free PMC article.
-
A potential role of microRNAs in plant response to metal toxicity.Metallomics. 2013 Sep;5(9):1184-90. doi: 10.1039/c3mt00022b. Metallomics. 2013. PMID: 23579282 Review.
-
Autophagy in Plant Abiotic Stress Management.Int J Mol Sci. 2021 Apr 15;22(8):4075. doi: 10.3390/ijms22084075. Int J Mol Sci. 2021. PMID: 33920817 Free PMC article. Review.
Cited by
-
Identification and Expression Analysis of the Solanum tuberosum StATG8 Family Associated with the WRKY Transcription Factor.Plants (Basel). 2022 Oct 26;11(21):2858. doi: 10.3390/plants11212858. Plants (Basel). 2022. PMID: 36365311 Free PMC article.
-
The E3 Ubiquitin Ligase Gene Sl1 Is Critical for Cadmium Tolerance in Solanum lycopersicum L.Antioxidants (Basel). 2022 Feb 25;11(3):456. doi: 10.3390/antiox11030456. Antioxidants (Basel). 2022. PMID: 35326106 Free PMC article.
-
Identification of the autophagy pathway in a mollusk bivalve, Crassostrea gigas.Autophagy. 2020 Nov;16(11):2017-2035. doi: 10.1080/15548627.2020.1713643. Epub 2020 Jan 22. Autophagy. 2020. PMID: 31965890 Free PMC article.
-
Genome-wide analysis of autophagy-related genes in banana highlights MaATG8s in cell death and autophagy in immune response to Fusarium wilt.Plant Cell Rep. 2017 Aug;36(8):1237-1250. doi: 10.1007/s00299-017-2149-5. Epub 2017 Apr 27. Plant Cell Rep. 2017. PMID: 28451821
-
Autophagy-mediated degradation of integumentary tapetum is critical for embryo pattern formation.Nat Commun. 2024 Mar 27;15(1):2676. doi: 10.1038/s41467-024-46902-8. Nat Commun. 2024. PMID: 38538581 Free PMC article.
References
-
- Bassham D.C. 2007, Plant autophagy—more than a starvation response, Curr. Opin. Plant Biol., 10, 587–93. - PubMed
-
- Nakatogawa H., Suzuki K., Kamada Y., Ohsumi Y.. 2009, Dynamics and diversity in autophagy mechanisms: lessons from yeast, Nat. Rev. Mol. Cell Biol., 10, 458–67. - PubMed
-
- Il Kwon S., Park O.K.. 2008, Autophagy in plants, J Plant Biol., 51, 313–20.
Publication types
MeSH terms
Substances
LinkOut - more resources
Full Text Sources
Other Literature Sources

